![Synthetic Volatility Index Indicator for MetaTrader 5 Download - Free - [TFlab]](https://cdn.tradingfinder.com/image/276679/4-57-en-synthetic-volatility-index-mt5-1.webp)
![Synthetic Volatility Index Indicator for MetaTrader 5 Download - Free - [TFlab] 0](https://cdn.tradingfinder.com/image/276679/4-57-en-synthetic-volatility-index-mt5-1.webp)
![Synthetic Volatility Index Indicator for MetaTrader 5 Download - Free - [TFlab] 1](https://cdn.tradingfinder.com/image/276685/4-57-en-synthetic-volatility-index-mt5-2.webp)
![Synthetic Volatility Index Indicator for MetaTrader 5 Download - Free - [TFlab] 2](https://cdn.tradingfinder.com/image/276686/4-57-en-synthetic-volatility-index-mt5-3.webp)
![Synthetic Volatility Index Indicator for MetaTrader 5 Download - Free - [TFlab] 3](https://cdn.tradingfinder.com/image/276682/4-57-en-synthetic-volatility-index-mt5-4.webp)
The Synthetic Volatility Index (SVI) Indicator is one of the MetaTrader 5 indicators used for measuring market volatility.
This indicator does not provide direct buy or sell signals, but instead represents the state of market volatility.
When the VIX value falls below 1, the probability of a price increase rises. Conversely, if VIX surpasses 0 and continues to rise, price tends to decline.
Indicator Specifications Table
The table below summarizes the key features of the Synthetic Volatility Index Oscillator.
Indicator Categories: | Oscillators MT5 Indicators Volatility MT5 Indicators Trading Assist MT5 Indicators |
Platforms: | MetaTrader 5 Indicators |
Trading Skills: | Intermediate |
Indicator Types: | Range MT5 Indicators Reversal MT5 Indicators |
Timeframe: | Multi-Timeframe MT5 Indicators |
Trading Style: | Intraday MT5 Indicators |
Trading Instruments: | Forex MT5 Indicators Crypto MT5 Indicators Stock MT5 Indicators Forward MT5 Indicators |
Indicator at a Glance
The Synthetic Volatility Index Indicator first identifies the highest closing price within a 22-candle period, then subtracts the lowest price of the same period. The result is then divided by the highest closing price of the same 22-period and multiplied by 100 to adjust the scale.
Indicator in an Uptrend
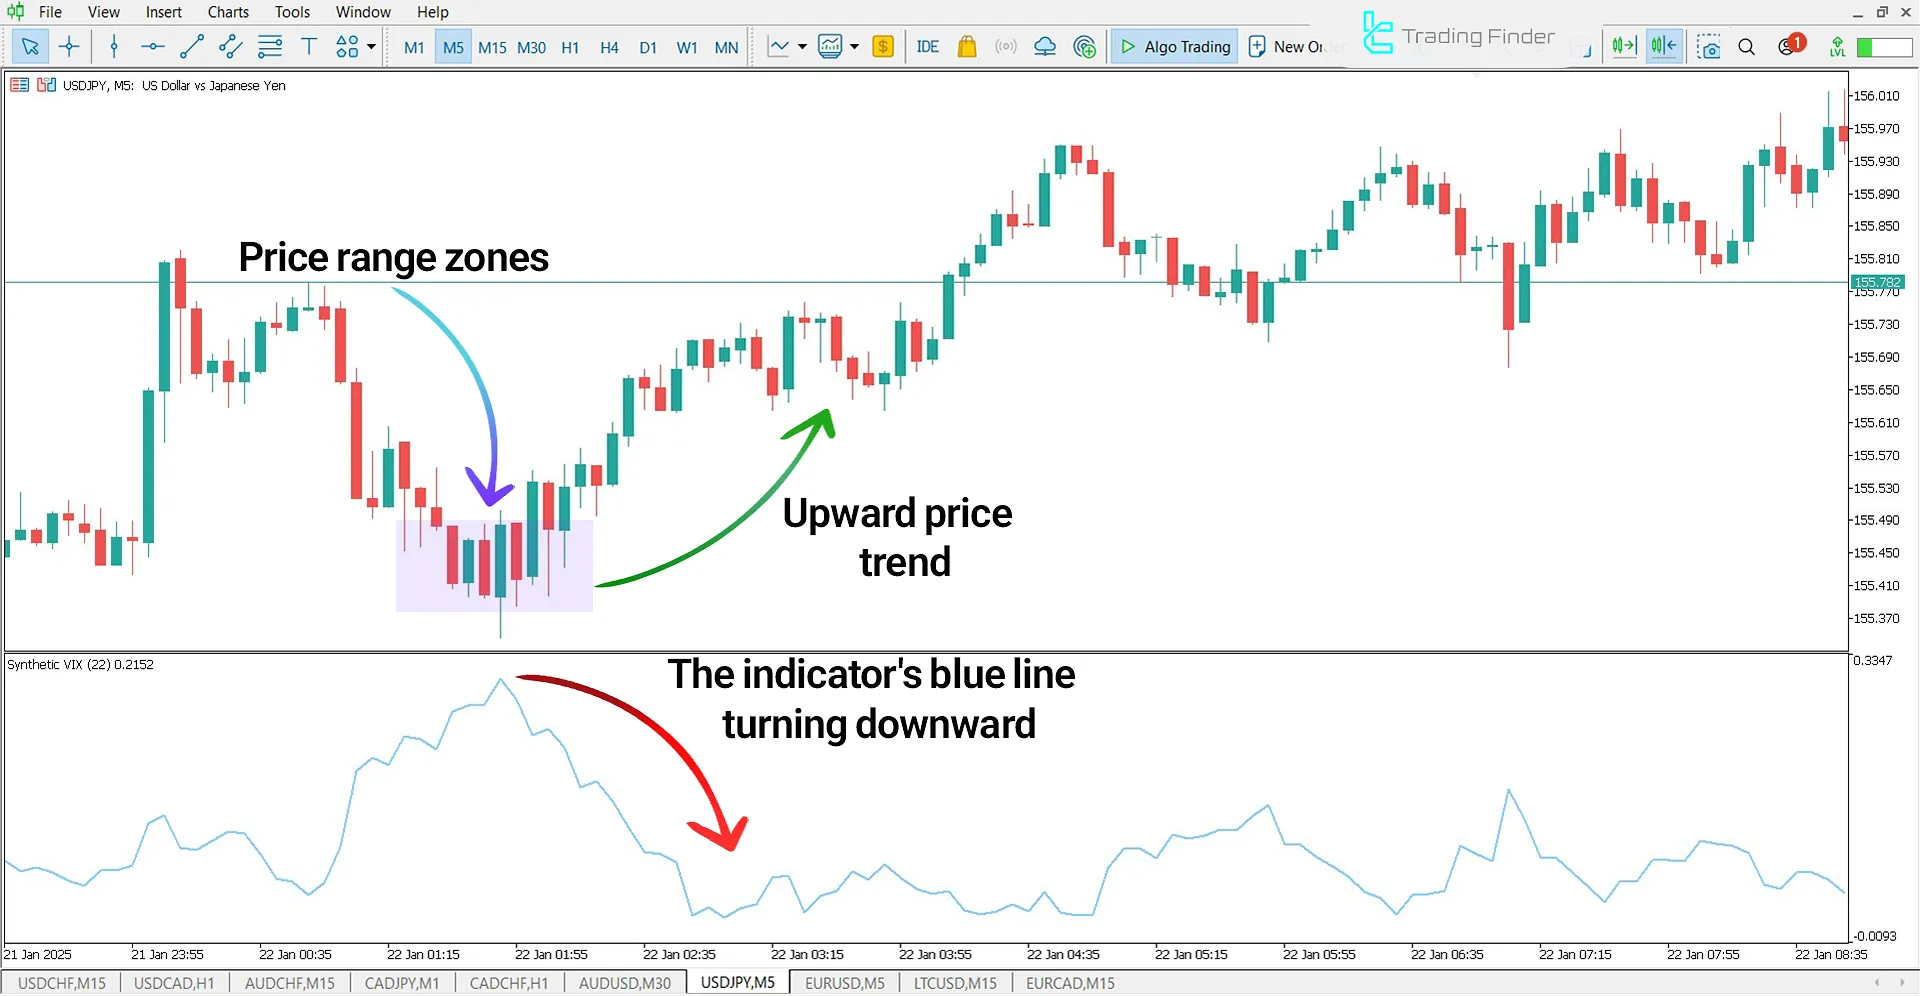
In the USD/JPY currency pair on the 5-minute timeframe, price consolidates within a narrow range before gathering liquidity
and moving upward. In the oscillator window, the blue line trends downward, signaling a bullish price movement.

Indicator in a Downtrend
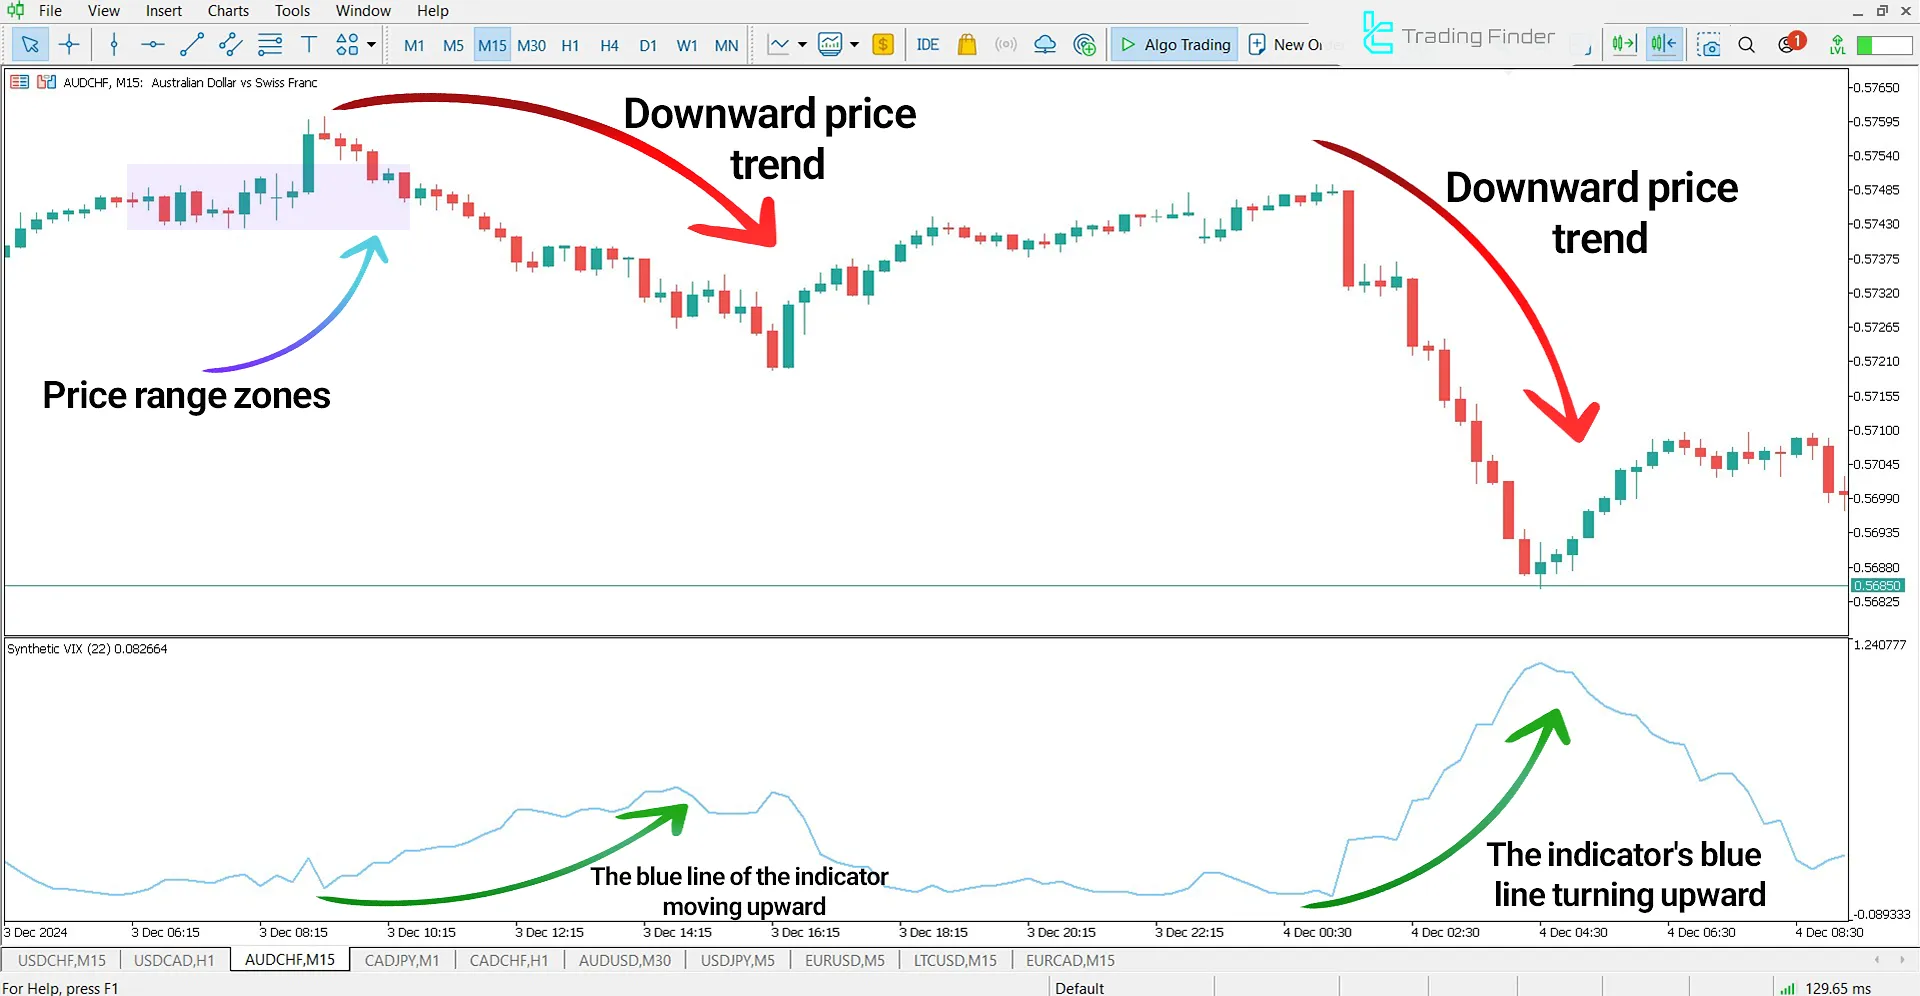
On the 15-minute chart of the AUD/CHF currency pair, price fluctuates within a range. With each price decline, the oscillator line moves upward.
Traders use this pattern to identify breakout opportunities and determine entry points in the market.

Indicator Settings
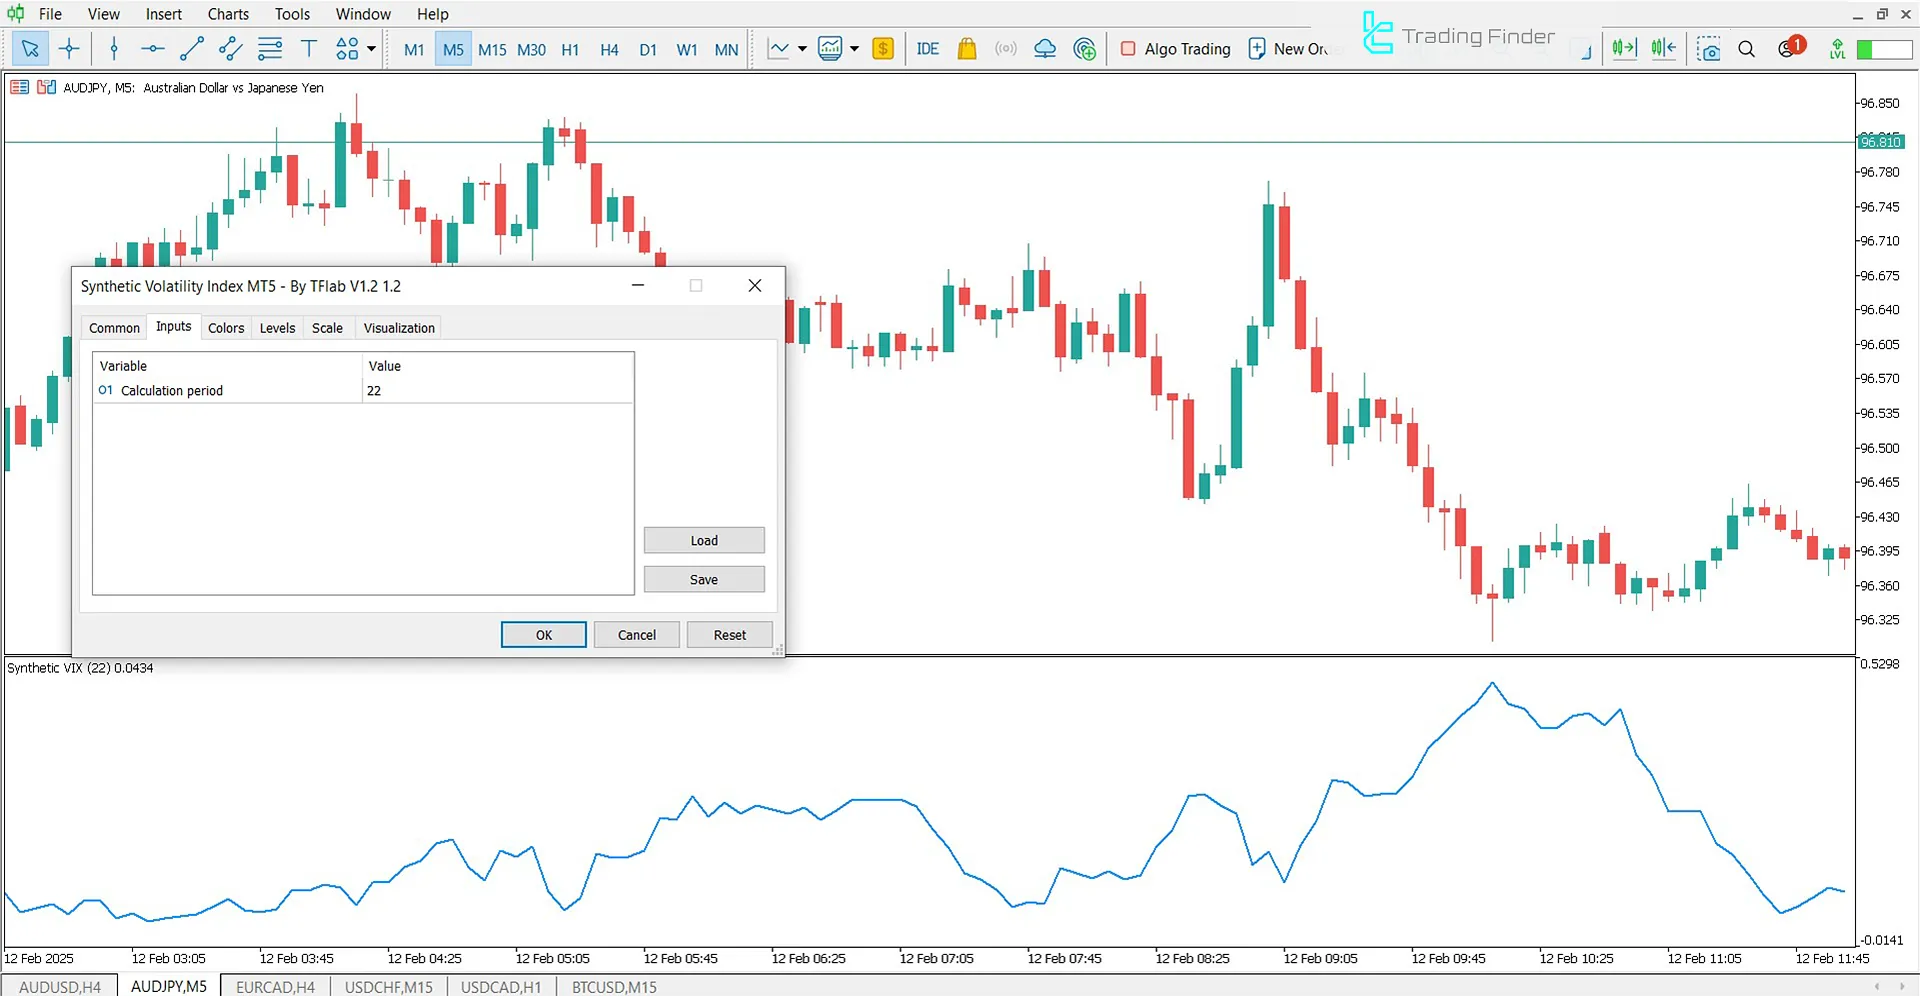
The image below displays the settings section of the Synthetic Volatility Index Indicator:

- Period: Defines the calculation period for candles in the indicator
Conclusion
The Synthetic Volatility Index Indicator performs best in range-bound or uncertain market conditions.
When price fluctuates within a tight range and a breakout is imminent, this indicator analyzes trend strength and the probability of a breakout, helping traders assess market volatility levels.
Synthetic Volatility Index MT5 PDF
Synthetic Volatility Index MT5 PDF
Click to download Synthetic Volatility Index MT5 PDFHow can the Synthetic Volatility Index Indicator be used for analysis?
This indicator enables analysts to assess trend strength and breakout probability in range-bound or uncertain market conditions.
Is this indicator suitable for all markets?
Yes, the Synthetic Volatility Index Indicator is effective not only in Forex markets but also in cryptocurrency trading and other financial assets.


