![T3 RSI Indicator for MetaTrader 5 Download – Free – [TFlab]](https://cdn.tradingfinder.com/image/368929/4-84-en-t3-rsi-mt5-1.webp)
![T3 RSI Indicator for MetaTrader 5 Download – Free – [TFlab] 0](https://cdn.tradingfinder.com/image/368929/4-84-en-t3-rsi-mt5-1.webp)
![T3 RSI Indicator for MetaTrader 5 Download – Free – [TFlab] 1](https://cdn.tradingfinder.com/image/368930/4-84-en-t3-rsi-mt5-2.webp)
![T3 RSI Indicator for MetaTrader 5 Download – Free – [TFlab] 2](https://cdn.tradingfinder.com/image/368926/4-84-en-t3-rsi-mt5-3.webp)
![T3 RSI Indicator for MetaTrader 5 Download – Free – [TFlab] 3](https://cdn.tradingfinder.com/image/368925/4-84-en-t3-rsi-mt5-4.webp)
The T3 RSI Indicator is a modern hybrid of two popular tools: the Relative Strength Index (RSI) and the Triple Exponential Moving Average (T3).
By applying the T3 smoothing filter, a significant portion of price noise is removed, allowing data to be displayed with greater clarity on the chart.
In this indicator, theT3 Moving Average is overlaid on the RSI oscillator as a red line and plays a key role in generating buy and sell signals.
T3 RSI Indicator Table
The specifications of the T3 RSI Indicator are summarized in the table below:
Indicator Categories: | Oscillators MT5 Indicators Volatility MT5 Indicators Trading Assist MT5 Indicators RSI Indicators for MetaTrader 5 |
Platforms: | MetaTrader 5 Indicators |
Trading Skills: | Elementary |
Indicator Types: | Leading MT5 Indicators Overbought & Oversold MT5 Indicators |
Timeframe: | Multi-Timeframe MT5 Indicators |
Trading Style: | Intraday MT5 Indicators |
Trading Instruments: | Forex MT5 Indicators Crypto MT5 Indicators Stock MT5 Indicators Forward MT5 Indicators |
Indicator at a Glance
RSI is one of the most well-known indicators on the MetaTrader 5 platform. It measures the speed and strength of price movements over a given period, identifying overbought zones (above 70) and oversold zones (below 30).
When combined with the T3 Moving Average, this classic tool becomes more precise in tracking price behavior. Whenever the RSI line crosses the red T3 Moving Average, the crossover is considered a valid bullish or bearish signal.
Indicator in an Uptrend
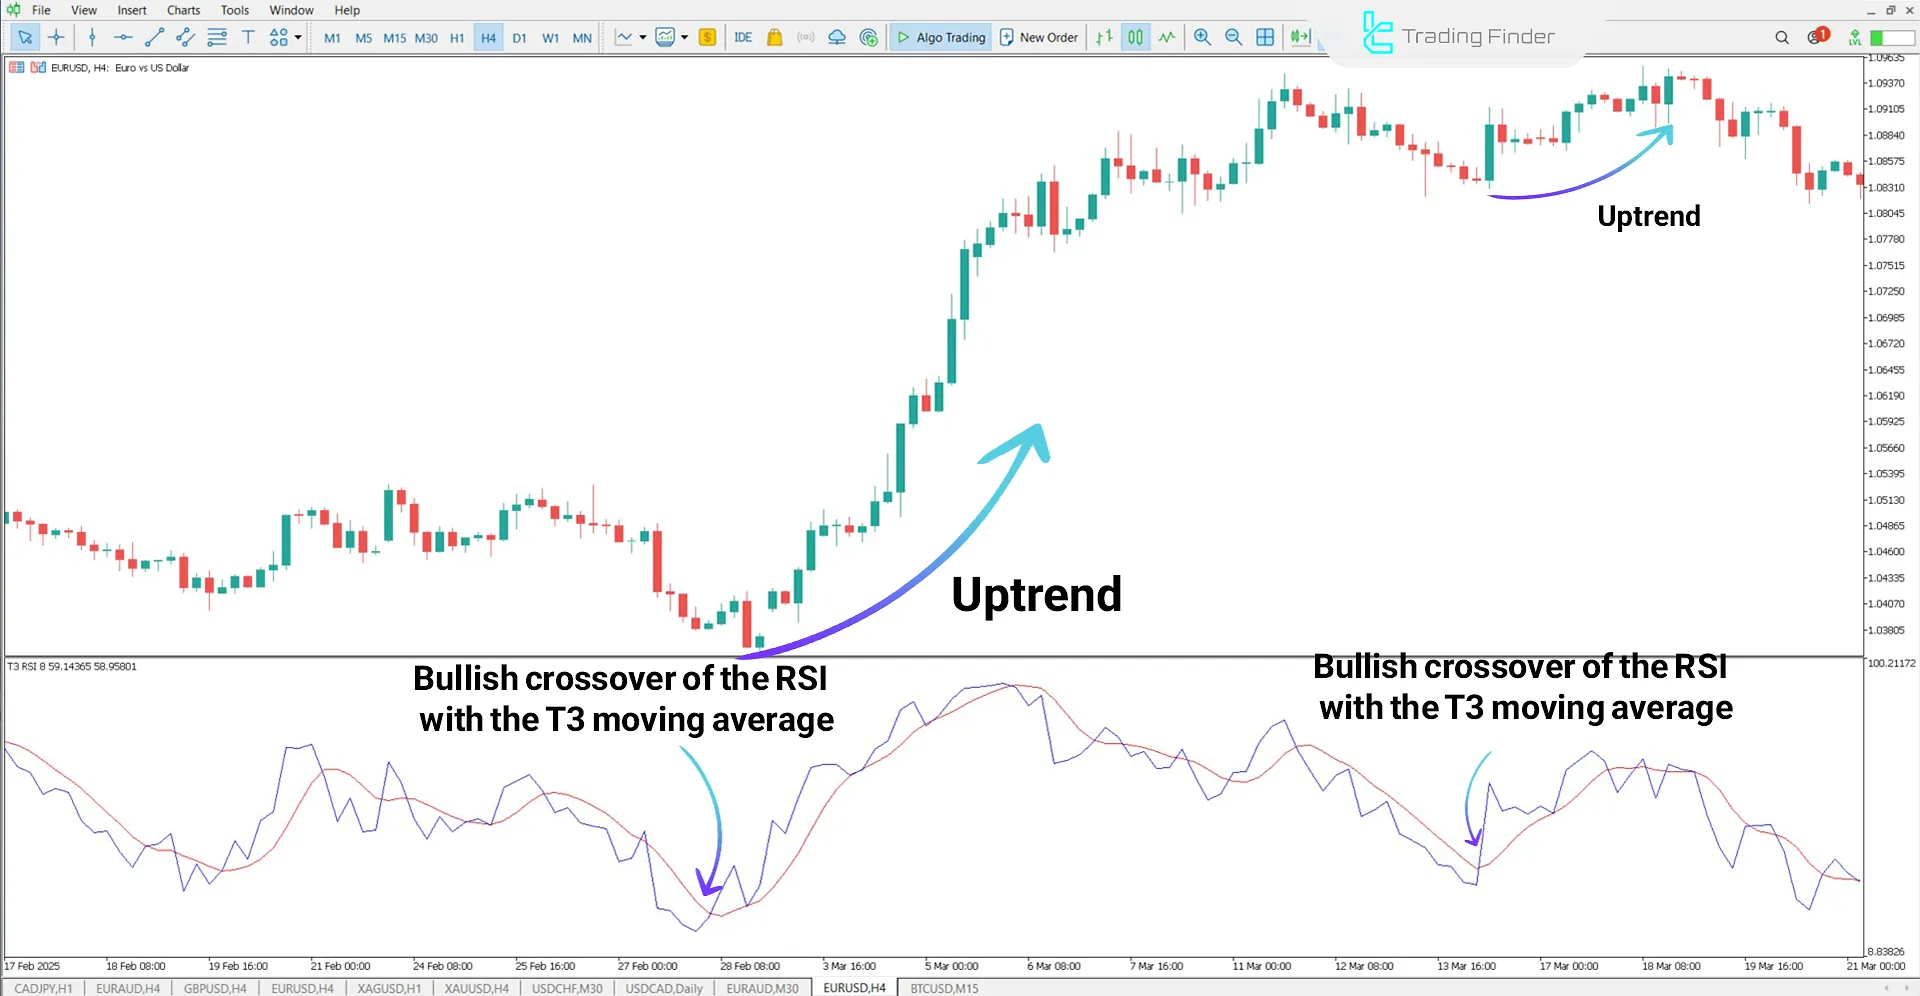
On the EUR/USD chart in the 4-hour timeframe, the RSI line crossing above the T3 Moving Average marks the start of an upward trend.
To improve analysis accuracy, traders can combine this signal with price positioning in oversold zones and enter buy positions within those areas.

Indicator in a Downtrend
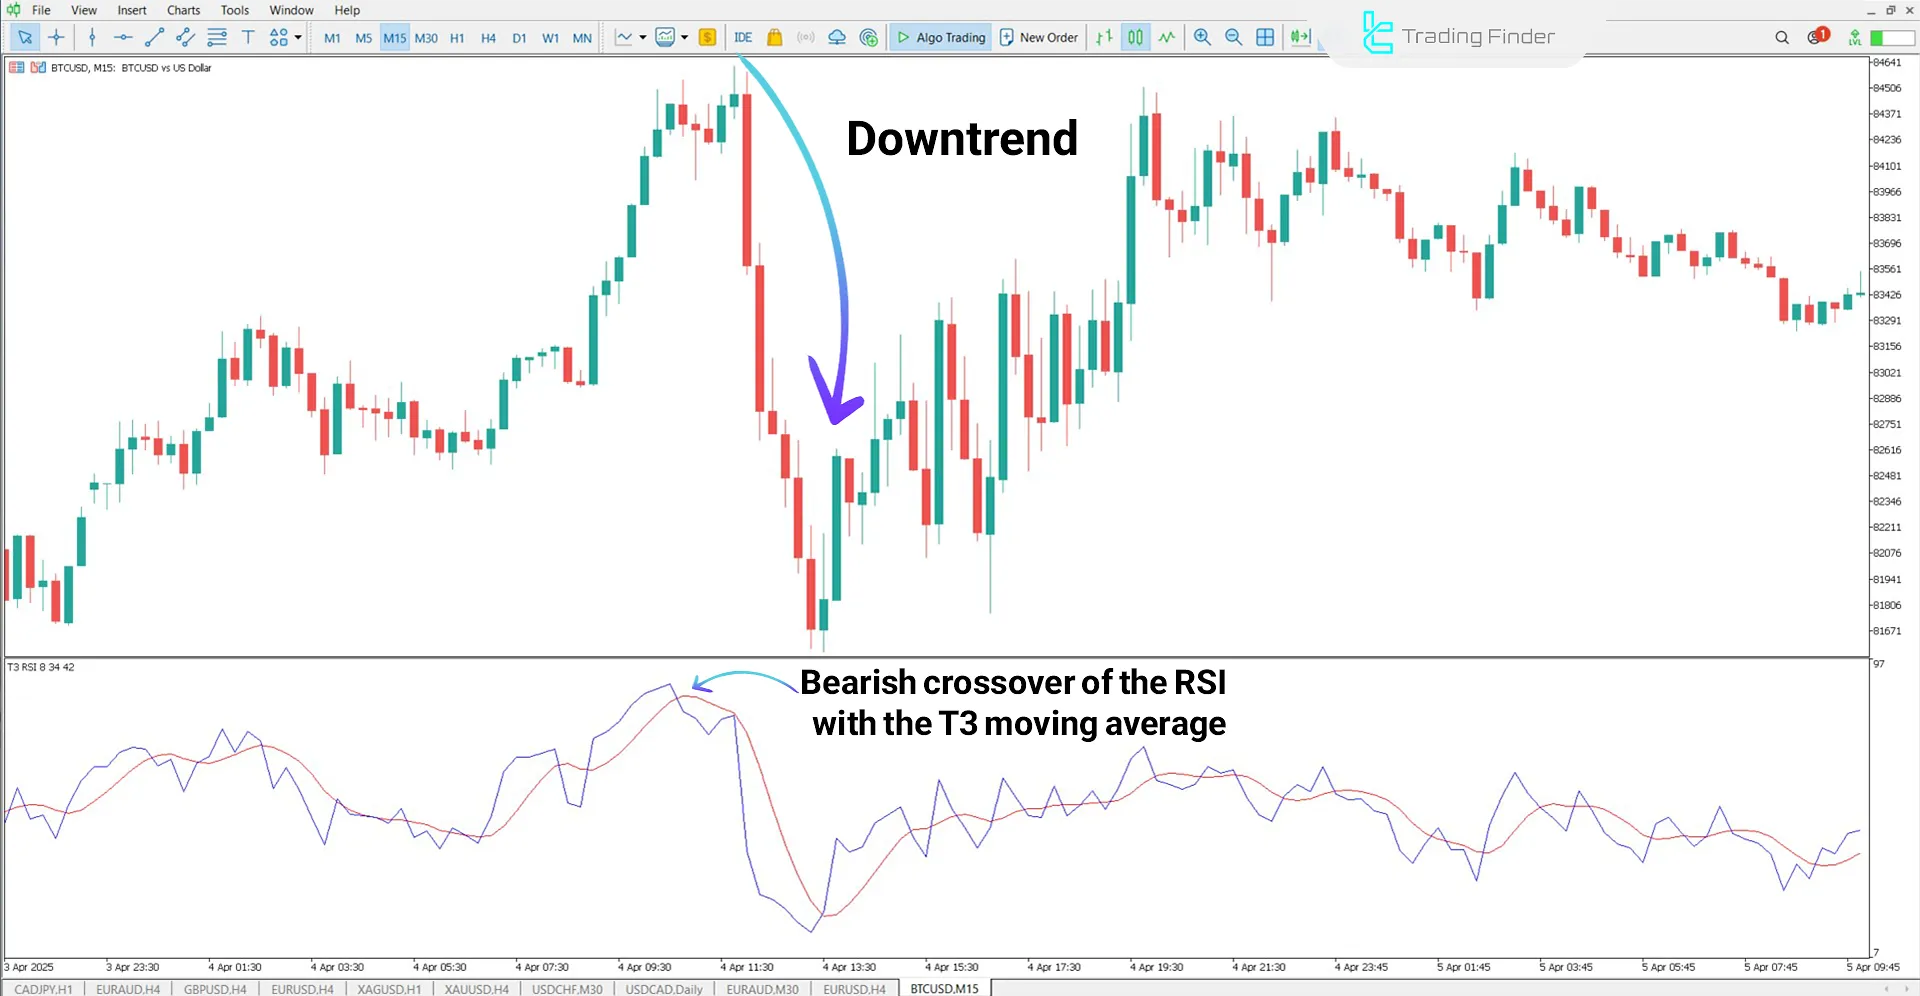
In the Bitcoin (BTC) chart, the RSI line crossing below the T3 Moving Average signals the start of a downward trend.
To further validate this bearish signal, traders can look for price positioning near resistance levels or in overbought zones before entering a sell position.

T3 RSI Indicator Settings
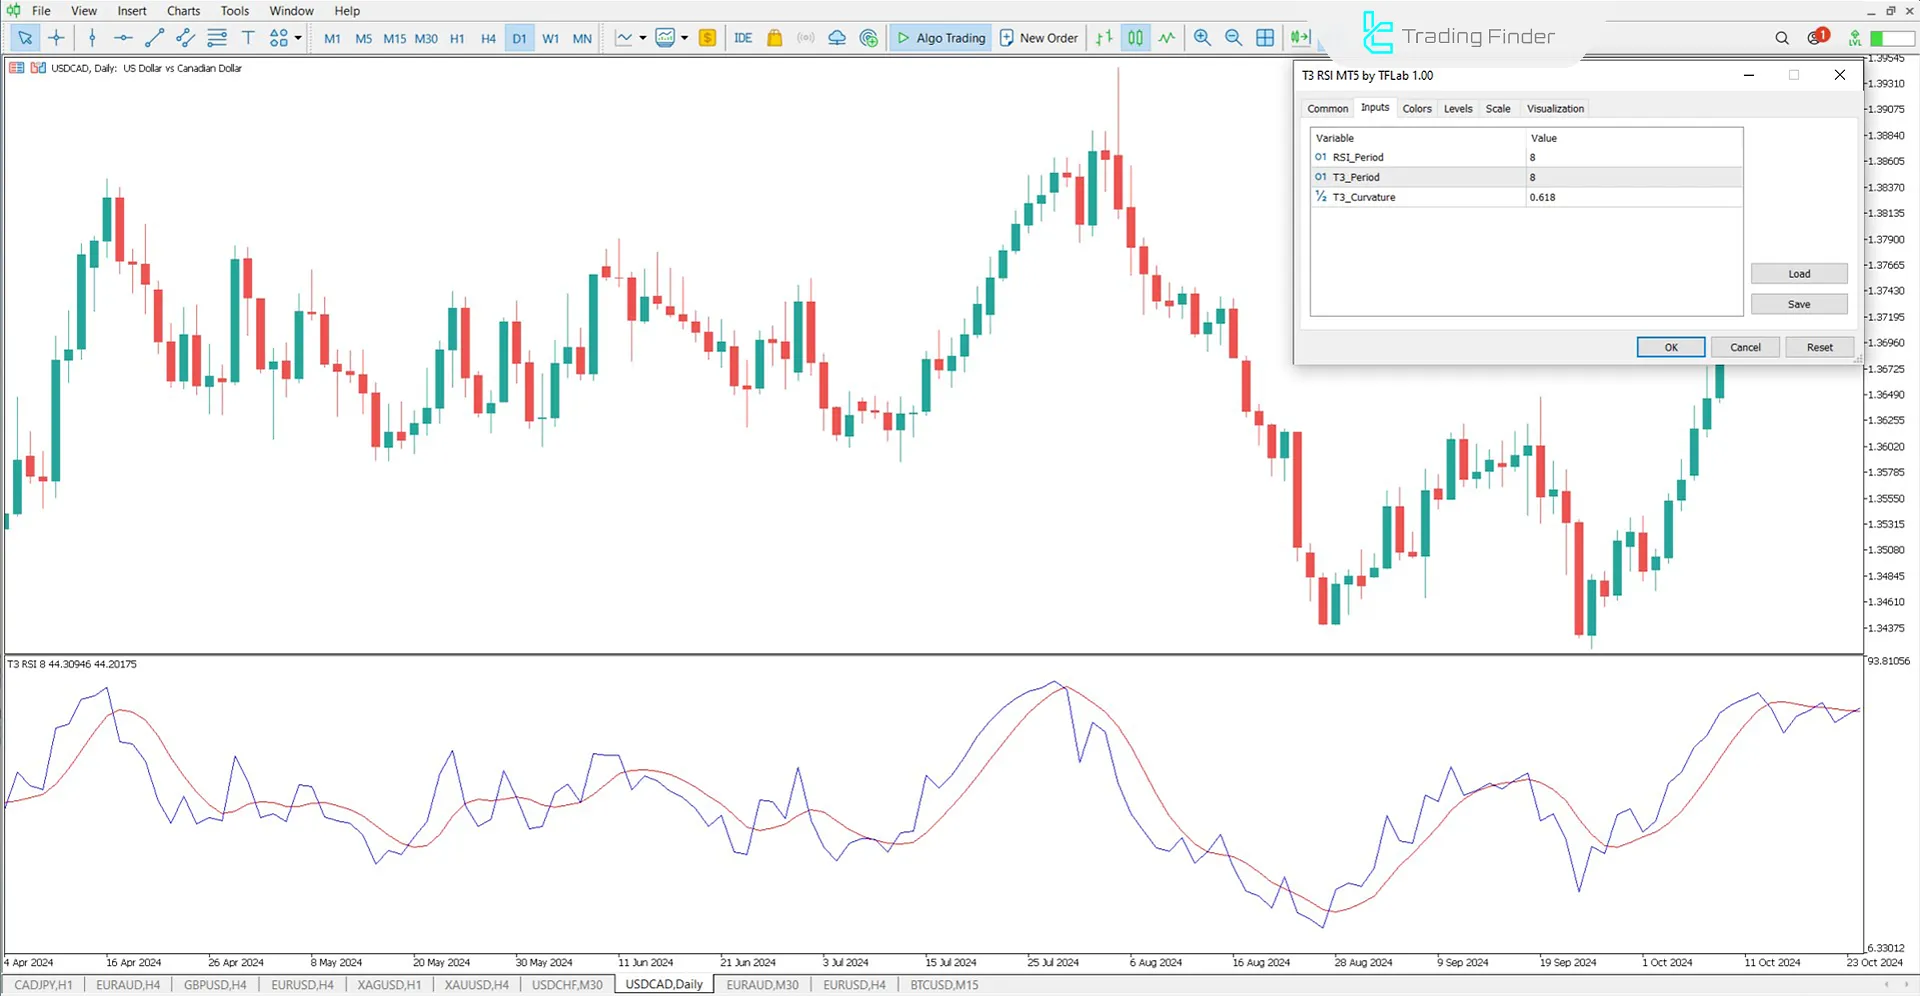
The parameter settings of the T3 RSI oscillator are shown in the image below:

- RSI_Period: Calculation period for the Relative Strength Index (RSI)
- T3_Period: Calculation period for the T3 Moving Average
- T3_Curvature: Curvature factor of the T3 Moving Average
Conclusion
The T3 RSI hybrid indicator is an enhanced version of the RSI that, when combined with the T3 Moving Average, becomes a powerful tool for analyzing trends, momentum strength, and overbought/oversold zones.
Thanks to its fusion of RSI’s oscillating logic and T3’s smoothing algorithm, the T3 RSI Oscillator is ideal for traders seeking lower-error signals and stable performance in key market zones.
T3 RSI MT5 PDF
T3 RSI MT5 PDF
Click to download T3 RSI MT5 PDFIs the T3 RSI Indicator suitable for all timeframes?
Yes, this indicator can be used across all timeframes, from M1 to D1.
Can the settings of this indicator be customized?
Yes; in the settings panel, you can adjust the RSI period, T3 length, and T3 curvature based on your trading strategy.


