![Tarzan Arrows Indicator for MetaTrader 5 – [TradingFinder]](https://cdn.tradingfinder.com/image/442447/2-97-en-tarzan-arrows-mt5-1.webp)
![Tarzan Arrows Indicator for MetaTrader 5 – [TradingFinder] 0](https://cdn.tradingfinder.com/image/442447/2-97-en-tarzan-arrows-mt5-1.webp)
![Tarzan Arrows Indicator for MetaTrader 5 – [TradingFinder] 1](https://cdn.tradingfinder.com/image/442446/2-97-en-tarzan-arrows-mt5-2.webp)
![Tarzan Arrows Indicator for MetaTrader 5 – [TradingFinder] 2](https://cdn.tradingfinder.com/image/442448/2-97-en-tarzan-arrows-mt5-3.webp)
![Tarzan Arrows Indicator for MetaTrader 5 – [TradingFinder] 3](https://cdn.tradingfinder.com/image/442449/2-97-en-tarzan-arrows-mt5-4.webp)
On July 6, 2025, in version 2, alert/notification and signal functionality was added to this indicator
The Tarzan Arrows Indicator, designed for the MetaTrader 5 platform, uses the Relative Strength Index(RSI) and Moving Averages to identify bullish or bearish market trends.
By analyzing the relative strength of the current trend compared to the previous one, this tool draws a channel over the RSI chart and identifies key points for entering or exiting trades.
Tarzan Arrows Indicator Table
The table below displays the general specifications of the Tarzan Arrows Indicator:
Indicator Categories: | Oscillators MT5 Indicators Signal & Forecast MT5 Indicators Trading Assist MT5 Indicators |
Platforms: | MetaTrader 5 Indicators |
Trading Skills: | Elementary |
Indicator Types: | Reversal MT5 Indicators |
Timeframe: | Multi-Timeframe MT5 Indicators |
Trading Style: | Intraday MT5 Indicators |
Trading Instruments: | Forex MT5 Indicators Crypto MT5 Indicators Stock MT5 Indicators Commodity MT5 Indicators Indices MT5 Indicators Share Stock MT5 Indicators Binary Options MT5 Indicators |
Overview of the Indicator
The Tarzan Arrows Indicator uses the RSI and moving average, and visualizes market conditions using a colored channel, as described below:
- RSI-Based Channel Formation: The channel is formed using the moving average, RSI, and upper and lower bands. This structure acts as a bounded zone, limiting RSI fluctuations within a defined range;
- RSI Line Entering the Channel: When the RSI value enters this channel from above or below, it signals a weakening or reversal in the market trend;
- Channel Color Change as Trade Signal: If RSI enters the channel from below, the indicator generates a bullish signal and the channel turns green. Conversely, when RSI enters from above, it indicates apotential bearish reversal, and the channel color changes to red.
Indicator in a Bullish Trend
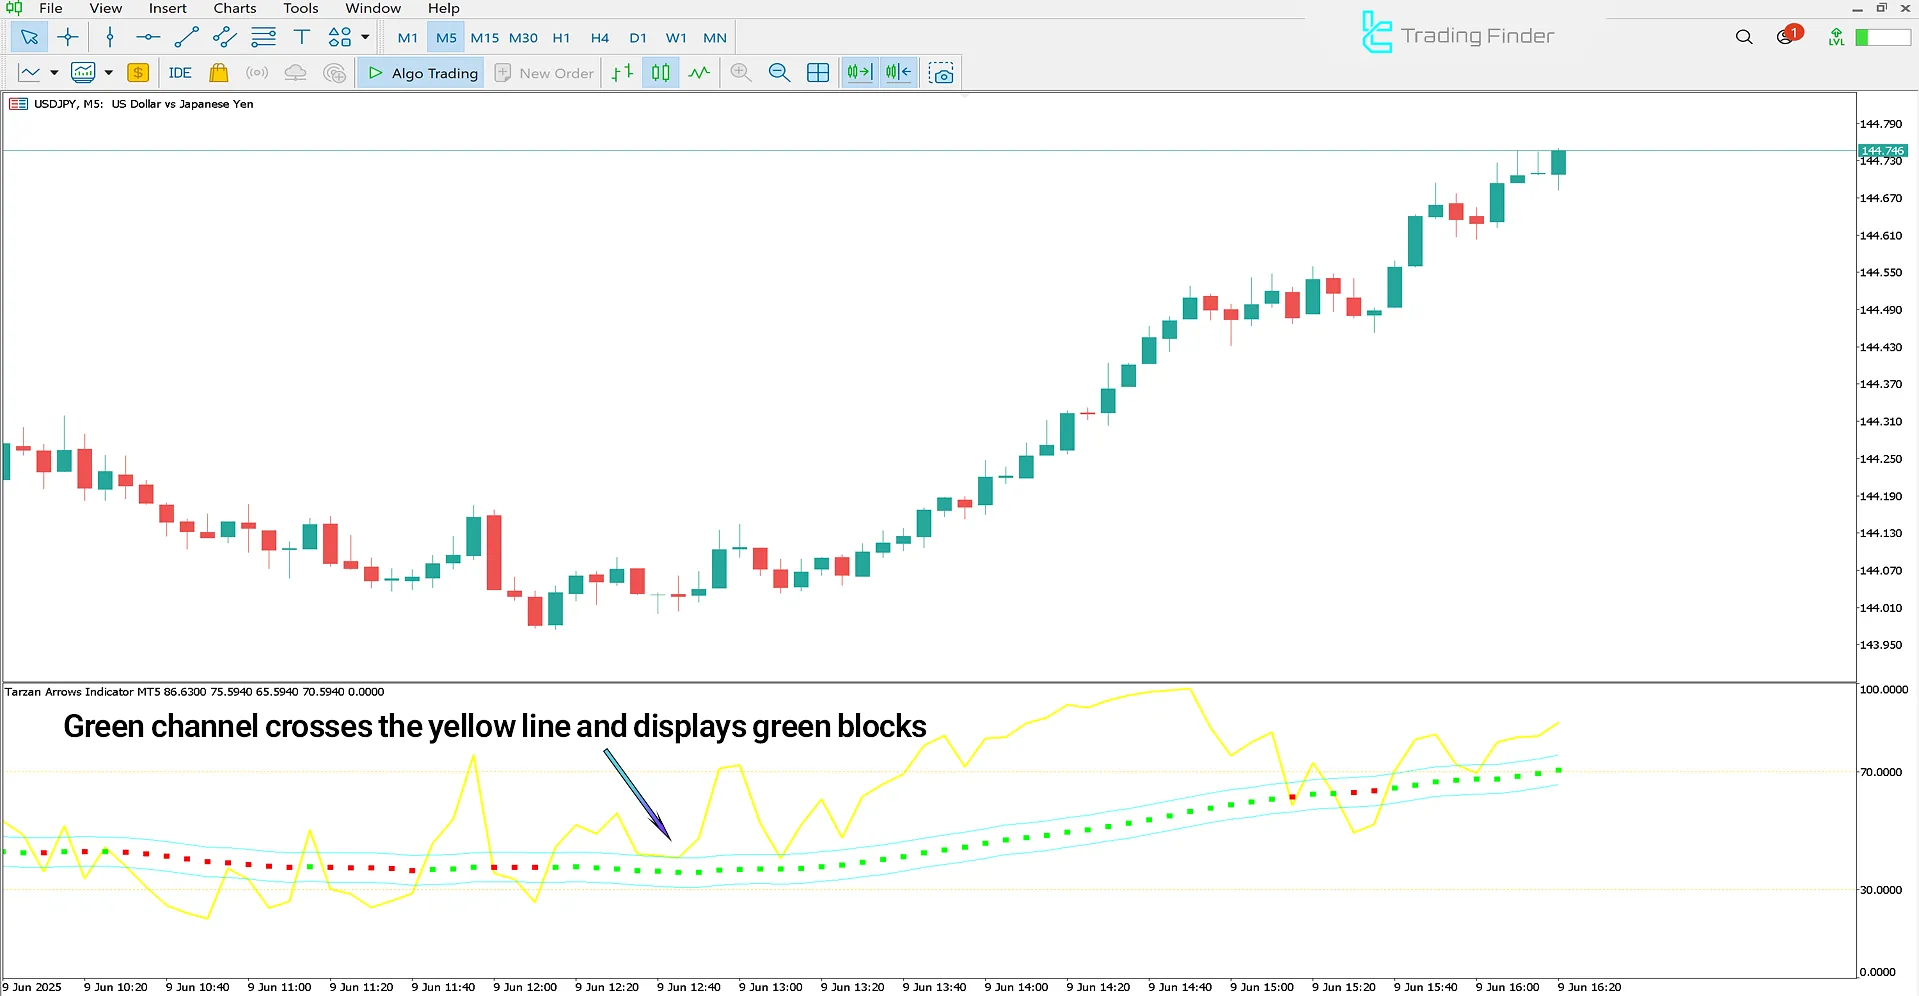
On the 5-minute chart of the USD/JPY currency pair, the RSI line drops below the lower band and then re-enters the channel in an upward move.
In this case, the channel turns green, indicating a rise in bullish momentum in the market.

Indicator in a Bearish Trend
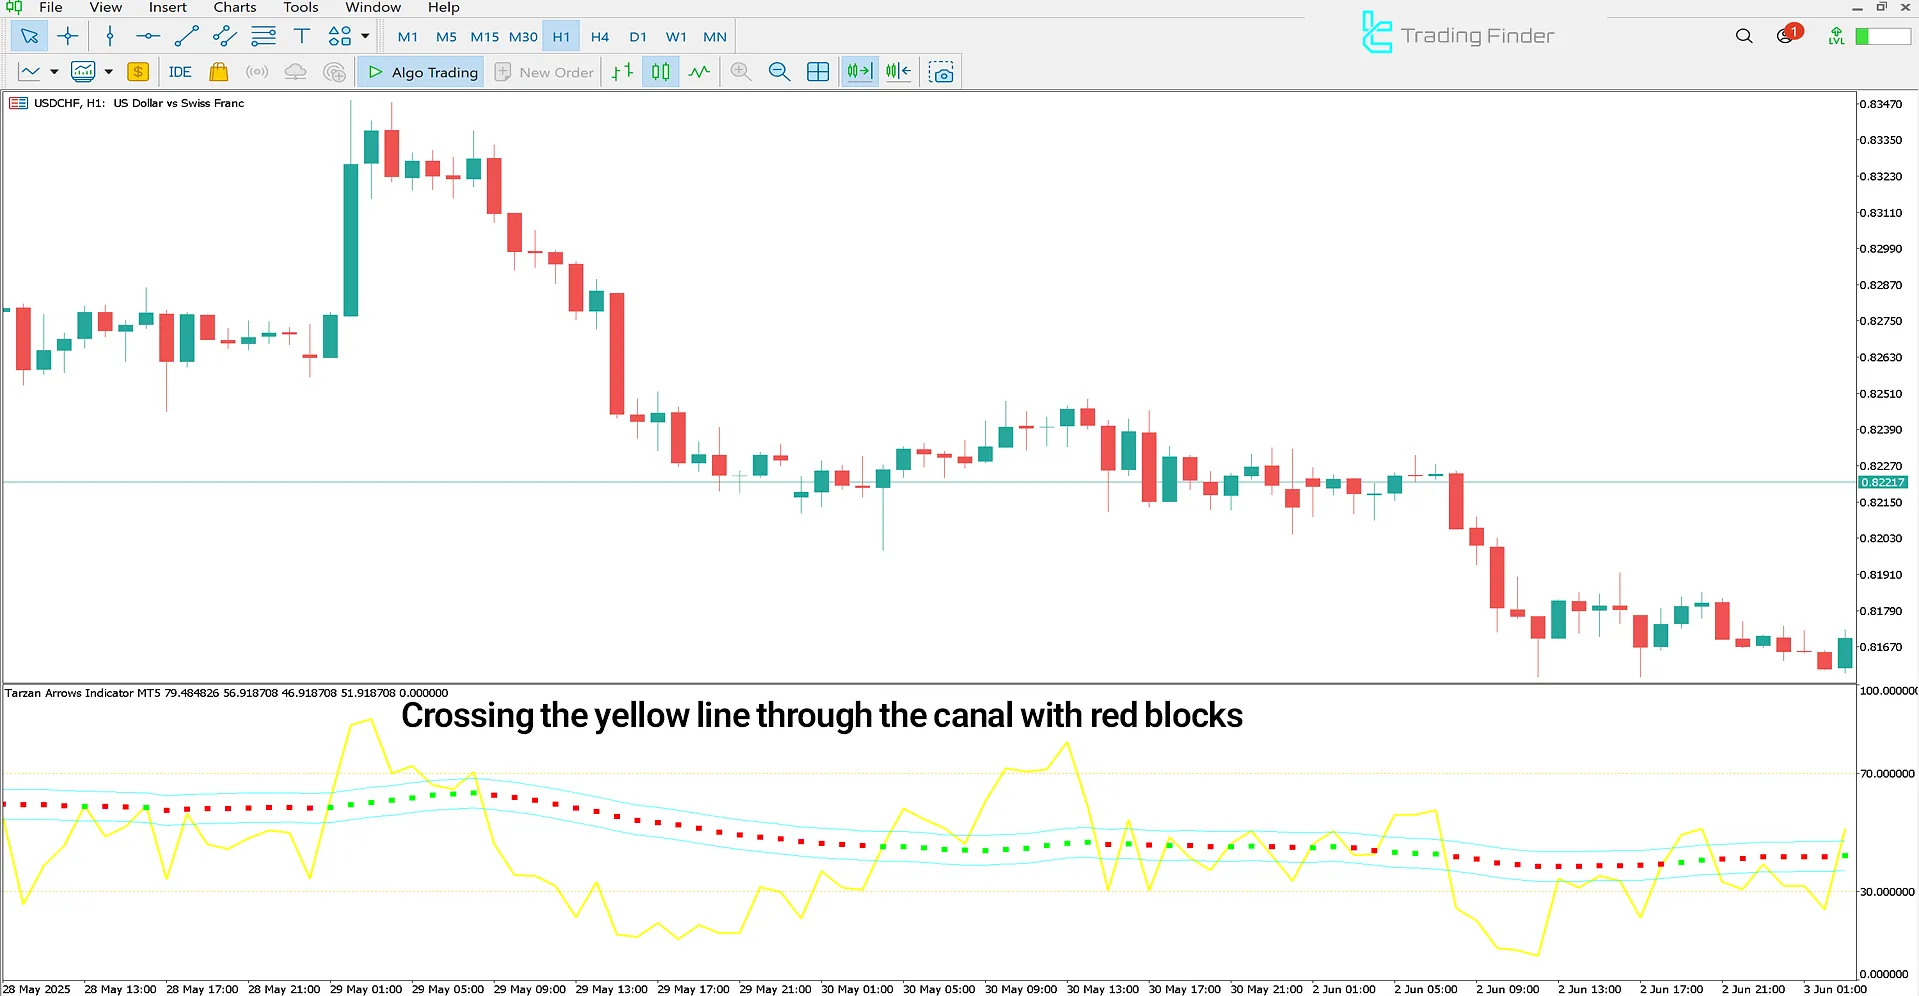
The price chart below shows the USD/CHF currency pair on the 1-hour timeframe.
If the RSI line is above the upper band and then re-enters the channel downward, this move is considered a sign of declining buying pressure, potentially signaling the start of a price correction or even a bearish reversal.

Tarzan Arrows Indicator Settings
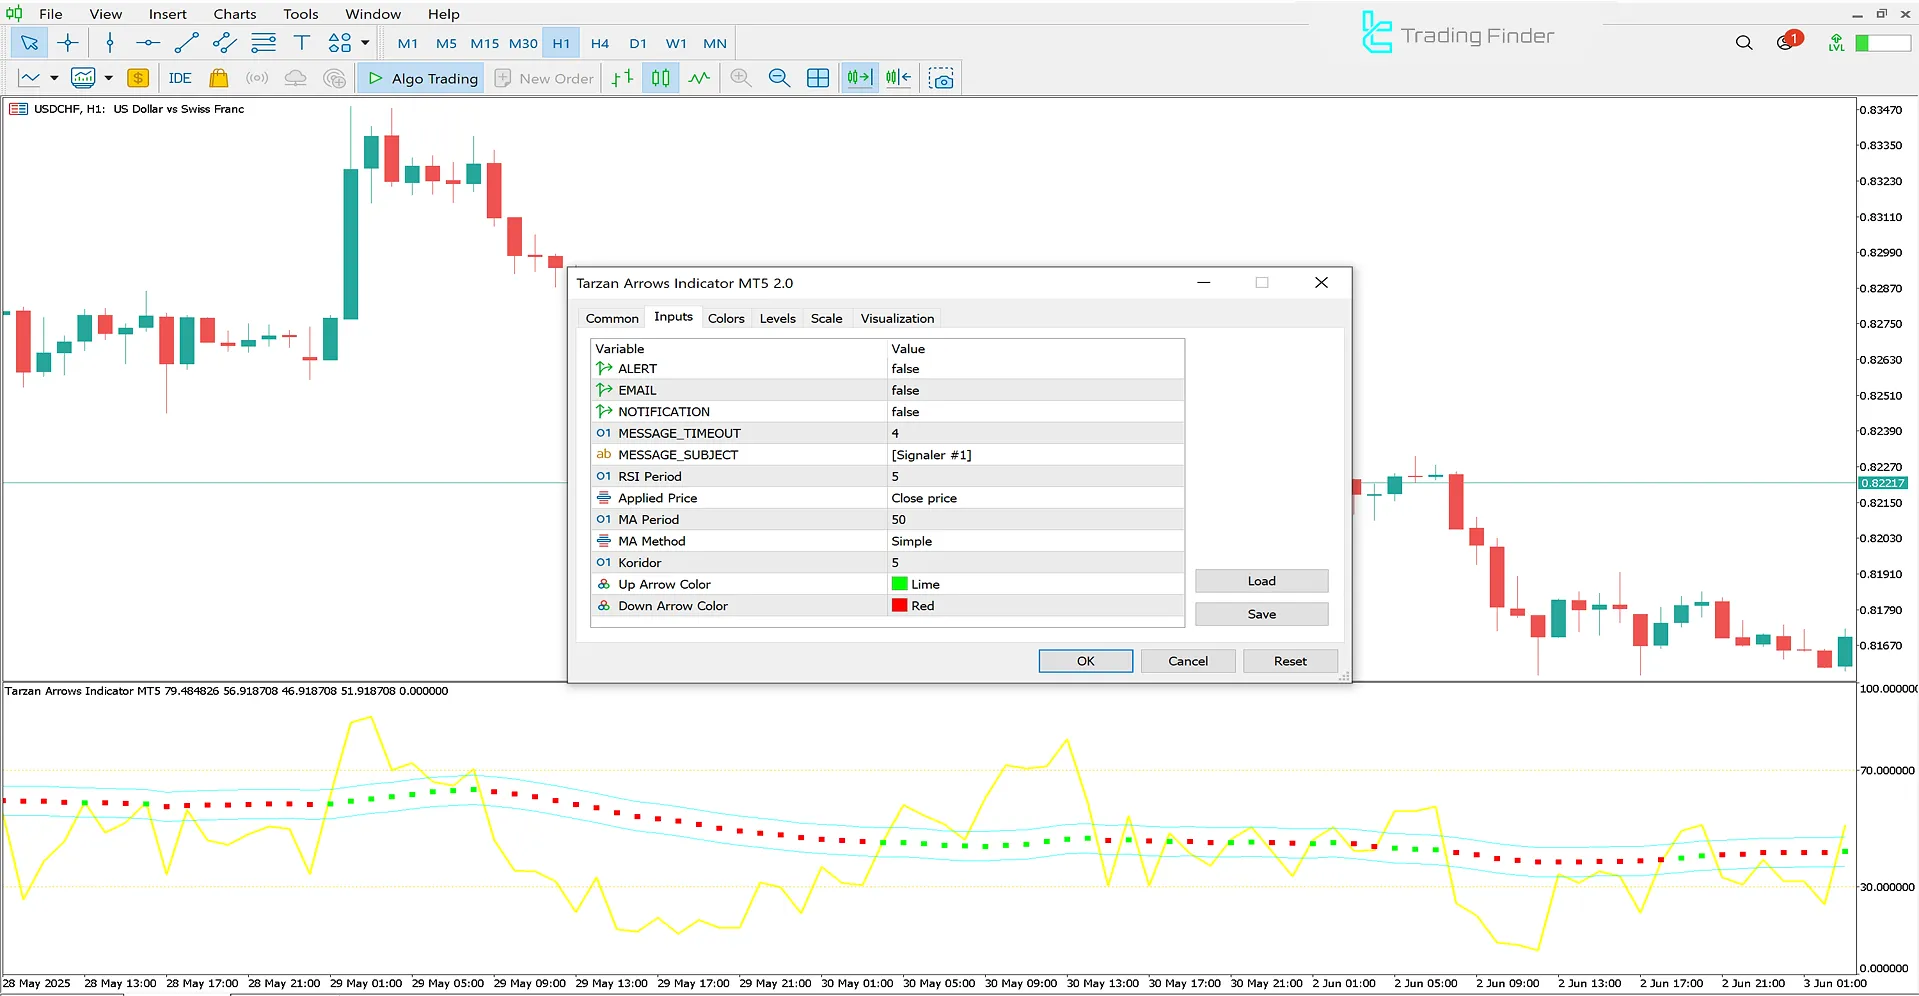
The detailed settings panel of the Tarzan Arrows Indicator is shown in the image below:

- ALERT: Show Alert;
- EMAIL: Send Email;
- NOTIFICATION: App Notification;
- MESSAGE SUBJECT: Alert Message Title;
- RSI Period: Show RSI Period;
- Applied Price: Closing Price;
- MA Period: Moving Average Period;
- MA Method: Moving Average Type;
- Koridor: Channel Width;
- Up Arrow Color: Bullish Arrow Color;
- Down Arrow Color: Bearish Arrow Color.
Conclusion
The Tarzan Arrows Indicator uses a combination of the Relative Strength Index (RSI) and Moving Averages to analyze trend strength and identify potential price reversal points.
Through channel color changes and colored block displays, this Binary indicator provides signals for momentum entry or exit in the market's movement structure.
Tarzan Arrows MT5 PDF
Tarzan Arrows MT5 PDF
Click to download Tarzan Arrows MT5 PDFIs the Tarzan Arrows Indicator usable in all financial markets?
Yes; this trading tool can be used across all financial markets including Forex, crypto, commodities, and stocks.
Can the Tarzan Arrows Indicator be customized for trading strategies?
Yes; by adjusting the settings, the indicator can be tailored to fit specific trading strategies.


