![Tick Chart Indicator for MetaTrader 5 Download - Free - [TradingFinder]](https://cdn.tradingfinder.com/image/184813/4-31-en-tick-on-chart-mt5-1.webp)
![Tick Chart Indicator for MetaTrader 5 Download - Free - [TradingFinder] 0](https://cdn.tradingfinder.com/image/184813/4-31-en-tick-on-chart-mt5-1.webp)
![Tick Chart Indicator for MetaTrader 5 Download - Free - [TradingFinder] 1](https://cdn.tradingfinder.com/image/184781/4-31-en-tick-on-chart-mt5-2.webp)
![Tick Chart Indicator for MetaTrader 5 Download - Free - [TradingFinder] 2](https://cdn.tradingfinder.com/image/184780/4-31-en-tick-on-chart-mt5-3.webp)
![Tick Chart Indicator for MetaTrader 5 Download - Free - [TradingFinder] 3](https://cdn.tradingfinder.com/image/184782/4-31-en-tick-on-chart-mt5-4.webp)
The Tick Chart Indicator, one of the MetaTrader 5 indicators, facilitates the quick identification of short-term market fluctuations by displaying real-time price changes.
In markets with rapid price movements, having a tool capable of showing the smallest price movements plays a key role in trading.
Tick Chart Indicator Specifications
The information associated with this indicator is summarized in this table:
Indicator Categories: | Oscillators MT5 Indicators Volatility MT5 Indicators Trading Assist MT5 Indicators |
Platforms: | MetaTrader 5 Indicators |
Trading Skills: | Intermediate |
Indicator Types: | Leading MT5 Indicators |
Timeframe: | Multi-Timeframe MT5 Indicators |
Trading Style: | Intraday MT5 Indicators |
Trading Instruments: | Forex MT5 Indicators Crypto MT5 Indicators Stock MT5 Indicators Share Stock MT5 Indicators |
Indicator Overview
The Tick Volume Oscillator (Tick Volume Oscillator) is one of the most effective tools among MetaTrader 5 oscillators.
This indicator displays volume fluctuations using different averaging methods such as SMA, EMA, and SMMA.
Traders can customize the indicator settings based on their strategy, adjusting the moving average type and selecting histogram mode for better visualization.
Indicator in an Uptrend
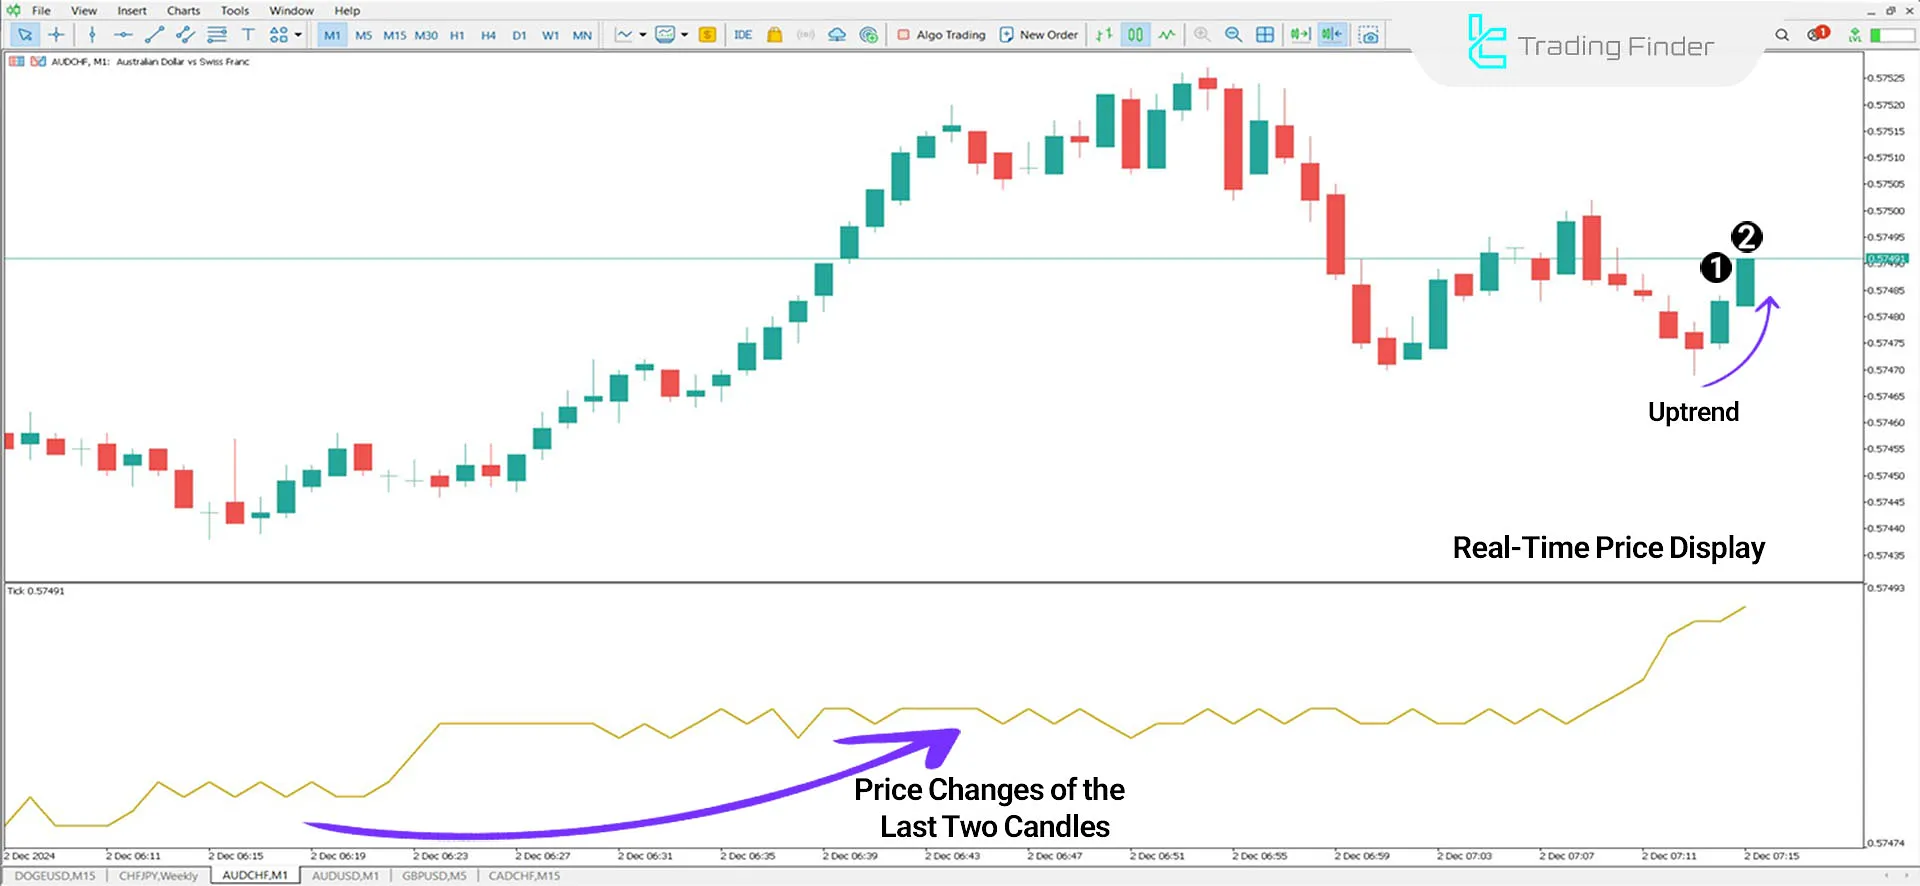
In the 1-minute timeframe of the AUD/CHF currency pair, the indicator displays real-time price changes and allows precise tracking of price movements.
By observing the continuous growth of candles and intense price fluctuations, the indicator identifies an uptrend, enabling traders to enter long positions after receiving necessary confirmations.

Indicator in a Downtrend
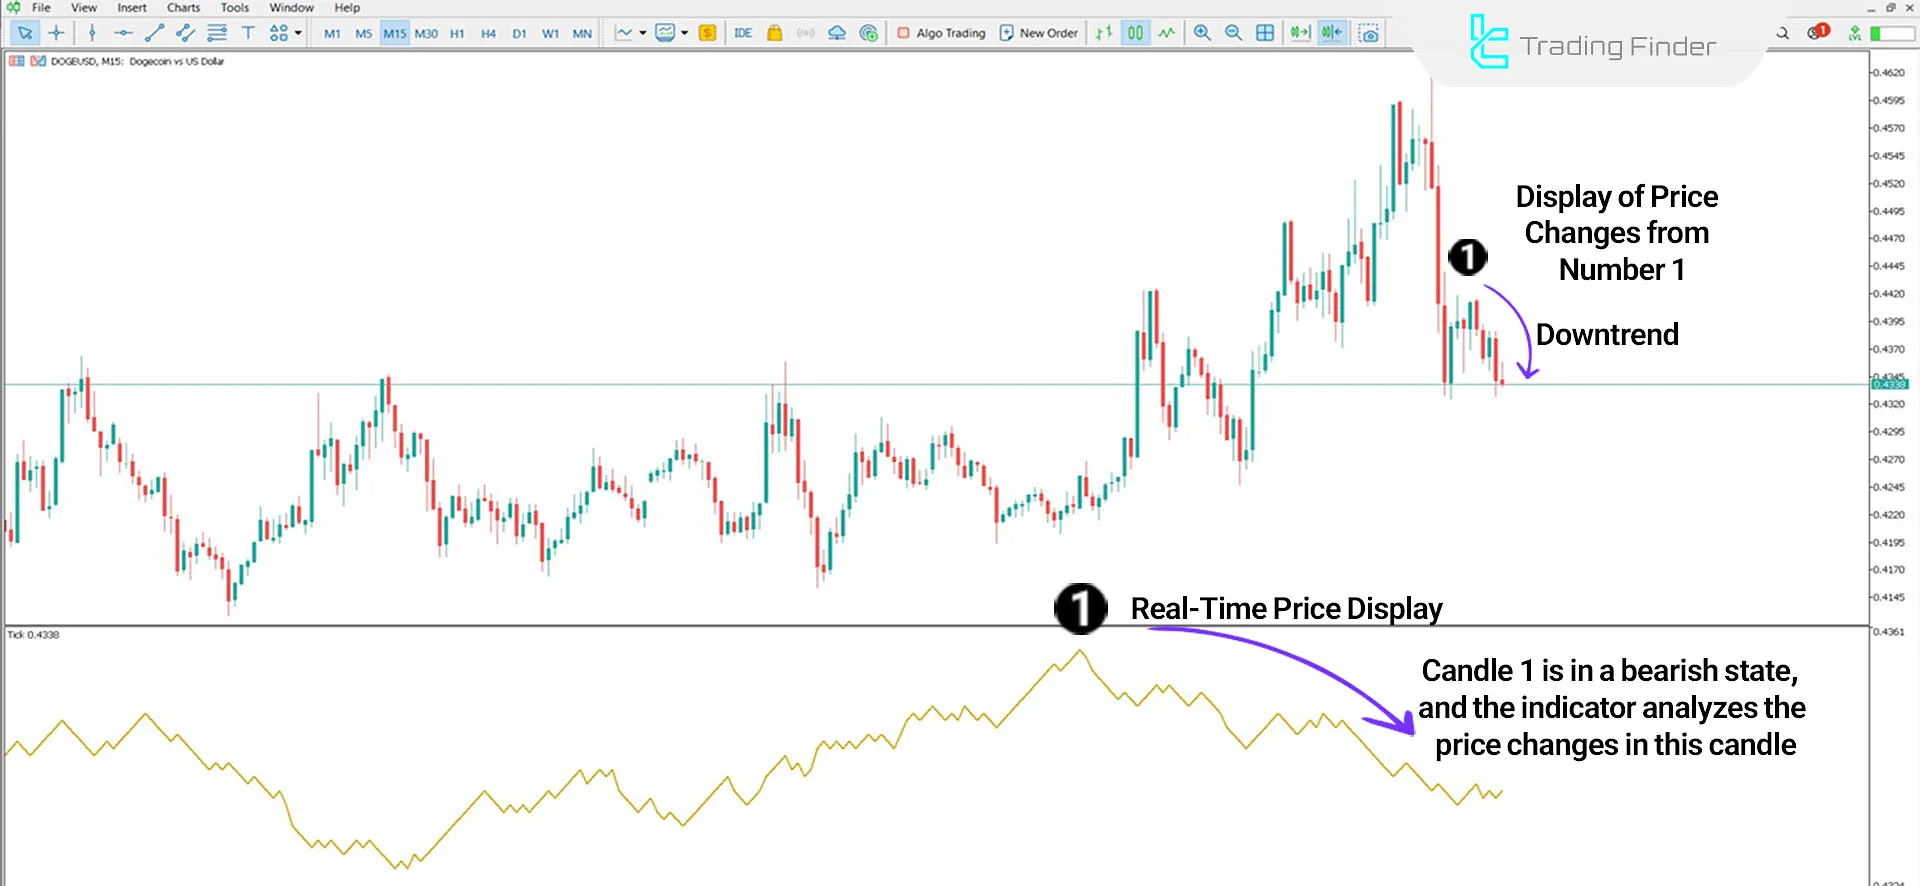
In the price chart of Dogecoin (DOGE), the indicator displays real-time price changes, depicting the market's downtrend.
Using this indicator, traders can analyze the consistent decline of candles and price fluctuations to better understand the price movement direction and use it as a confirmation signal for short trades.

Tick Chart Indicator Settings
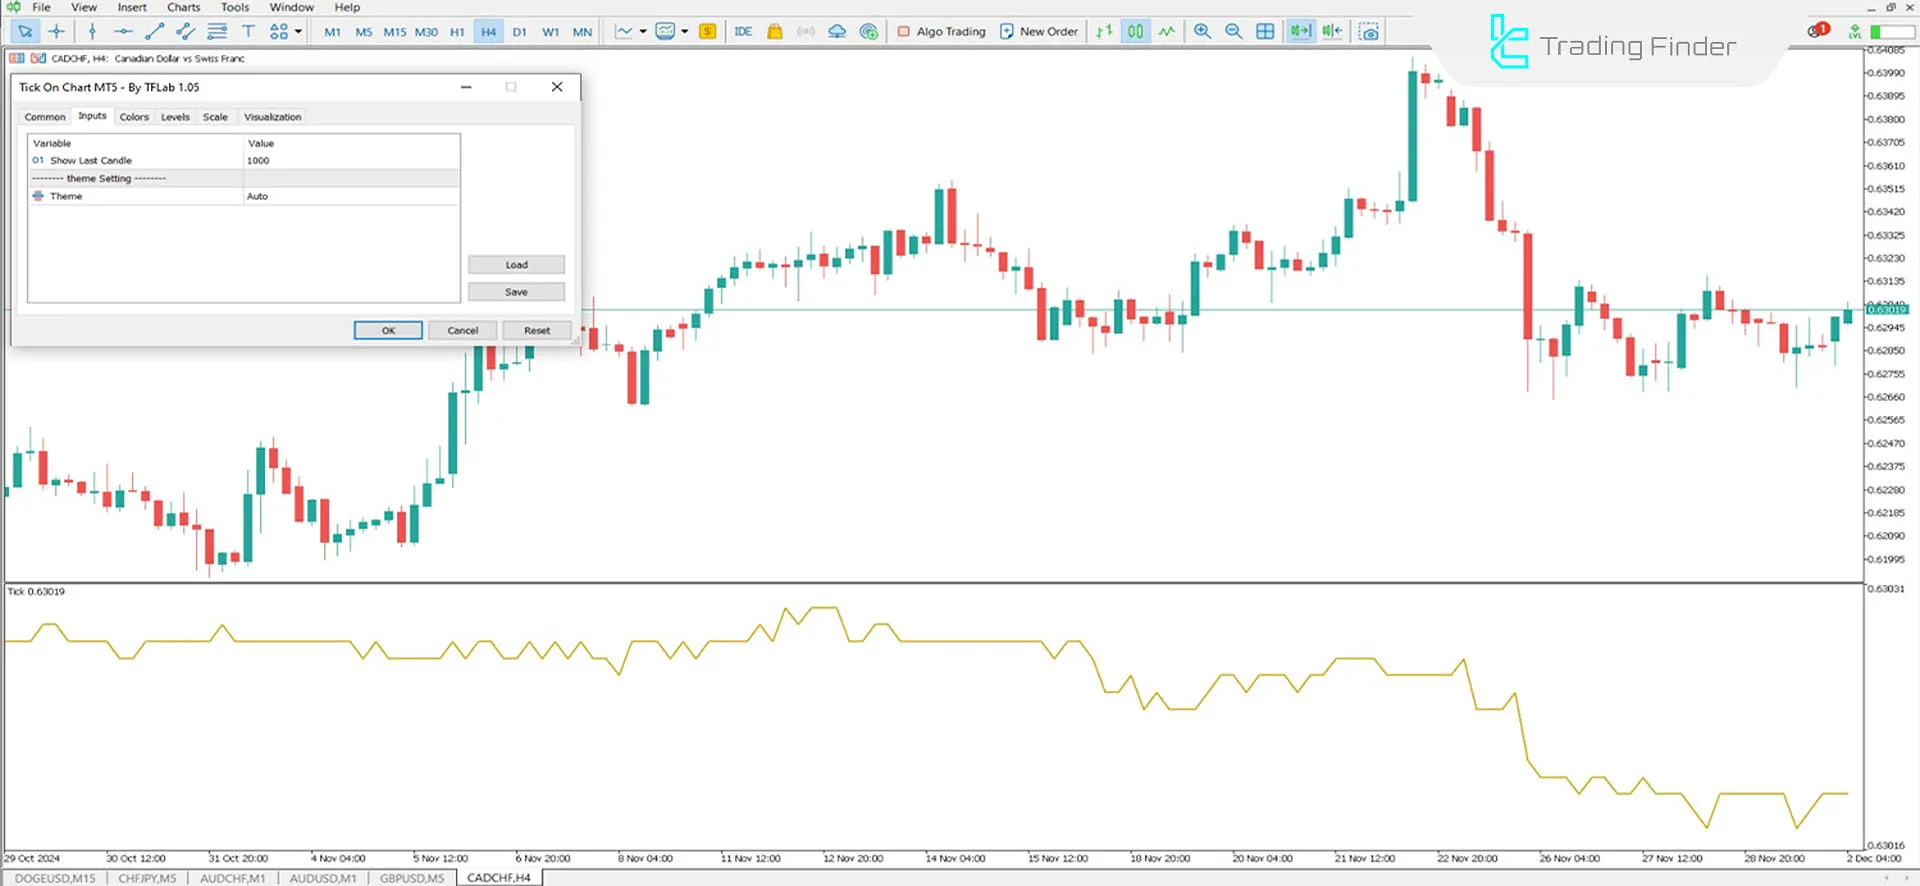
The image below shows the complete settings of this indicator:

- Bars: Calculates the number of candles to display in the oscillator (default: 1000);
- Theme: Sets the chart's background color.
Conclusion
The Tick Chart Indicator in MetaTrader 5 oscillators records real-time price changes, making it ideal for identifying short-term market fluctuations.
The yellow line in this indicator reflects price changes in both upward and downward directions, helping traders determine the optimal entry (Entry) and exit (Exit) points after receiving the necessary confirmations.
Tick Chart MT5 PDF
Tick Chart MT5 PDF
Click to download Tick Chart MT5 PDFHow does the Tick Chart Indicator identify trends?
This indicator shows real-time price changes, identifying both uptrends and downtrends.
Which markets are suitable for the Tick Chart Indicator?
This indicator is useful in volatile markets such as cryptocurrencies, forex, and stocks.


