![Time Segmented Volume Indicator for MT5 Download - Free - [TFlab]](https://cdn.tradingfinder.com/image/245260/4-48-en-time-segmented-volume-mt5-1.webp)
![Time Segmented Volume Indicator for MT5 Download - Free - [TFlab] 0](https://cdn.tradingfinder.com/image/245260/4-48-en-time-segmented-volume-mt5-1.webp)
![Time Segmented Volume Indicator for MT5 Download - Free - [TFlab] 1](https://cdn.tradingfinder.com/image/245271/4-48-en-time-segmented-volume-mt5-2.webp)
![Time Segmented Volume Indicator for MT5 Download - Free - [TFlab] 2](https://cdn.tradingfinder.com/image/245275/4-48-en-time-segmented-volume-mt5-3.webp)
![Time Segmented Volume Indicator for MT5 Download - Free - [TFlab] 3](https://cdn.tradingfinder.com/image/245278/4-48-en-time-segmented-volume-mt5-4.webp)
On July 22, 2025, in version 2, alert/notification and signal functionality was added to this indicator
The Time Segmented Volume (TSV) Indicator is one of the MetaTrader 5 indicators, serving as an efficient tool for analyzing liquidity flow entering and exiting an asset across various timeframes.
This indicator is displayed as an oscillator in a separate window, oscillating continuously around the zero line.
- Positive Movement: When the columns of this oscillator move above the zero line, it indicates increased demand and the start of an uptrend in the market.
- Negative Movement: Conversely, when the indicator bars cross downward from above the zero line, it can signal increased selling pressure and the onset of a downtrend.
Indicator Specifications
The following table summarizes the key specifications of the indicator.
Indicator Categories: | Oscillators MT5 Indicators Volatility MT5 Indicators Trading Assist MT5 Indicators |
Platforms: | MetaTrader 5 Indicators |
Trading Skills: | Intermediate |
Indicator Types: | Reversal MT5 Indicators |
Timeframe: | Multi-Timeframe MT5 Indicators |
Trading Style: | Intraday MT5 Indicators |
Trading Instruments: | Forex MT5 Indicators Crypto MT5 Indicators Stock MT5 Indicators |
Overview of the Indicator
The Time Segmented Volume (TSV) Indicator provides a variety of signals for trend analysis that can be utilized to improve trading decisions. These signals include:
- Identifying Overbought and Oversold Levels: Appears when the price moves excessively in one direction, suggesting a possible correction or trend reversal.
- Divergence Between Price and Indicator: Occurs when the price and indicator movements are in opposite directions, indicating a potential trend change.
Crossover of Oscillator Moving Averages: When the blue line (slow moving average) crosses the orange line (fast moving average), it signals the start or end of a new trend.
TSV in an Uptrend
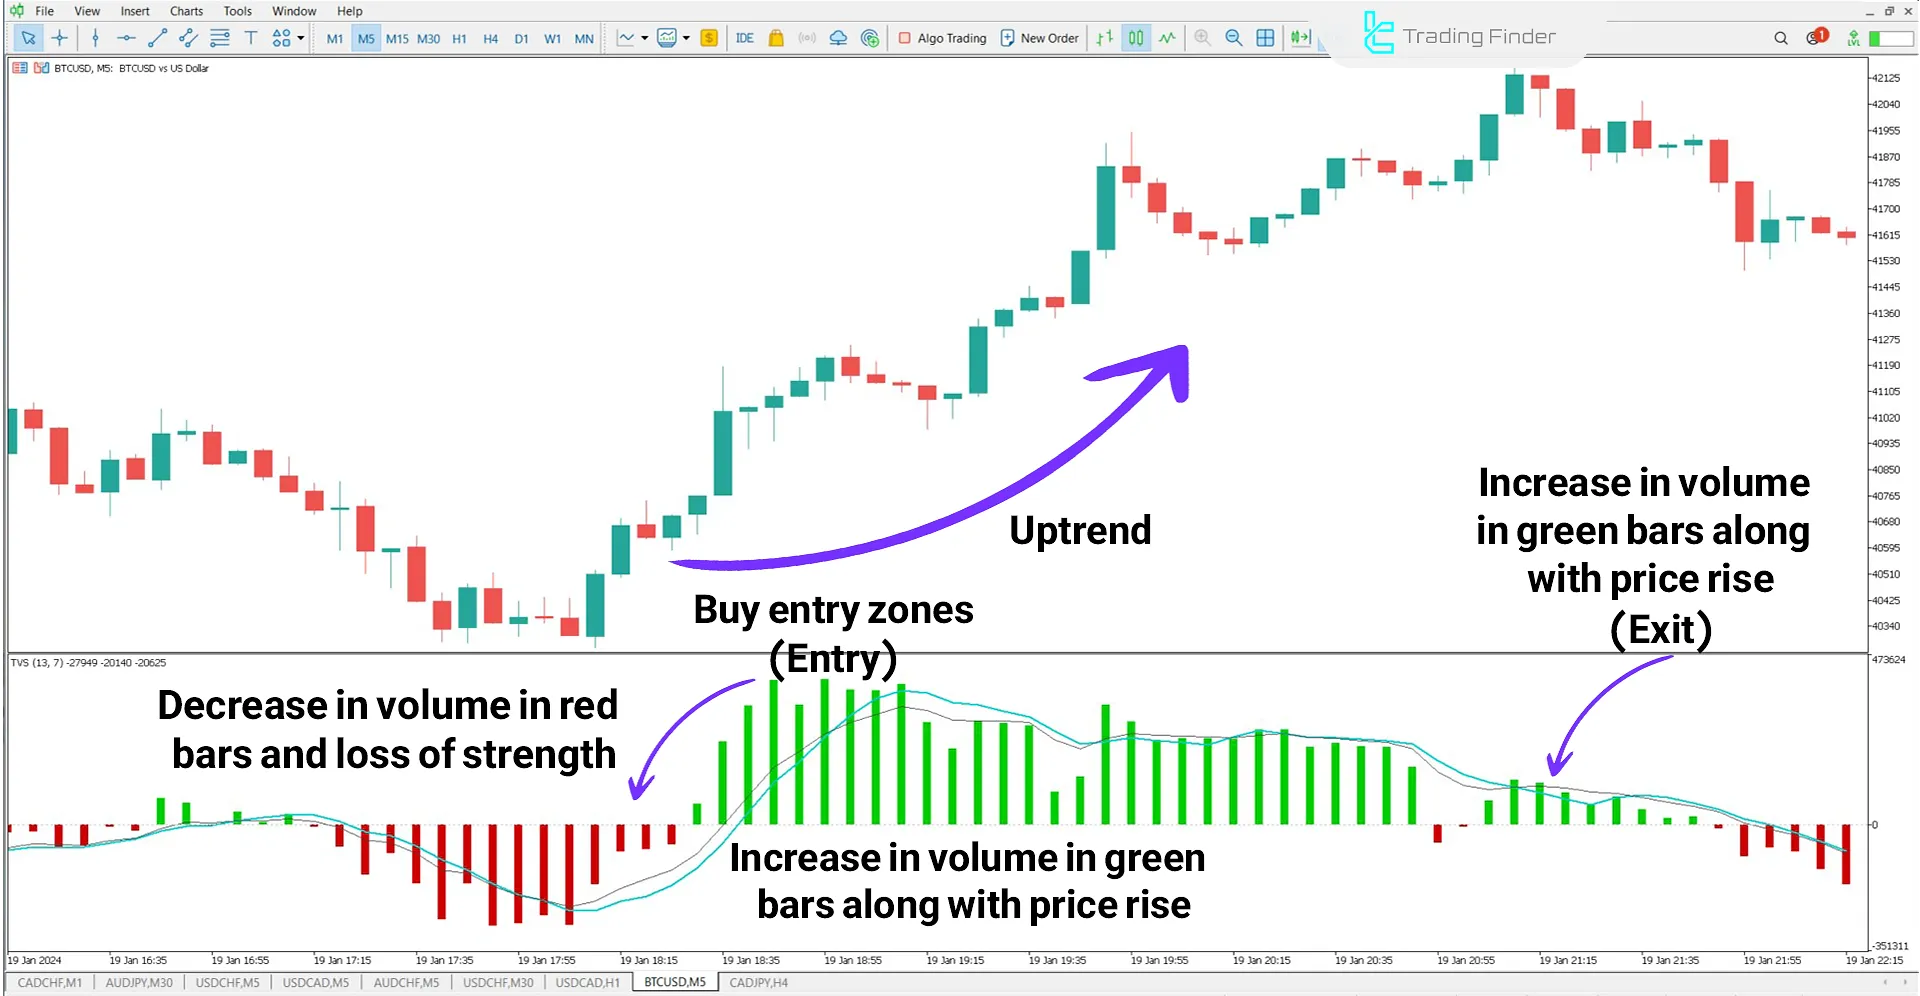
In the Bitcoin (BTC) chart, as the red histogram bars weaken and the green bars strengthen, signs of an uptrend emerge.
Traders can confirm this by observing bullish crossovers, such as the blue line (slow MA) crossing above the orange line (fast MA), and then proceed with a buy trade.

TSV in a Downtrend
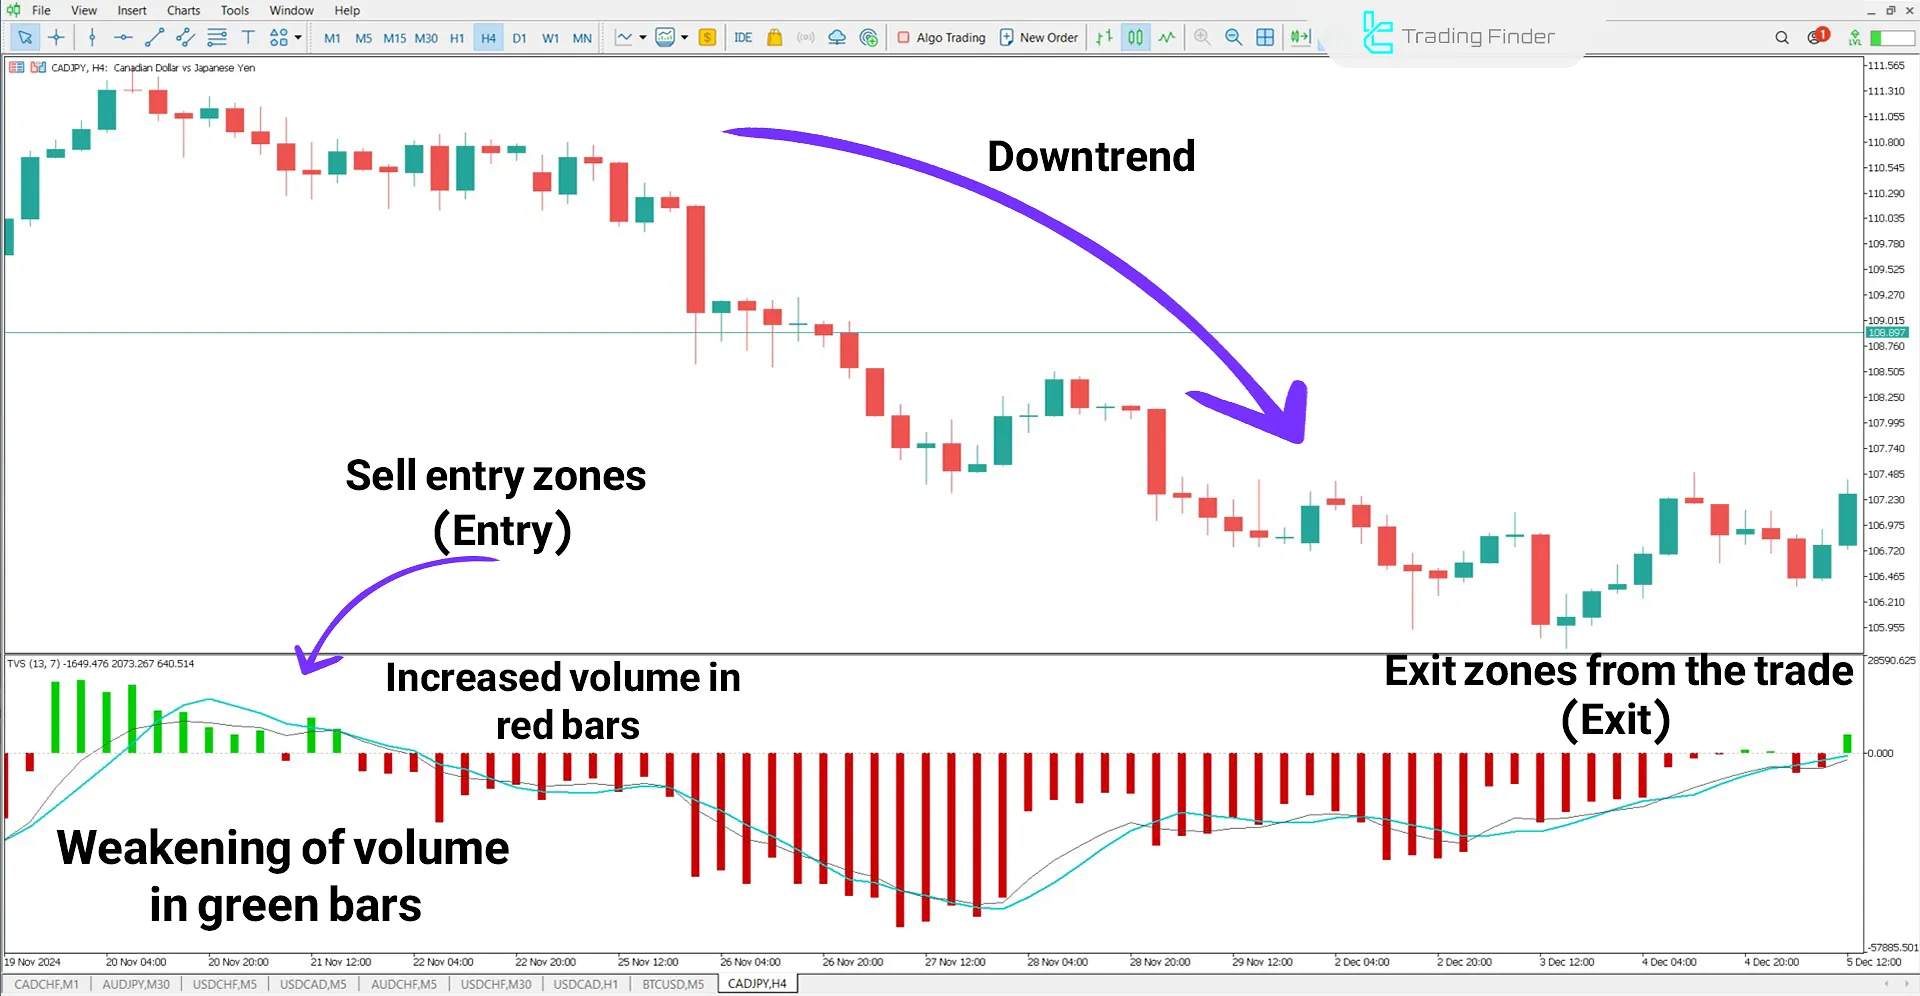
In the Canadian Dollar to Japanese Yen (CAD/JPY) downtrend, weakening of the green bars indicates decreased bullish volume, while strengthening of the red histogram bars reflects increased selling pressure, continuing the market downtrend.
Traders can exit their trades in these zones upon noticing weakened selling volume (reducing red bars) to avoid the risk of a trend reversal.

Indicator Settings
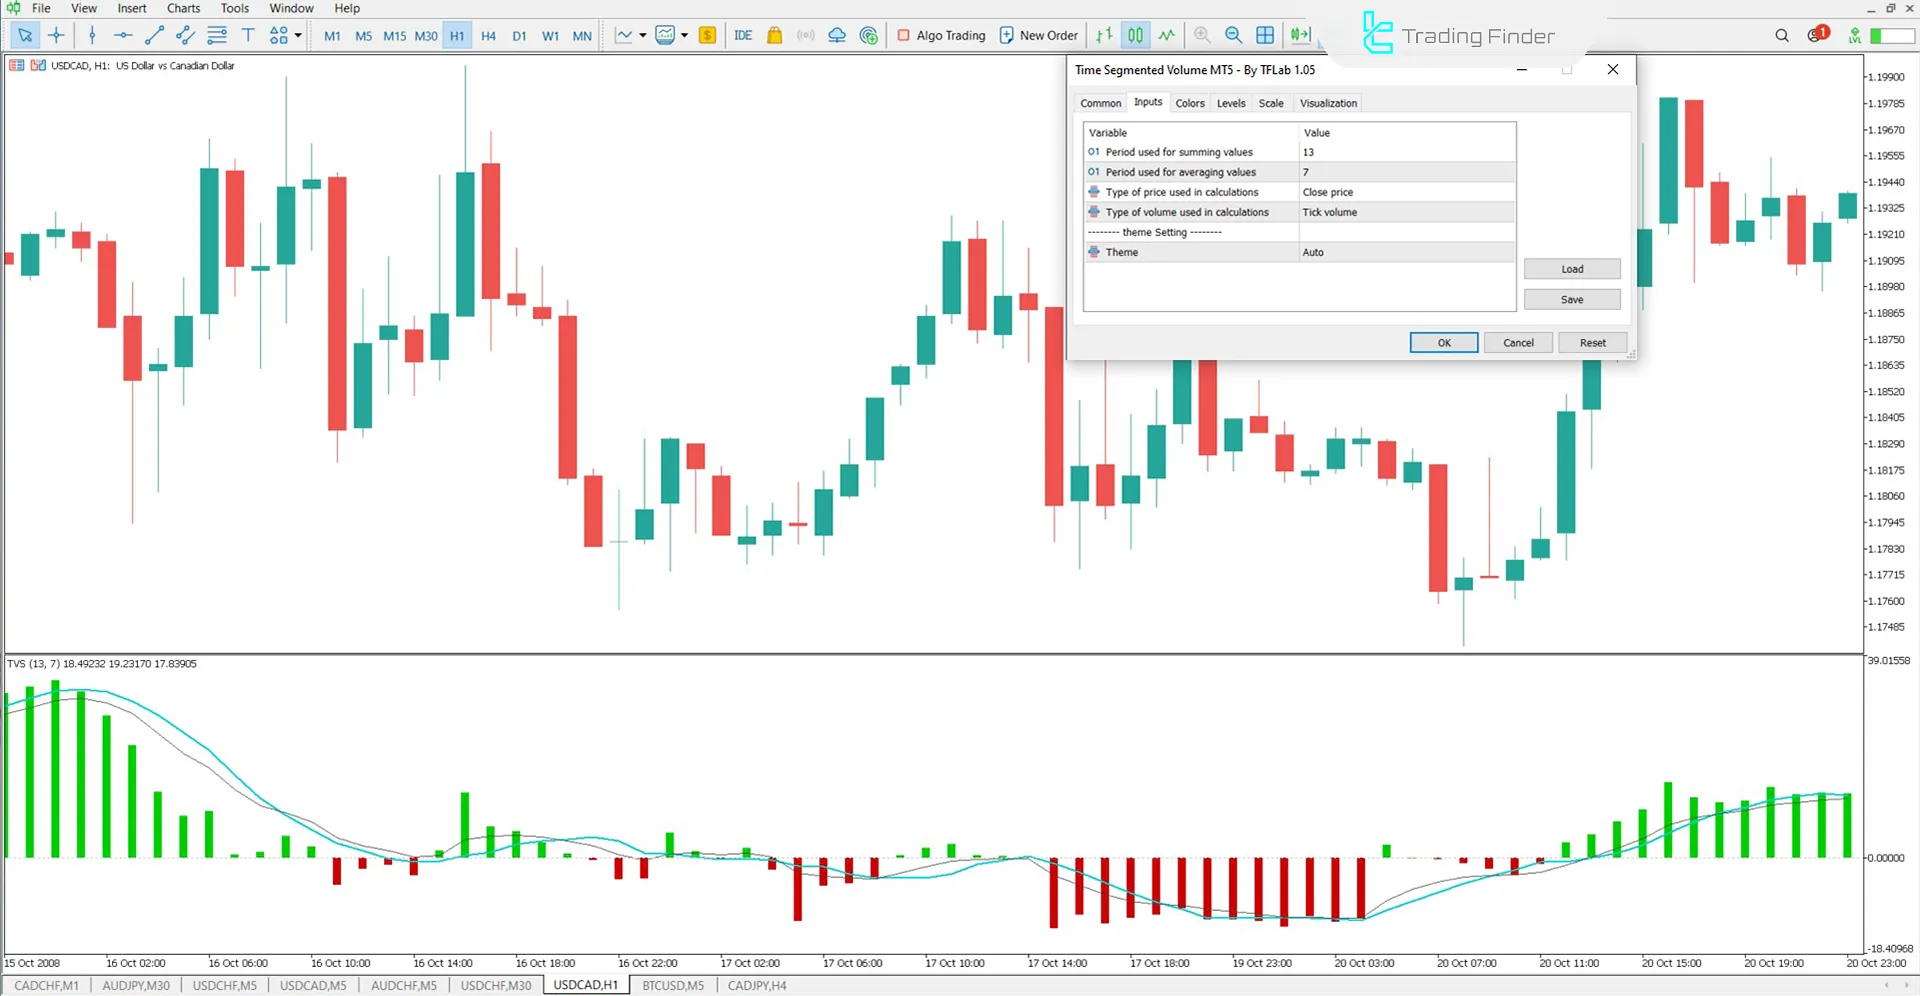
The following image displays the complete settings of the indicator:

- Period Used for Summing Values: Number of bars used to calculate the volume
- Period Used for Averaging Values: Number of periods used for moving average calculations
- Type of Price Used in Calculations: The type of price used in computations
- Type of Volume Used in Calculations: The type of volume considered in computations
Conclusion
The Time Segmented Volume (TSV) Indicator is utilized by traders to identify liquidity flow, entry, and exit points more accurately.
This indicator proves especially effective in volatile and liquid markets, and traders can utilize other indicators from the Trading Assist Indicators for MT5 alongside it to generate better signals.
Time Segmented Volume MT5 PDF
Time Segmented Volume MT5 PDF
Click to download Time Segmented Volume MT5 PDFCan the TSV Indicator be used across all markets?
Yes, the TSV Indicator is applicable in various markets, such as Forex, stocks, and cryptocurrencies, and performs exceptionally well in volatile and liquid markets.
Is the TSV Indicator effective for identifying divergence?
Yes, the TSV Indicator is an excellent tool for identifying divergence between price and the indicator.


