![TMA + Center of Gravity indicator for MT5 Download – [TradingFinder]](https://cdn.tradingfinder.com/image/230974/11-56-en-tma-cg-mt5-1.webp)
![TMA + Center of Gravity indicator for MT5 Download – [TradingFinder] 0](https://cdn.tradingfinder.com/image/230974/11-56-en-tma-cg-mt5-1.webp)
![TMA + Center of Gravity indicator for MT5 Download – [TradingFinder] 1](https://cdn.tradingfinder.com/image/230975/11-56-en-tma-cg-mt5-2.webp)
![TMA + Center of Gravity indicator for MT5 Download – [TradingFinder] 2](https://cdn.tradingfinder.com/image/230976/11-56-en-tma-cg-mt5-3.webp)
![TMA + Center of Gravity indicator for MT5 Download – [TradingFinder] 3](https://cdn.tradingfinder.com/image/230977/11-56-en-tma-cg-mt5-4.webp)
The Triangular Moving Average + Center of Gravity indicator is a trend channel tool in MetaTrader 5. It utilizes a combination of the TMA and COG indicators to detect price trends.
The MT5 signal forecast indicator issues buy or sell signals when the price breaks the channel bands and then returns to the channel range.
TMA + Center Of Gravity Indicator Table
The table below briefly outlines the characteristics of the indicator:.
Indicator Categories: | Signal & Forecast MT5 Indicators Trading Assist MT5 Indicators Bands & Channels MT5 Indicators |
Platforms: | MetaTrader 5 Indicators |
Trading Skills: | Elementary |
Indicator Types: | Leading MT5 Indicators Non-Repaint MT5 Indicators |
Timeframe: | Multi-Timeframe MT5 Indicators |
Trading Style: | Intraday MT5 Indicators Scalper MT5 Indicators Day Trading MT5 Indicators |
Trading Instruments: | Forex MT5 Indicators Stock MT5 Indicators Indices MT5 Indicators |
Indicator at a Glance
The Triangular Moving Average + Center of Gravity indicator displays three lines on the chart. The middle line represents the TMA line, while the other two lines serve as the upper and lower TMA bands, calculated using the standard deviation. The lower band is marked in green, and the upper band is marked in red. When either of the bands is broken and the price returns to the channel, the indicator triggers a buy or sell signal.
Buy Signal Indicator
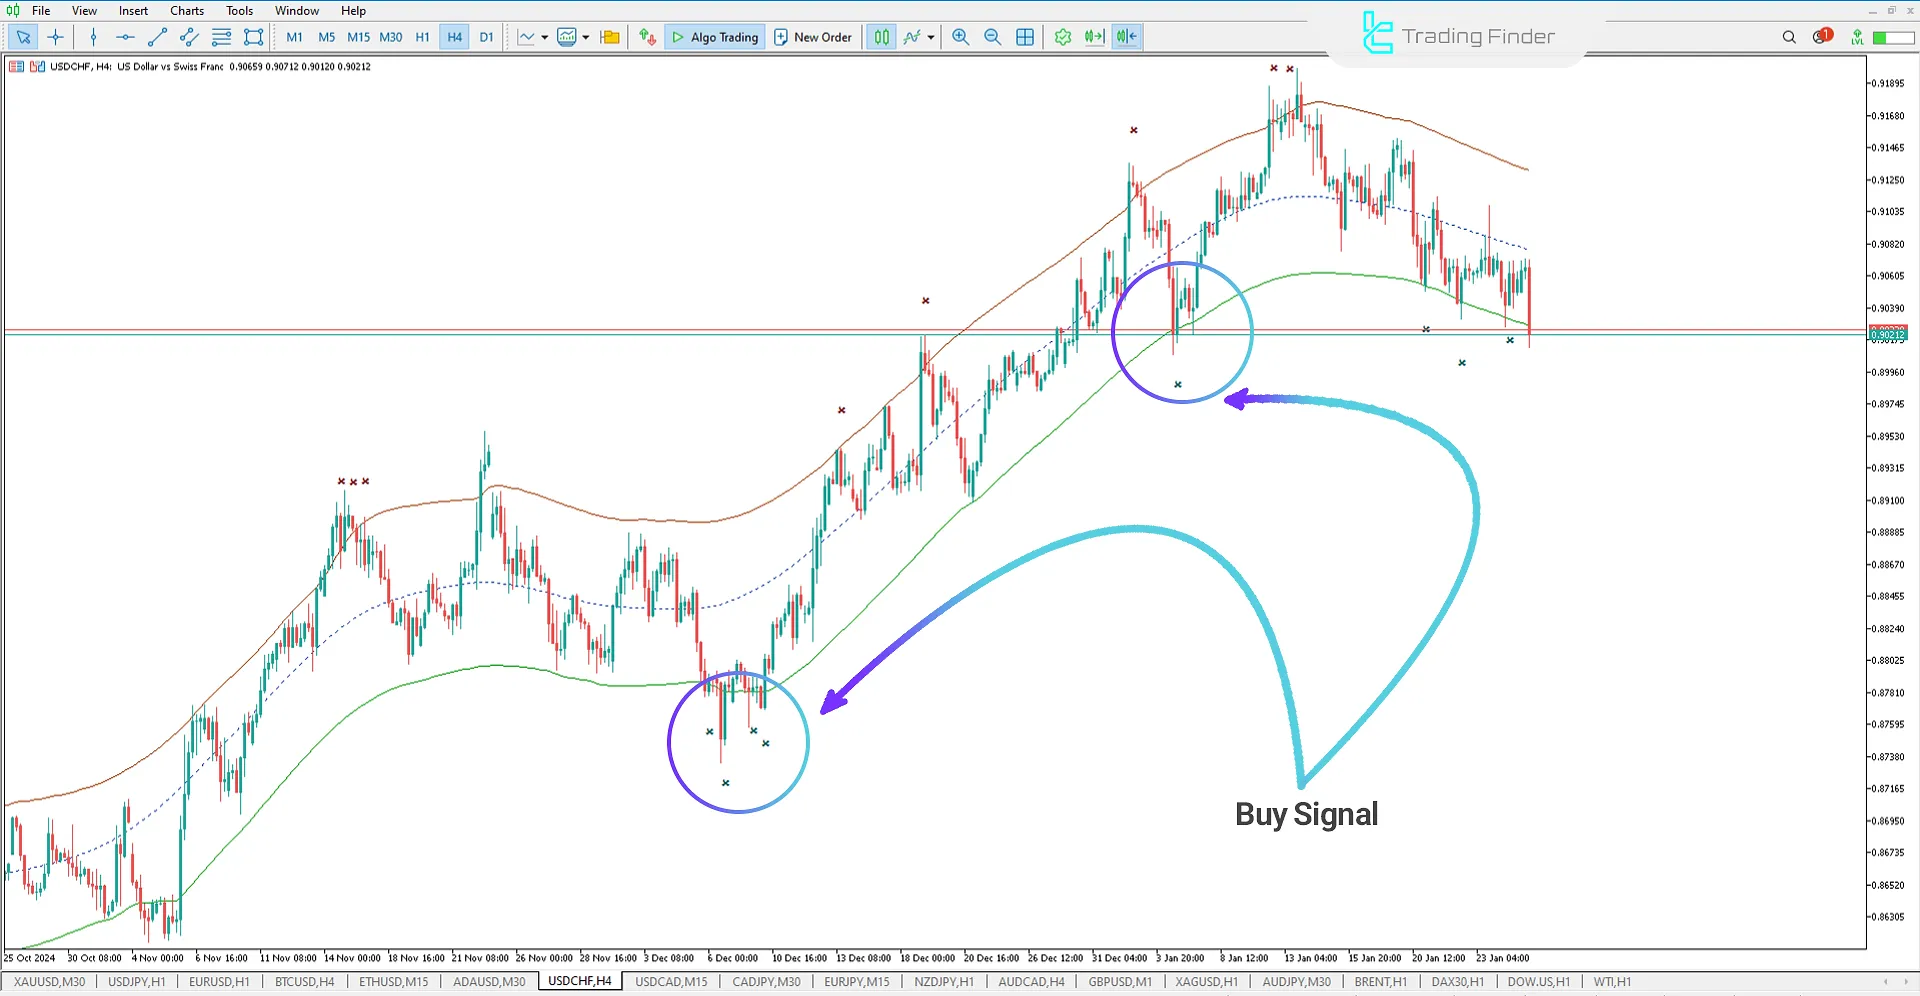
In the 4-hour chart of USD/CHF, the Triangular Moving Average + Center of Gravity indicator displays an upward trend.
The price has broken through the lower channel band twice, and upon returning to the channel, the indicator triggers a buy signal. Traders can enter a buy position based on this signal.

Sell Signal Indicator
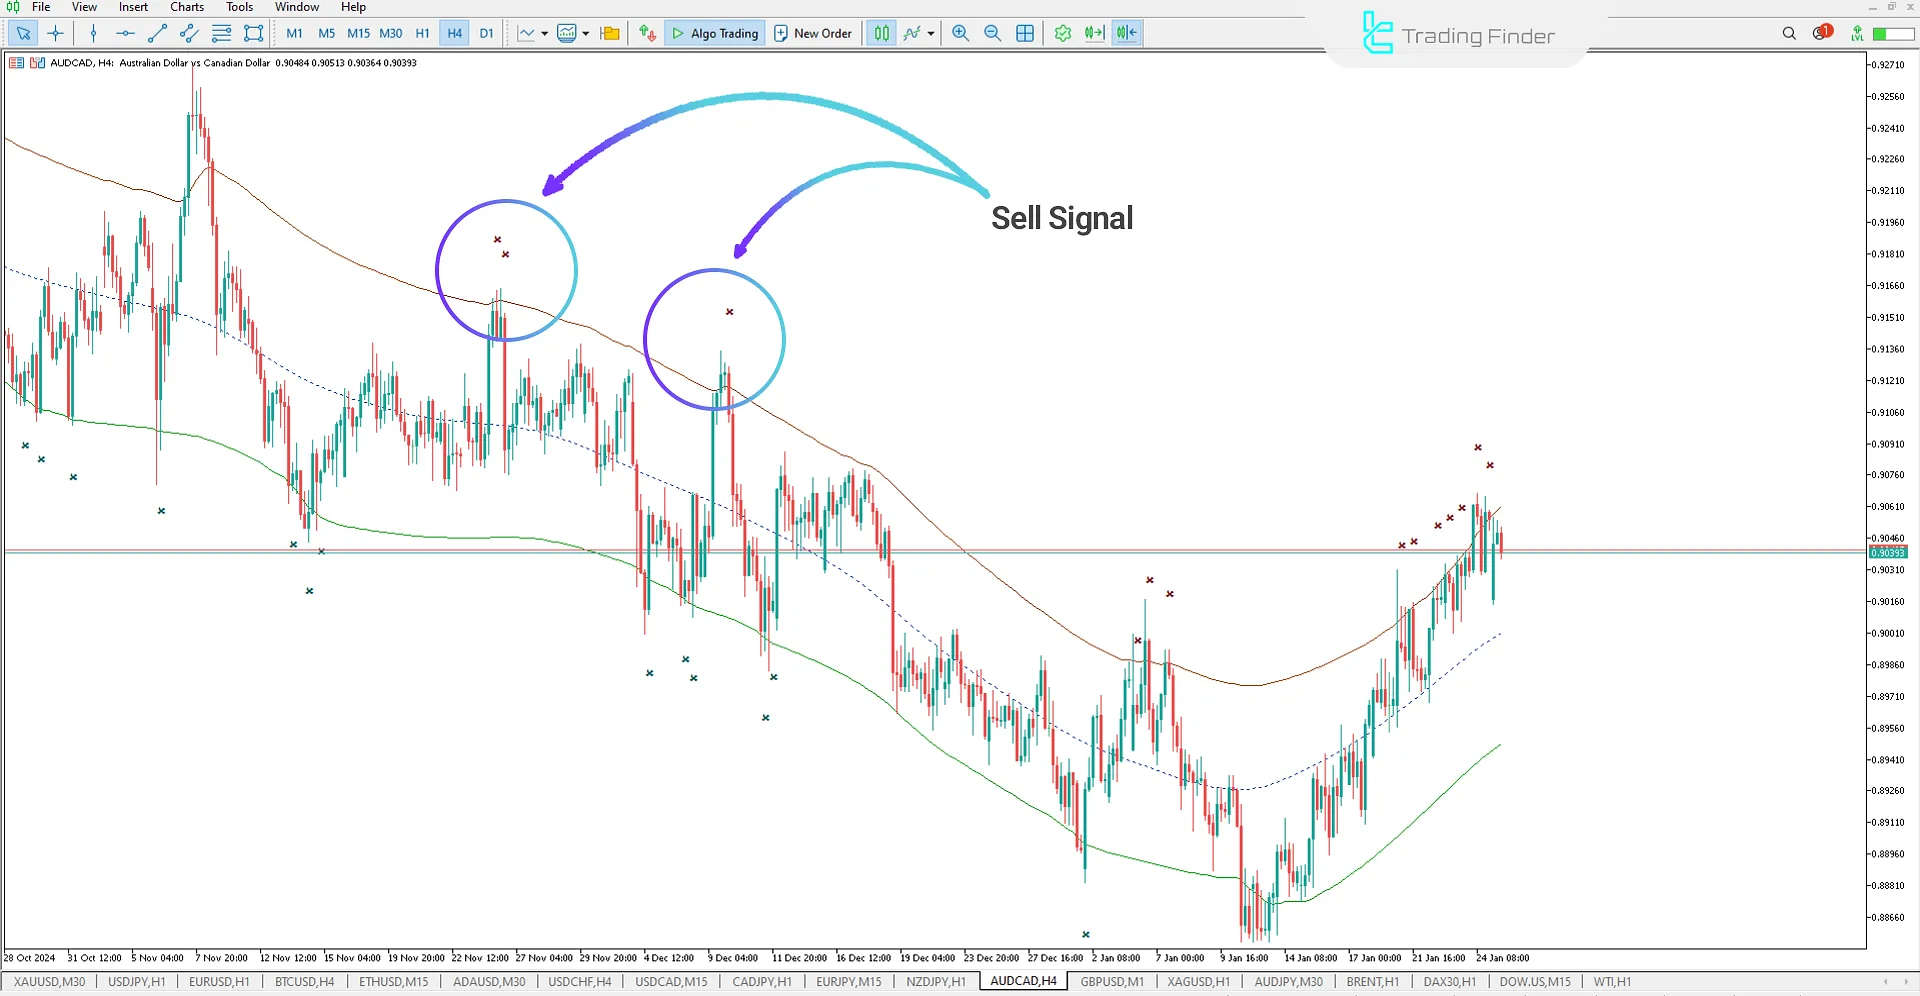
In the 4-hour chart of AUD/CAD, the Triangular Moving Average + Center of Gravity indicator shows a downward trend.
The price breaks the upper band and then returns to the channel, triggering a sell signal. Traders can use this signal to enter a sell position.

TMA + COG Indicator Settings
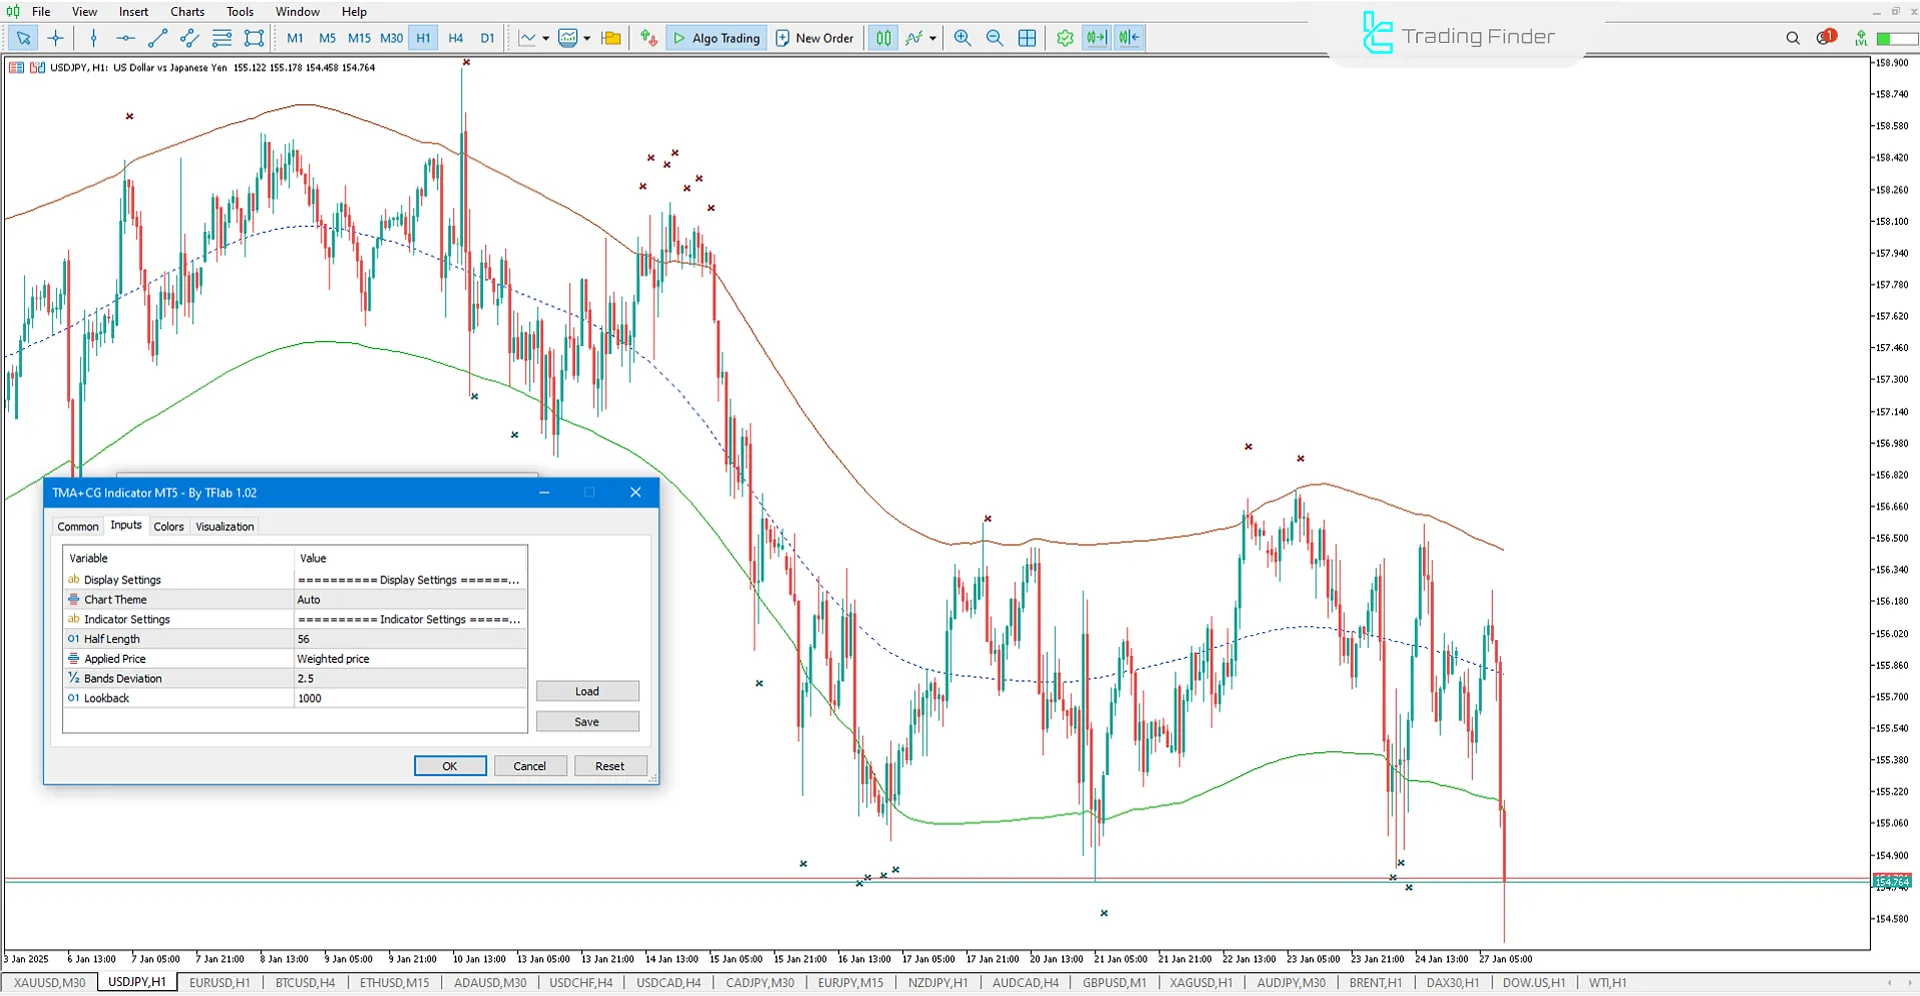
Below are the settings for the TMA + COG indicator:

Display Settings
- Chart Theme: Select the custom theme for the indicator;
Indicator Settings
- Half Length: Set the TMA period;
- Applied Price: Select the price type for calculation;
- Bands Deviation: Set the deviation ratio from the middle TMA line;
- Lookback: Define the number of candles to use for past calculations.
Conclusion
The Triangular Moving Average + Center of Gravity indicator is an excellent tool for traders who want to identify market trends.
Traders, using the MT5 bands and channels indicator, can easily identify uptrends and downtrends and enter buy or sell trades based on the indicator signals.
TMA Center of Gravity MT5 PDF
TMA Center of Gravity MT5 PDF
Click to download TMA Center of Gravity MT5 PDFWhat type of analysis is this indicator suitable for?
This indicator is ideal for trend analysis and for identifying entry and exit points in short-term and medium-term trades. It is especially useful for swing traders looking to spot price breakouts and trend reversals.
Is this indicator suitable for any specific time frame?
The indicator can be used across multiple time frames but is particularly beneficial for short-term traders looking for precise trend identification and breakouts, especially in 1-hour and 4-hour charts.
Create on for tradingview as it may go a long way to us who can't acess meta trader
Thank you for your suggestion. All ideas for creating indicators on TradingView are carefully considered for future development.
This is a fantastic indicator. But it would help if the centre line changed colour as the trend direction changed.
You can have this change implemented. Please stay in touch with our support team on Telegram and WhatsApp for guidance.
please share me same like this mt5 indicator for tradeingviwe if not available for tradingviwe so share me this mt5 indicator source code please
The source codes are not shared. You can use the MetaTrader version for free.
please share me same like this mt5 indicator for tradeingviwe
This indicator is currently available for MetaTrader 4 and 5. You can also explore other popular TradingView indicators on our website https://tradingfinder.com/products/indicators/tradingview/


