![Trend Line Indicator for MetaTrader 5 Download - Free - [TradingFinder]](https://cdn.tradingfinder.com/image/306993/4-61-en-trend-line-mt5-1.webp)
![Trend Line Indicator for MetaTrader 5 Download - Free - [TradingFinder] 0](https://cdn.tradingfinder.com/image/306993/4-61-en-trend-line-mt5-1.webp)
![Trend Line Indicator for MetaTrader 5 Download - Free - [TradingFinder] 1](https://cdn.tradingfinder.com/image/306994/4-61-en-trend-line-mt5-2.webp)
![Trend Line Indicator for MetaTrader 5 Download - Free - [TradingFinder] 2](https://cdn.tradingfinder.com/image/306991/4-61-en-trend-line-mt5-3.webp)
![Trend Line Indicator for MetaTrader 5 Download - Free - [TradingFinder] 3](https://cdn.tradingfinder.com/image/306990/4-61-en-trend-line-mt5-4.webp)
Among the MetaTrader 5 indicators, the Trend Line indicator is a technical analysis tool that automatically displays price channels.
When the price fluctuates within a channel, analysts can adjust their buy (Buy) and sell (Sell) positions based on the levels identified by this indicator.
Additionally, if the price breaks out of the channel, this signals a trend shift, which may lead to a new market movement.
Trend Line Indicator Specifications
The table below summarizes the key features of this indicator:
Indicator Categories: | Support & Resistance MT5 Indicators Supply & Demand MT5 Indicators Levels MT5 Indicators |
Platforms: | MetaTrader 5 Indicators |
Trading Skills: | Intermediate |
Indicator Types: | Reversal MT5 Indicators |
Timeframe: | Multi-Timeframe MT5 Indicators |
Trading Style: | Intraday MT5 Indicators |
Trading Instruments: | Forex MT5 Indicators Crypto MT5 Indicators Stock MT5 Indicators Forward MT5 Indicators Share Stock MT5 Indicators |
Bullish Market Conditions
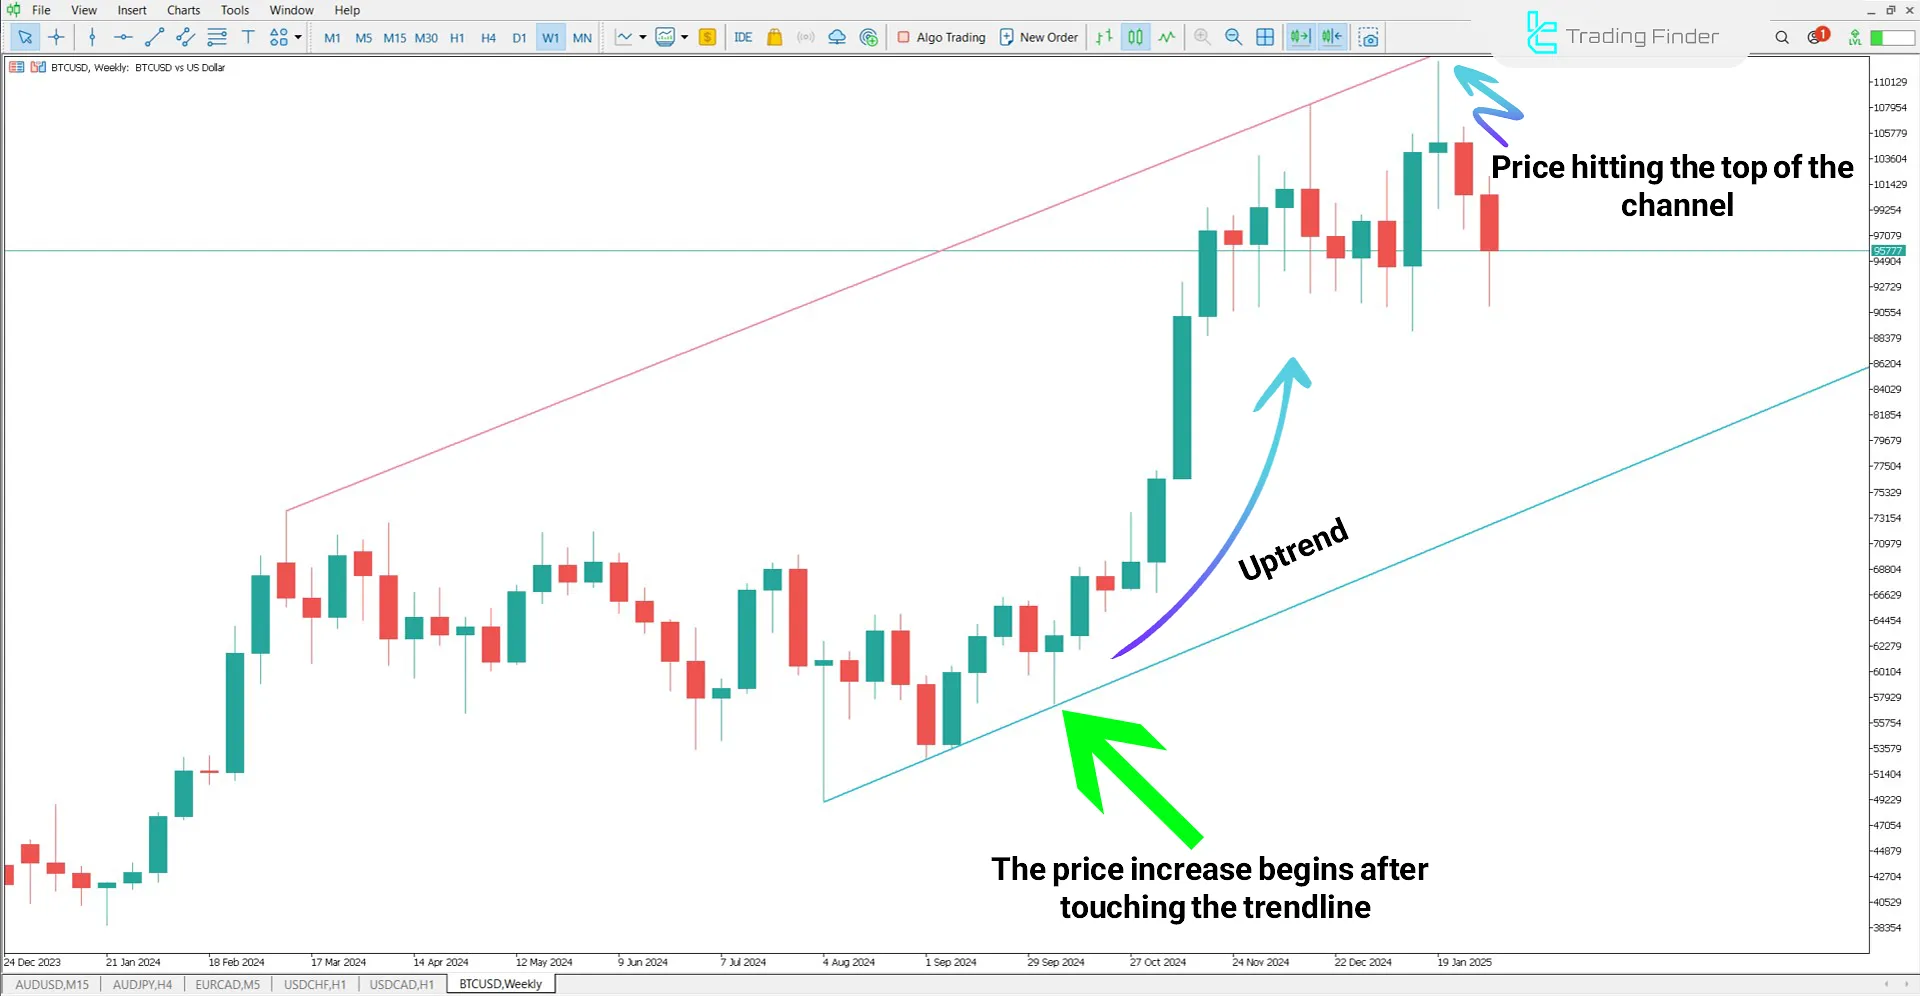
After detecting a bullish channel, the Trend Line Indicator in the Bitcoin (BTC) chart shows that the price rises after touching the lower boundary and declines upon reaching the upper boundary.
Traders can enter positions within these areas and set their stop-loss levels just before these zones.

Bearish Market Conditions
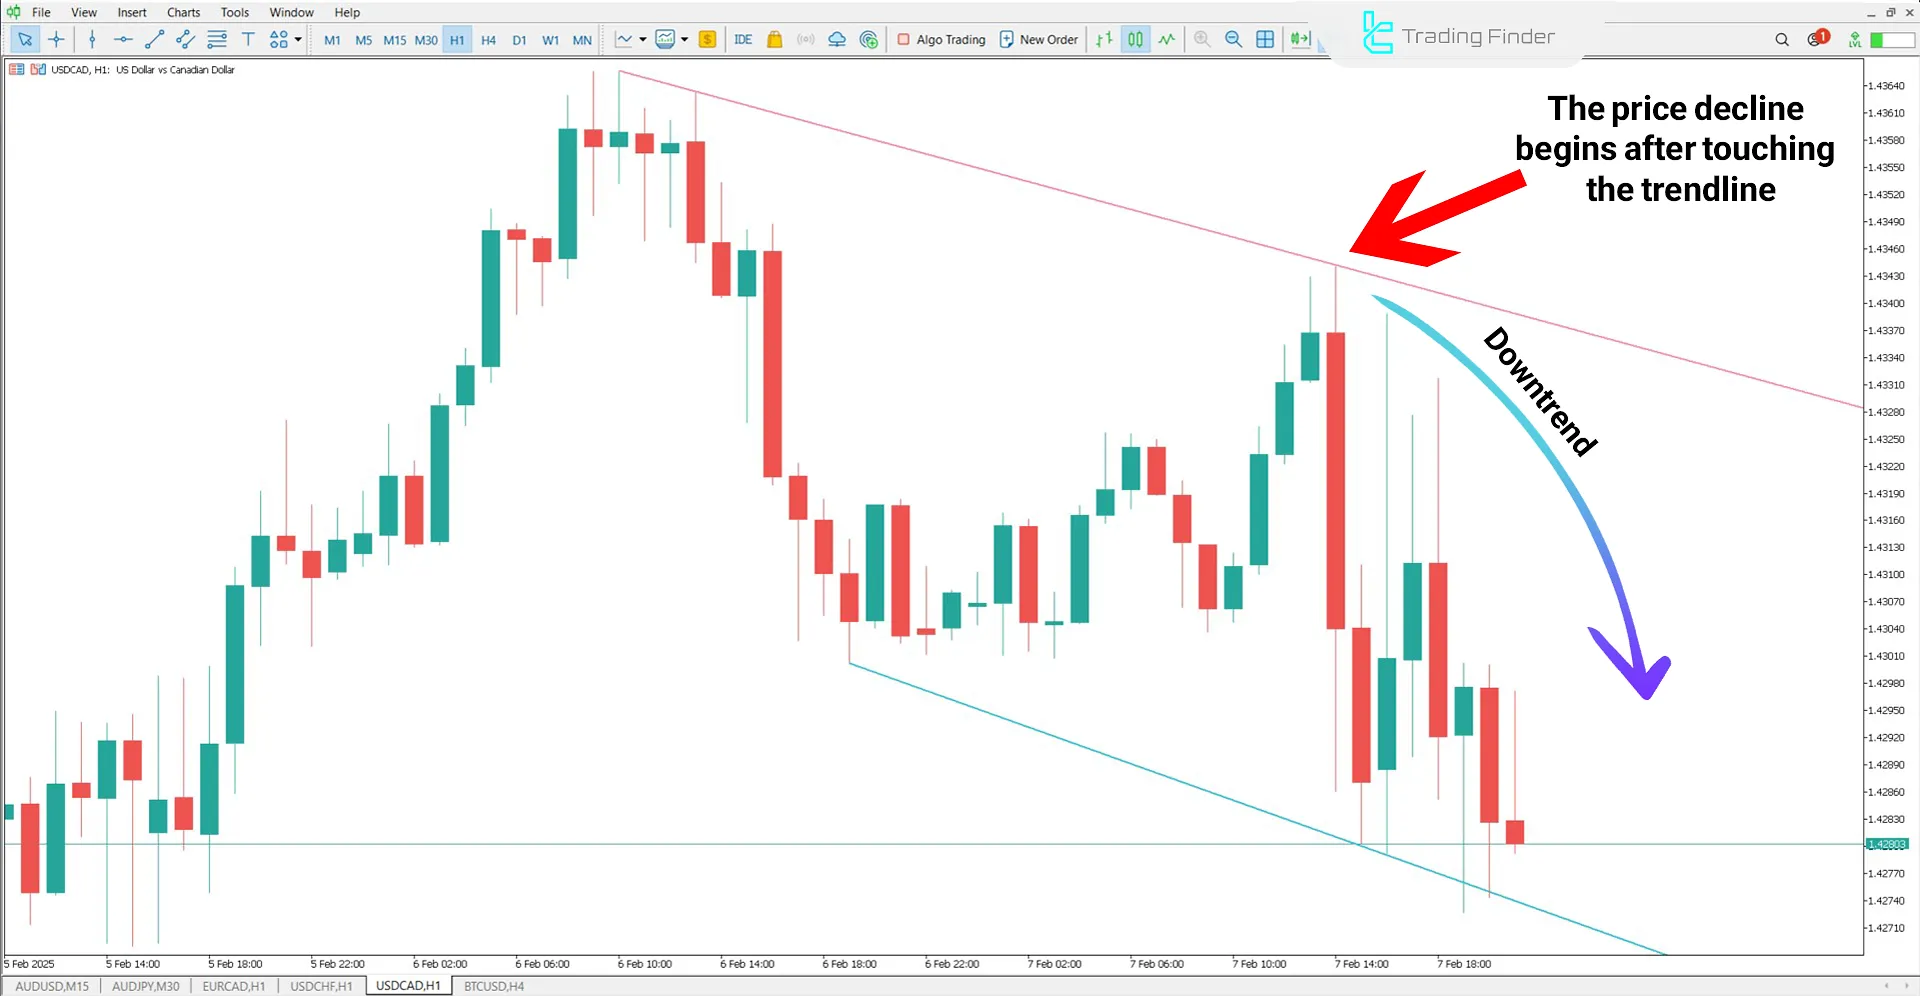
In the USD/CAD pair, the price moves within a bearish channel. Traders typically enter sell (Short) positions when the price touches the upper boundary and exit at the lower boundary.

Trend Line Indicator Settings
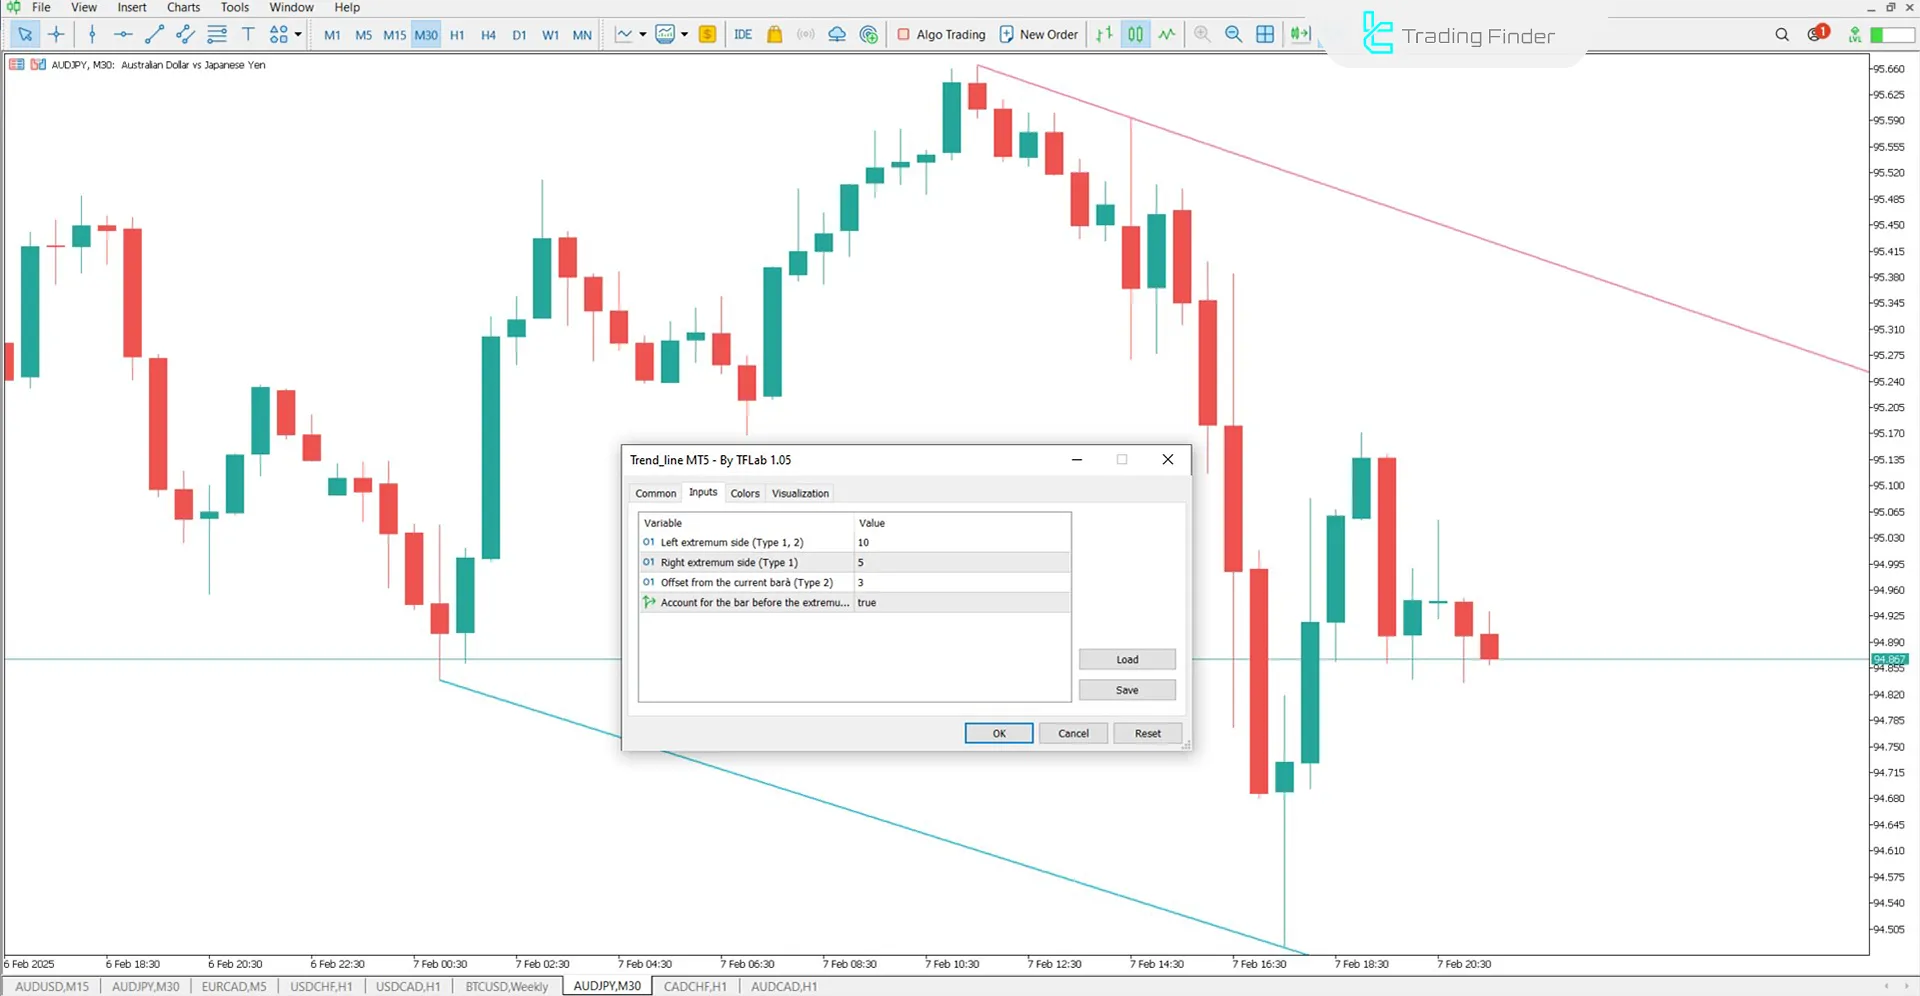
The settings panel for this support and resistance indicator MT5 is fully displayed in the image below:

- Left extremum side (Type 1, 2): Left extremum side (Type 1, 2)
- Right extremum side (Type 1): Right extremum side (Type 1)
- Offset from the current bar (Type 2): Offset from the current bar (Type 2)
- Account for the bar before the extremum (Type 2): Consider the bar before the extremum (Type 2)
Conclusion
The trendline drawing indicator is an essential tool for traders at all levels across various markets, such as Forex. Beginner traders use this tool to more accurately identify the structure of price trends and, by analyzing shorter timeframes, gain a clearer view of price channels in higher timeframes.
Trend Line MT5 PDF
Trend Line MT5 PDF
Click to download Trend Line MT5 PDFHow does the Trend Line Indicator work?
The indicator automatically detects key price points and draws two parallel lines (yellow and pink) on the chart, representing the channel’s boundaries.
Does the Trend Line Indicator support multiple timeframes?
Yes, this indicator can analyze multiple timeframes (Multi Time Frame) and be used across different time periods.
This indicator bears the same name as that of the MT4 but lacks the MTF and fractal functionalities that makes the MT4 Version a better option. Could you please replicate the MT4 Version for MT5? Thank you for your service.
you are welcome. we will check you feedback.
Well-done! Could you assist with framing it to have the attributes of Fractals Adjustable Period Trend Lines Indicator? Thank you for your service.
Well come. i will check, if its possible, we will add and update this indicator.


