![Trend Striker Extreme Indicator in MT5 Download – Free – [TradingFinder]](https://cdn.tradingfinder.com/image/551506/13-215-en-trend-striker-extreme-mt5-01.webp)
![Trend Striker Extreme Indicator in MT5 Download – Free – [TradingFinder] 0](https://cdn.tradingfinder.com/image/551506/13-215-en-trend-striker-extreme-mt5-01.webp)
![Trend Striker Extreme Indicator in MT5 Download – Free – [TradingFinder] 1](https://cdn.tradingfinder.com/image/551503/13-215-en-trend-striker-extreme-mt5-02.webp)
![Trend Striker Extreme Indicator in MT5 Download – Free – [TradingFinder] 2](https://cdn.tradingfinder.com/image/551500/13-215-en-trend-striker-extreme-mt5-03.webp)
![Trend Striker Extreme Indicator in MT5 Download – Free – [TradingFinder] 3](https://cdn.tradingfinder.com/image/551504/13-215-en-trend-striker-extreme-mt5-04.webp)
The Trend Striker Extreme indicator is designed for use in the MetaTrader 5 platform to determine the direction and strength of market trends.
This trading tool, by displaying blue and red bars, illustrates price movements as bullish or bearish. In addition, the strength of each trend is also presented on the chart as a percentage.
Trend Striker Extreme Indicator Specifications Table
The table below shows the specifications of the Trend Striker Extreme Indicator.
Indicator Categories: | Signal & Forecast MT5 Indicators Currency Strength MT5 Indicators Trading Assist MT5 Indicators |
Platforms: | MetaTrader 5 Indicators |
Trading Skills: | Elementary |
Indicator Types: | Reversal MT5 Indicators |
Timeframe: | Multi-Timeframe MT5 Indicators |
Trading Style: | Swing Trading MT5 Indicators Scalper MT5 Indicators Day Trading MT5 Indicators |
Trading Instruments: | Forex MT5 Indicators Crypto MT5 Indicators Stock MT5 Indicators |
Trend Striker Extreme Indicator at a Glance
The Trend Striker Extreme indicator uses blue histograms to illustrate bullish market moves and red bars to display bearish trends.
In addition, this indicator not only identifies the direction of price movement but also shows entry and exit signals along with the percentage of trend strength at the top right corner of the chart.
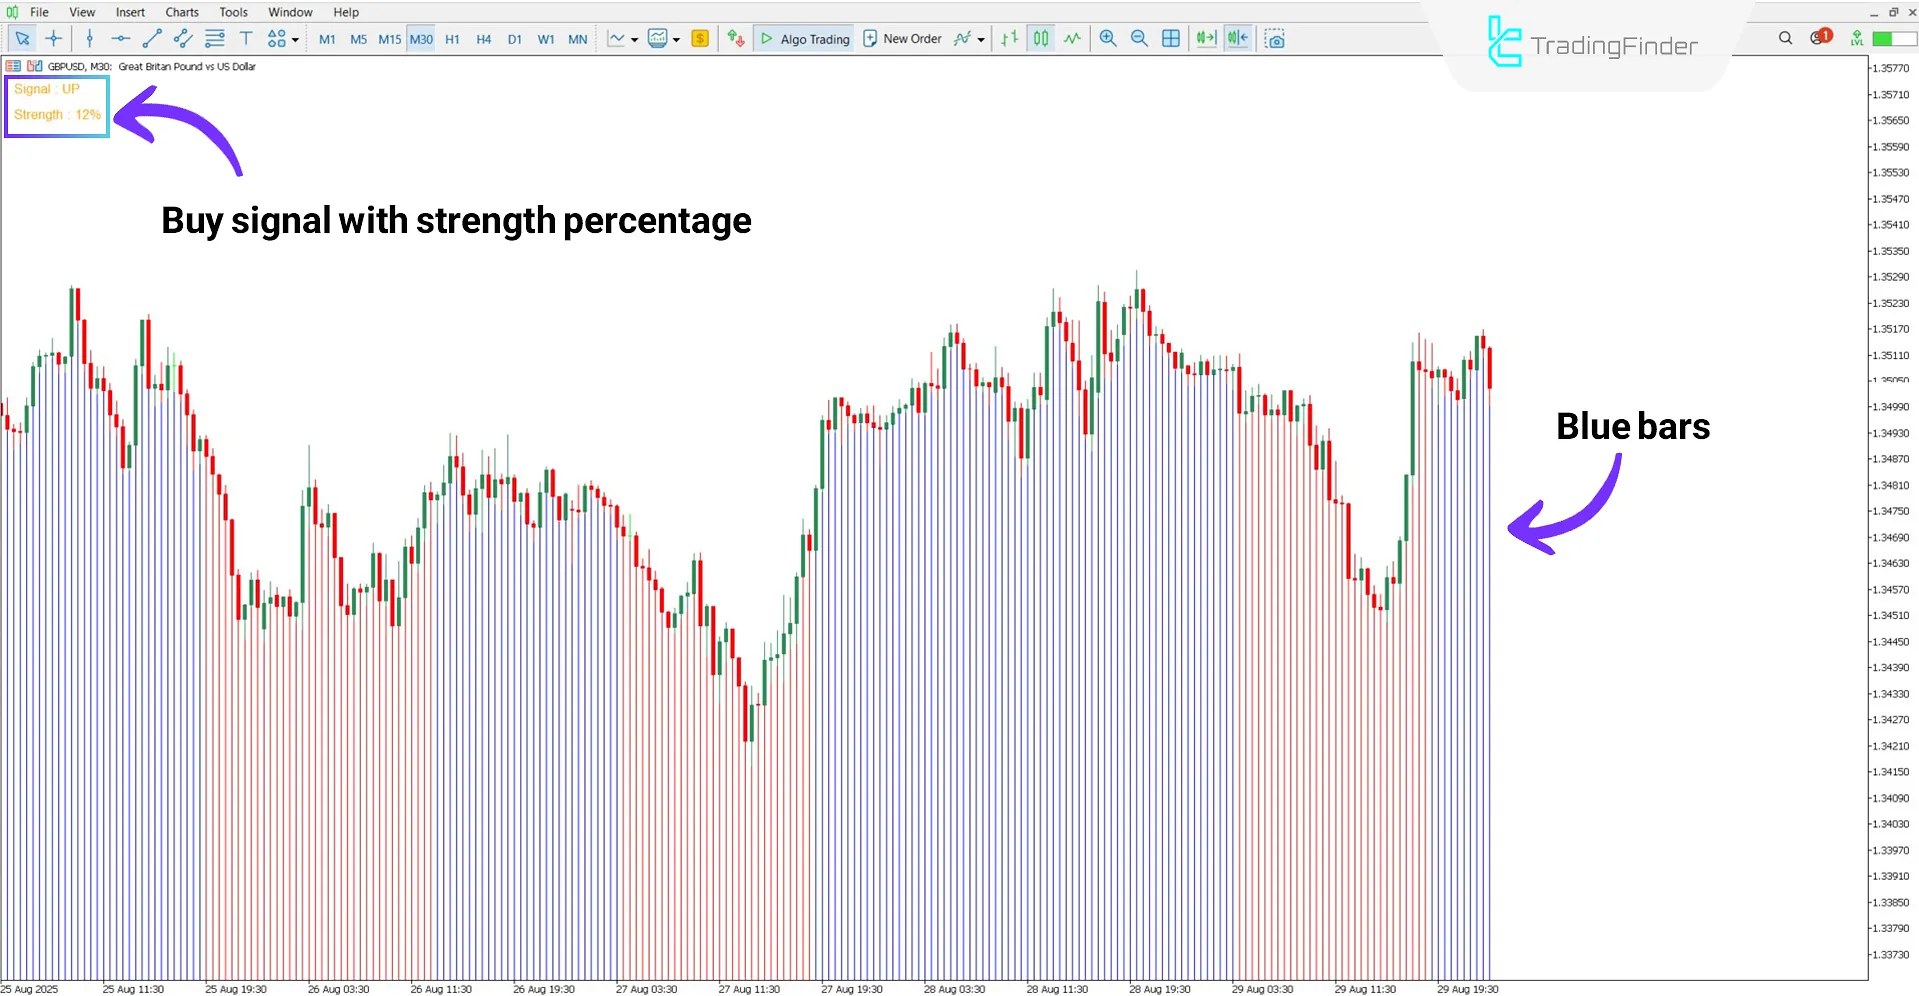
Buy Signal
According to the GBP/USD chart on the 30-minute timeframe, blue histograms indicate the formation of a bullish trend. Moreover, the indicator displays the buy signal along with the percentage of trend strength directly on the chart.

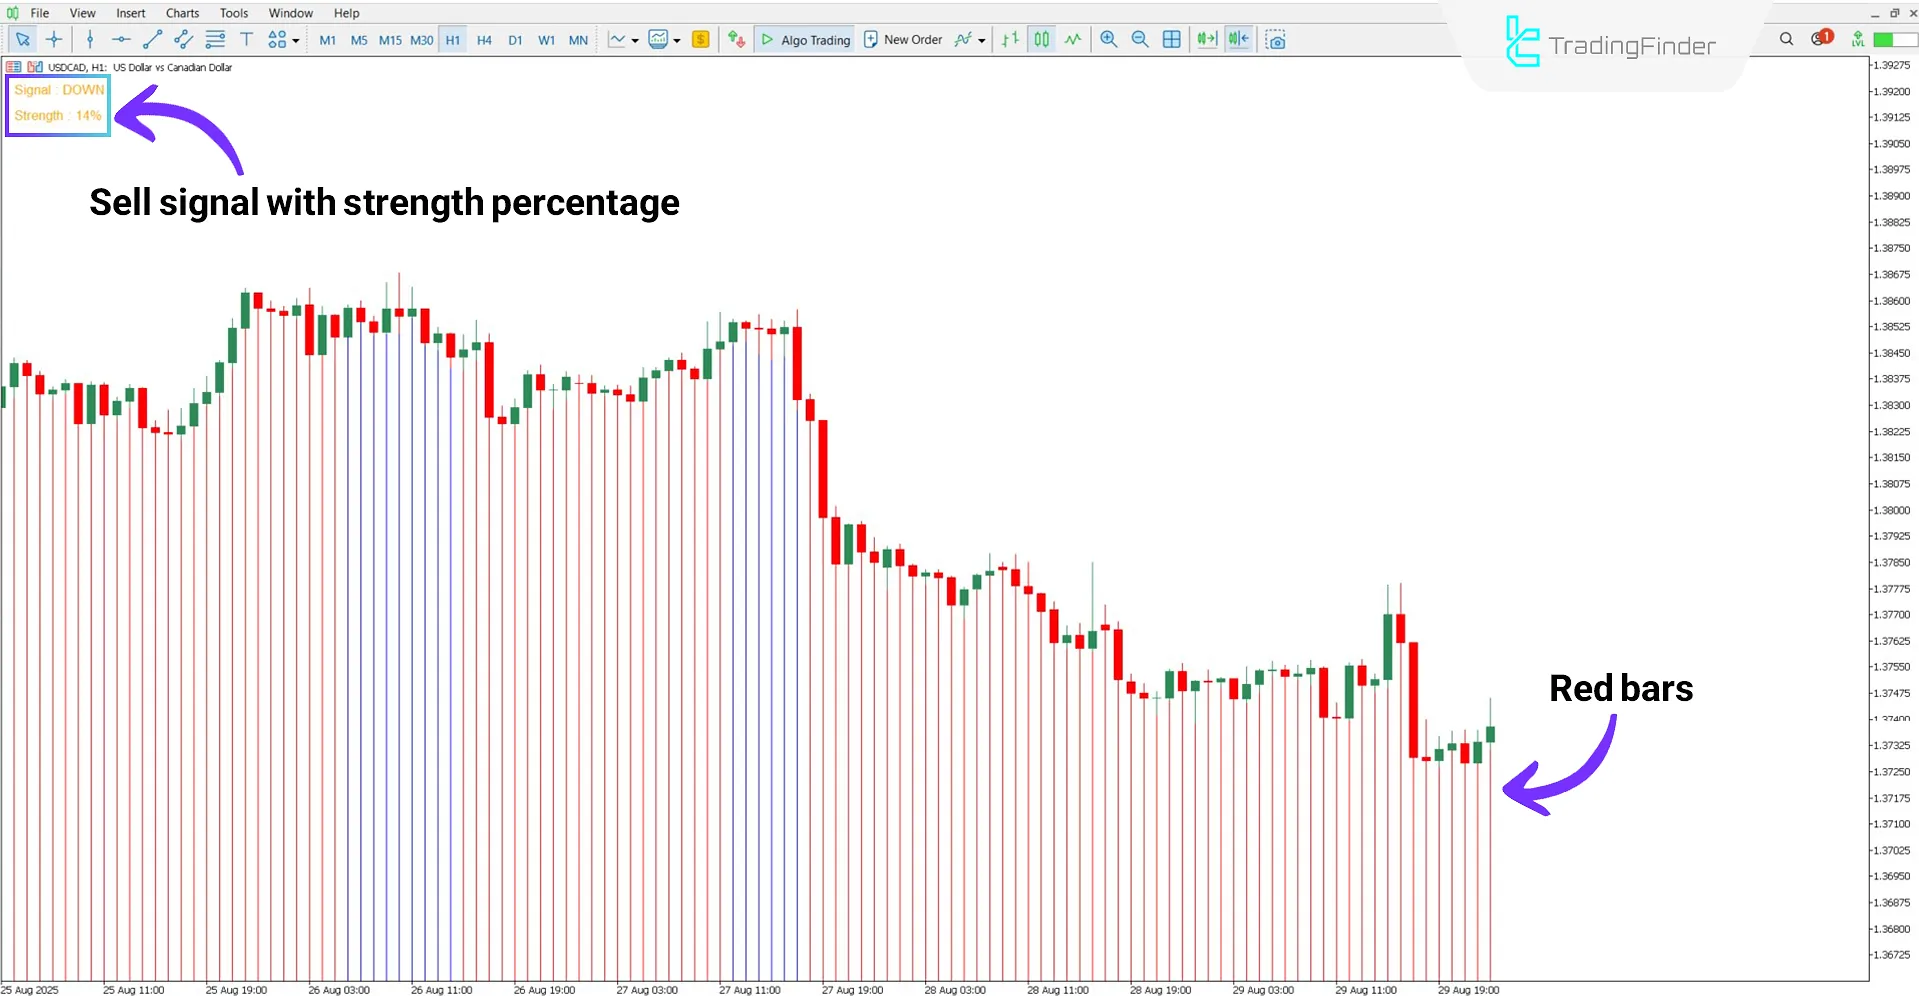
Sell Signal
Based on the USD/CAD chart on the 1-hour timeframe, the bearish market direction is represented with red histograms.
In such a situation, the indicator, after analyzing the trend, provides the sell signal along with the percentage of bearish trend strength on the chart.

Trend Striker Extreme Indicator Settings
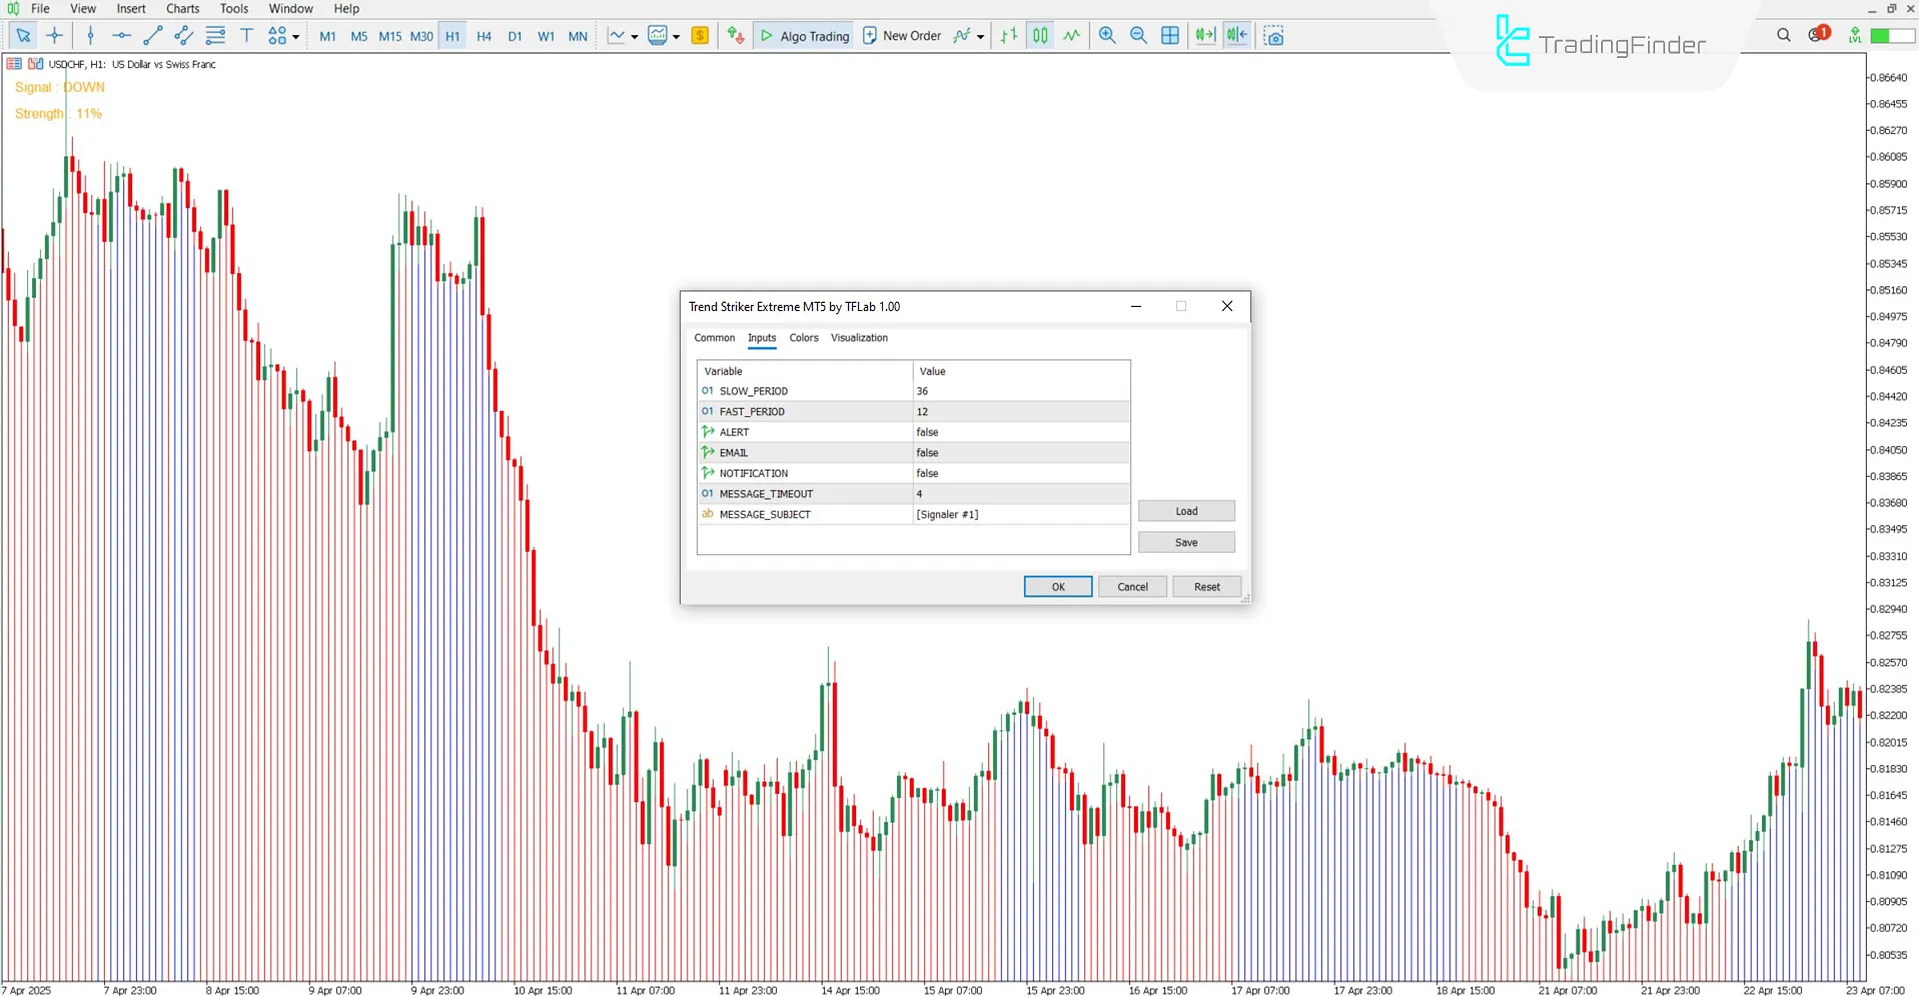
The settings of the Trend Striker Extreme Indicator are as follows:

- SLOW_PERIOD: Slow period for trend calculation
- FAST_PERIOD: Fast period for trend calculation
- ALERT: Alert when a signal changes
- EMAIL: Send signal notification to email
- NOTIFICATION: Send signal notification
- MESSAGE_TIMEOUT: Display duration of the signal message
- MESSAGE_SUBJECT: Signal message subject for alerts
Conclusion
The Trend Striker Extreme Indicator is a practical yet simple tool for identifying the direction and intensity of market trends.
This trading tool uses blue histograms for bullish movements and red for bearish movements, visualizes the market trend, and automatically provides buy and sell signals along with trend strength percentage to traders.
Trend Striker Extreme Indicator in MT5 PDf
Trend Striker Extreme Indicator in MT5 PDf
Click to download Trend Striker Extreme Indicator in MT5 PDfCan this tool be used in the cryptocurrency market?
Yes, traders can use the Trend Striker Extreme Indicator in all markets, including cryptocurrencies.
How does this indicator generate buy and sell signals?
The Trend Striker Extreme Indicator displays trading signals as labels directly on the chart.


