![Triangle Pattern Indicator for MetaTrader 5 Download - [TradingFinder]](https://cdn.tradingfinder.com/image/348514/2-52-en-triangle-pattern-mt5-1.webp)
![Triangle Pattern Indicator for MetaTrader 5 Download - [TradingFinder] 0](https://cdn.tradingfinder.com/image/348514/2-52-en-triangle-pattern-mt5-1.webp)
![Triangle Pattern Indicator for MetaTrader 5 Download - [TradingFinder] 1](https://cdn.tradingfinder.com/image/348511/2-52-en-triangle-pattern-mt5-2.webp)
![Triangle Pattern Indicator for MetaTrader 5 Download - [TradingFinder] 2](https://cdn.tradingfinder.com/image/348513/2-52-en-triangle-pattern-mt5-3.webp)
![Triangle Pattern Indicator for MetaTrader 5 Download - [TradingFinder] 3](https://cdn.tradingfinder.com/image/348512/2-52-en-triangle-pattern-mt5-4.webp)
The Triangle Pattern Indicator on MetaTrader 5 is a technical analysis tool that automatically identifies highs, lows, and trendlines. It draws triangle patterns in price compression zones using a blue fill.
Additionally, the indicator plots two converging dashed red lines on the chart as the triangle’s upper and lower boundaries, indicating a potential breakout zone.
Triangle Pattern Indicator Specifications Table
The table below outlines the key features of the Triangle Pattern Indicator.
Indicator Categories: | Price Action MT5 Indicators Signal & Forecast MT5 Indicators Chart & Classic MT5 Indicators |
Platforms: | MetaTrader 5 Indicators |
Trading Skills: | Elementary |
Indicator Types: | Breakout MT5 Indicators |
Timeframe: | Multi-Timeframe MT5 Indicators |
Trading Style: | Intraday MT5 Indicators |
Trading Instruments: | Forex MT5 Indicators Crypto MT5 Indicators Stock MT5 Indicators Forward MT5 Indicators |
Uptrend Conditions
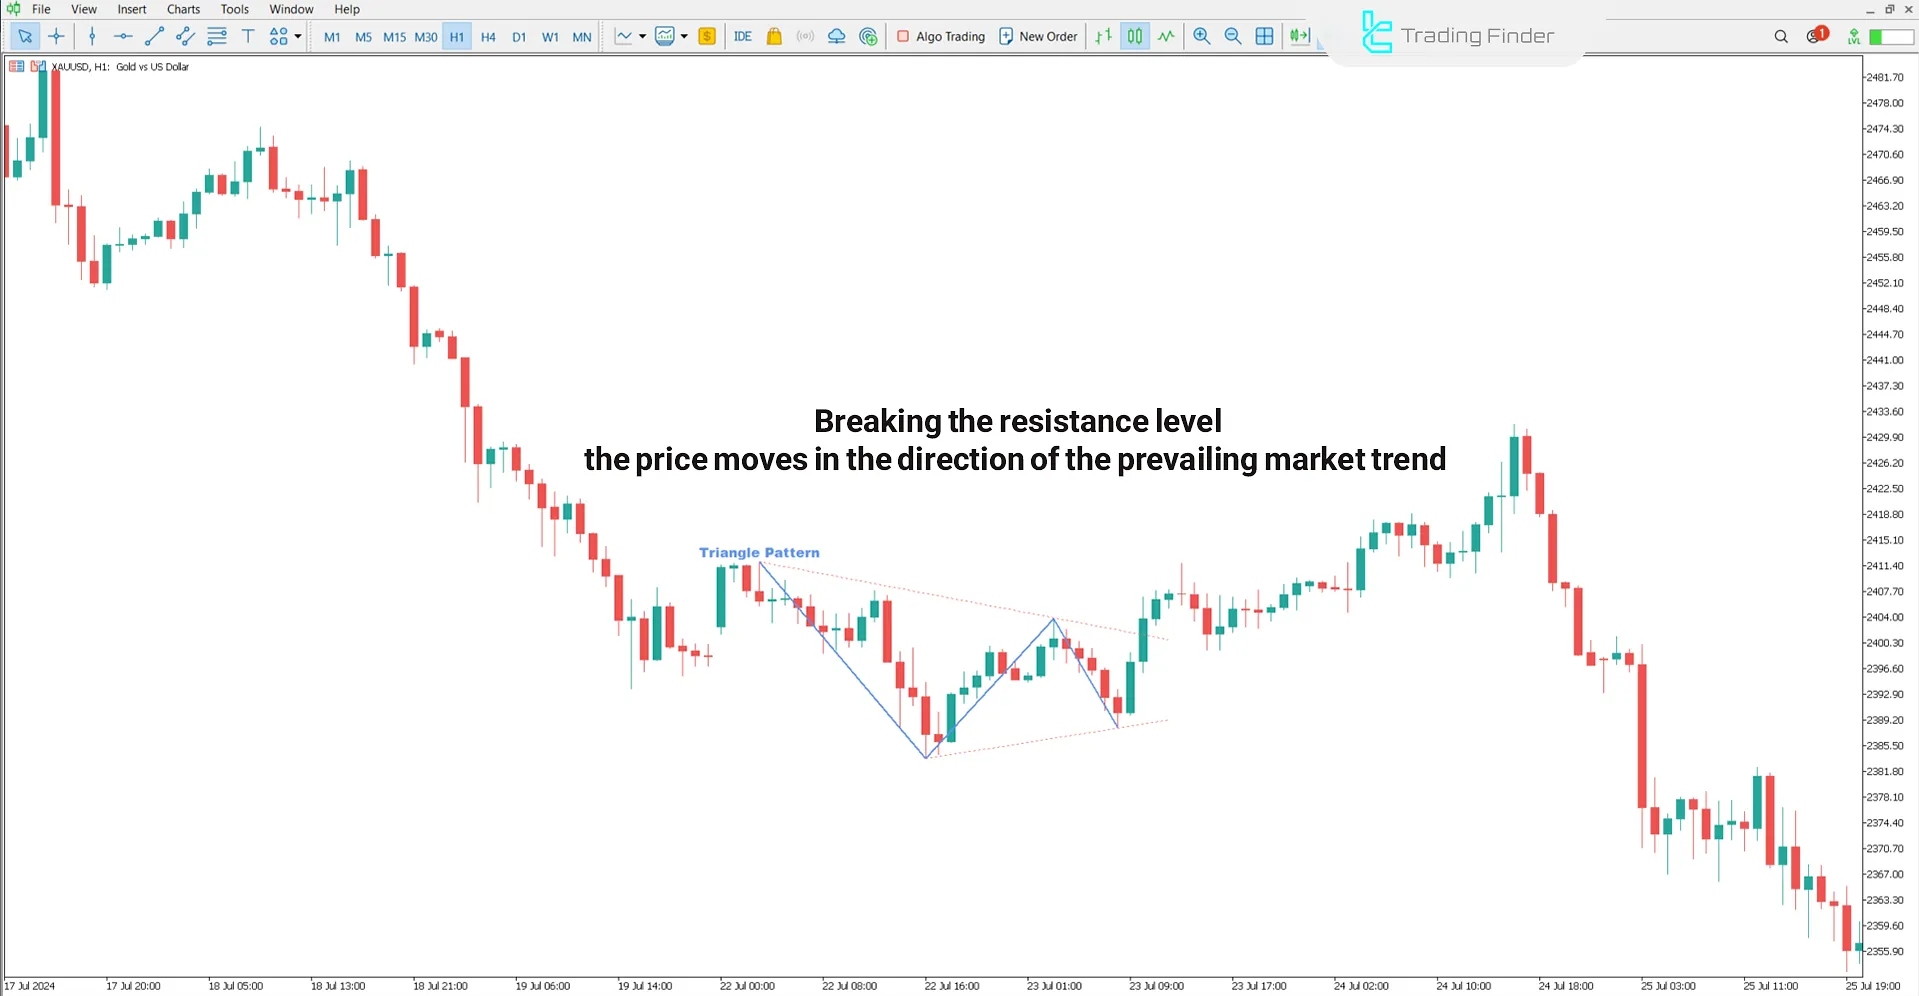
In the 1-hour chart of spot gold (XAU/USD), a bullish triangle pattern forms when the market breaks through resistance and continues forming higher highs and higher lows in line with the prevailing bullish trend.
This structure usually indicates a bullish continuation and reduced selling pressure.

Downtrend Conditions
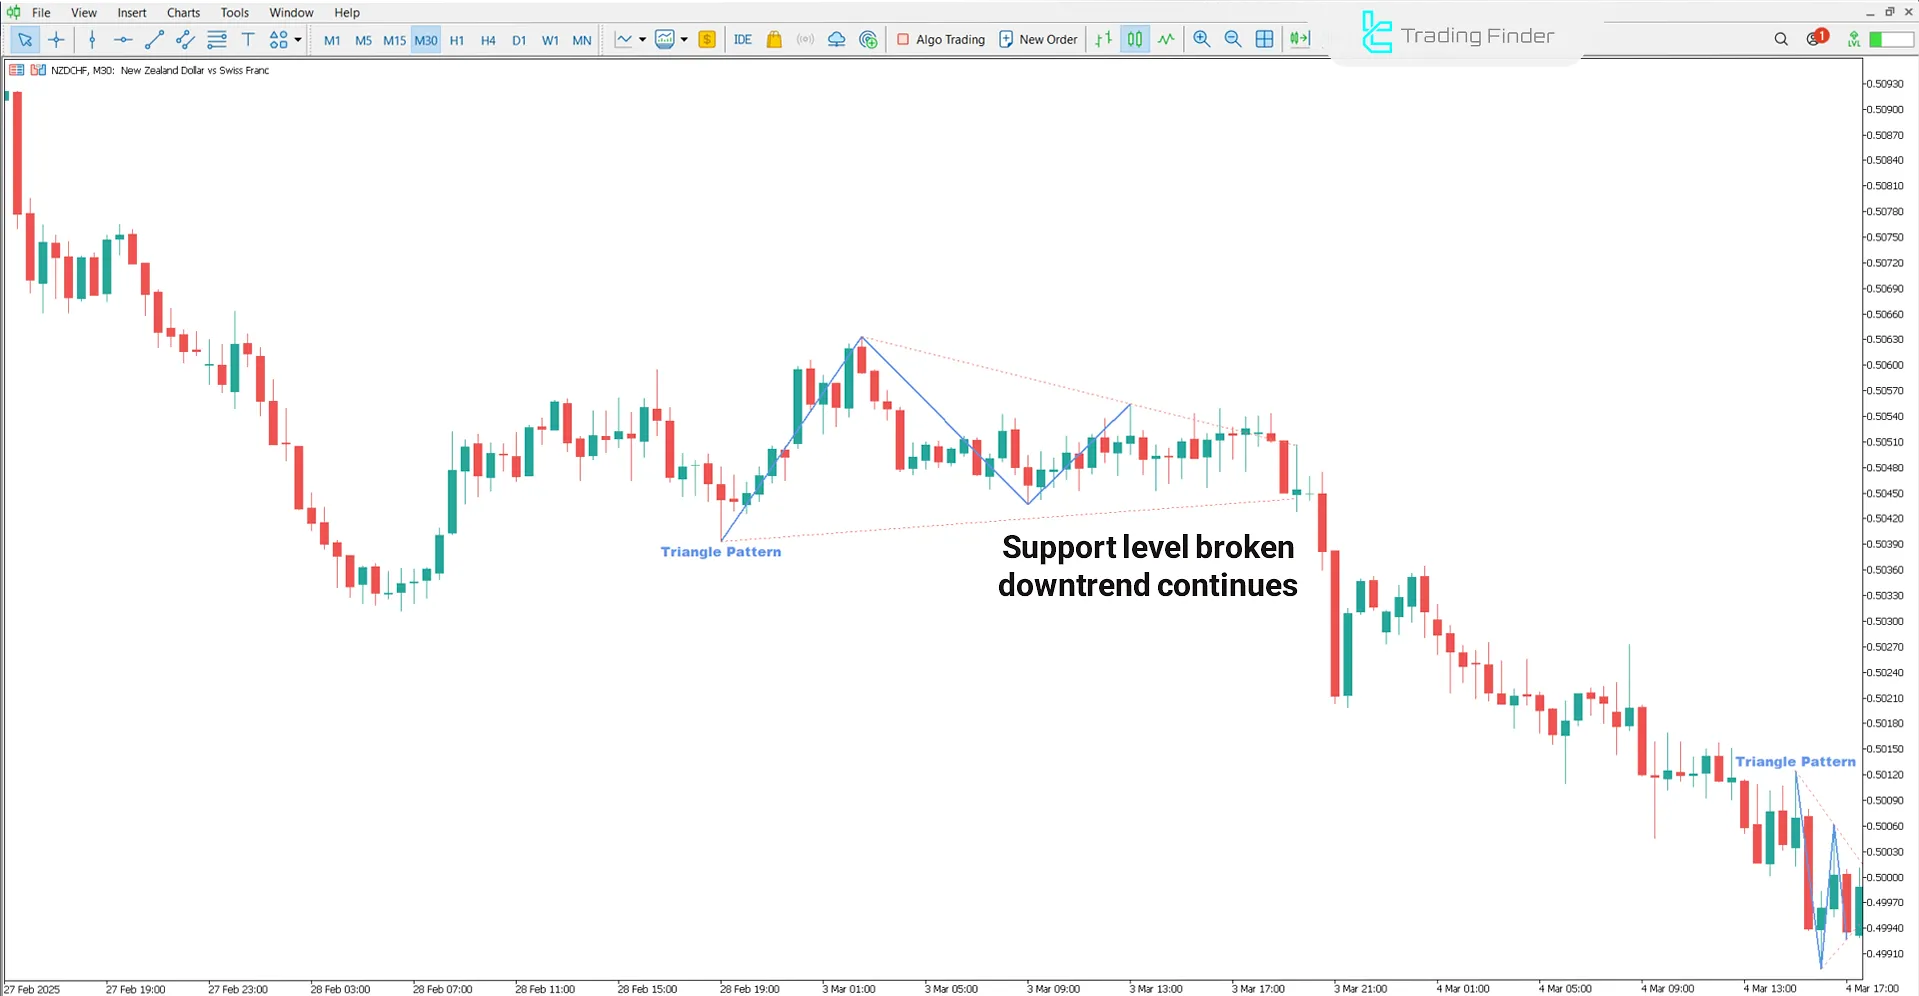
The following chart shows the NZD/CHF currency pair in a 30-minute timeframe.
A bearish triangle forms when support is broken, and lower lows emerge, indicating strengthening bearish momentum and increased seller pressure in the market.

Triangle Pattern Indicator Settings
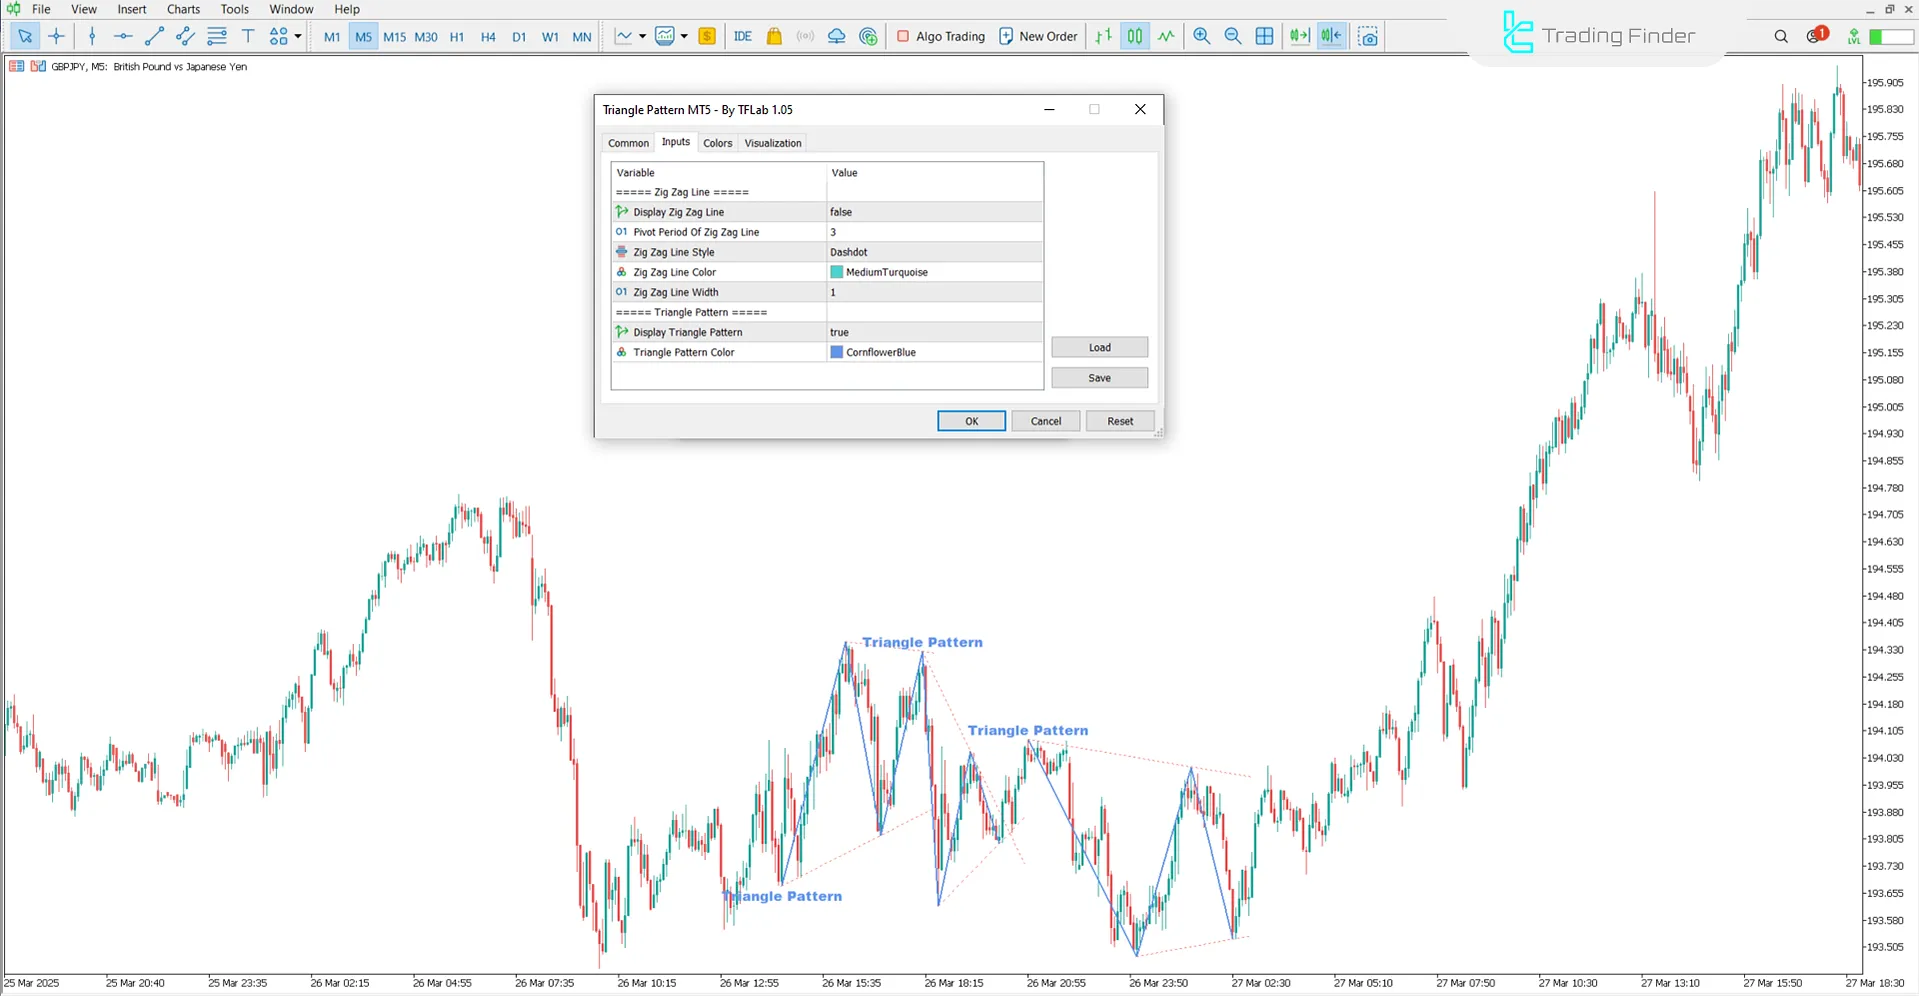
The image below displays the adjustable settings of the Triangle Pattern Indicator:

- Show Zig Zag Line: Show Zig Zag line
- Pivot Period Of Zig Zag Line: Pivot period of the Zig Zag line
- Zig Zag Line Style: Style of the Zig Zag line
- Zig Zag Line Color: Color of the Zig Zag line
- Zig Zag Line Width: Width of the Zig Zag line
- Show Triangle Pattern: Show triangle pattern
- Triangle Pattern Color: The color of the triangle pattern
Conclusion
The Triangle Pattern Indicator automatically identifies triangle patterns using highs, lows, trendline slopes, and volume data.
After identifying a triangle formation, the potential breakout zone is displayed with dashed red converging trendlines.
Triangle Pattern MT5 PDF
Triangle Pattern MT5 PDF
Click to download Triangle Pattern MT5 PDFHow does the Triangle Pattern Indicator work?
The indicator identifies triangle patterns by analyzing peaks, troughs, trendline angles, and volume activity.
When does the triangle pattern form in this indicator?
In this indicator, the triangle pattern forms when the price compresses within a specific zone, signaling consolidation before a breakout.


