![Triple Bottom and Triple Top Indicator for MT5 Download - [TradingFinder]](https://cdn.tradingfinder.com/image/346375/2-55-en-triplebottom-tripletop-mt5-1.webp)
![Triple Bottom and Triple Top Indicator for MT5 Download - [TradingFinder] 0](https://cdn.tradingfinder.com/image/346375/2-55-en-triplebottom-tripletop-mt5-1.webp)
![Triple Bottom and Triple Top Indicator for MT5 Download - [TradingFinder] 1](https://cdn.tradingfinder.com/image/346376/2-55-en-triplebottom-tripletop-mt5-2.webp)
![Triple Bottom and Triple Top Indicator for MT5 Download - [TradingFinder] 2](https://cdn.tradingfinder.com/image/346378/2-55-en-triplebottom-tripletop-mt5-3.webp)
![Triple Bottom and Triple Top Indicator for MT5 Download - [TradingFinder] 3](https://cdn.tradingfinder.com/image/346377/2-55-en-triplebottom-tripletop-mt5-4png.webp)
The Triple Bottom and Triple Top indicator is a technical analysis tool available on the MetaTrader 5 platform. It detects potential trend reversal zones.
These patterns include three consecutive peaks in a resistance area (Triple Top, displayed in blue) or three straight troughs in a support zone (Triple Bottom, shown in red), indicating a possible price direction reversal.
Triple Bottom and Triple Top Specifications Table
Key parameters of the Triple Bottom and Triple Top indicator are shown in the table below.
Indicator Categories: | Price Action MT5 Indicators Chart & Classic MT5 Indicators Candle Sticks MT5 Indicators |
Platforms: | MetaTrader 5 Indicators |
Trading Skills: | Intermediate |
Indicator Types: | Reversal MT5 Indicators |
Timeframe: | Multi-Timeframe MT5 Indicators |
Trading Style: | Intraday MT5 Indicators |
Trading Instruments: | Forex MT5 Indicators Crypto MT5 Indicators Stock MT5 Indicators Forward MT5 Indicators Share Stock MT5 Indicators |
Uptrend Conditions
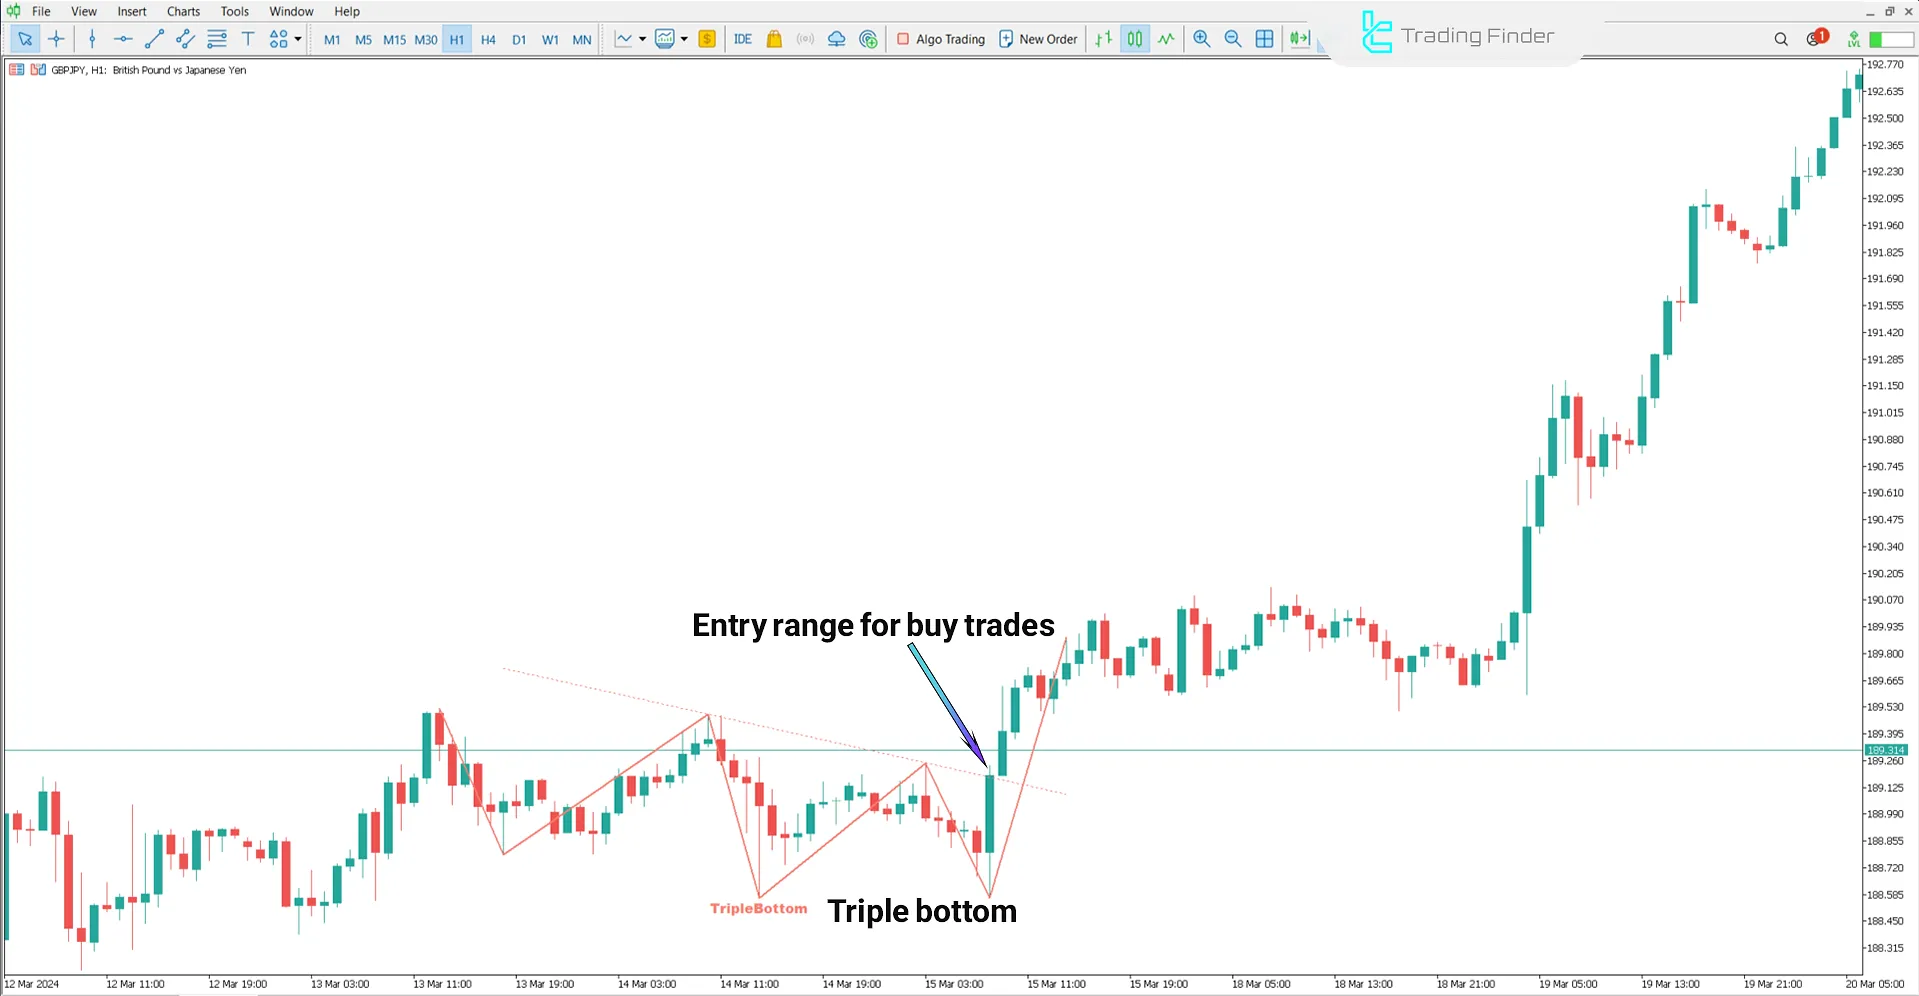
On the GBP/JPY hourly chart, a Triple Bottom pattern appears.
In this setup, the price reacts three times to a specific support zone without breaking it. This recurring behavior reflects reduced selling pressure and could indicate the beginning of an upward trend.

Downtrend Conditions
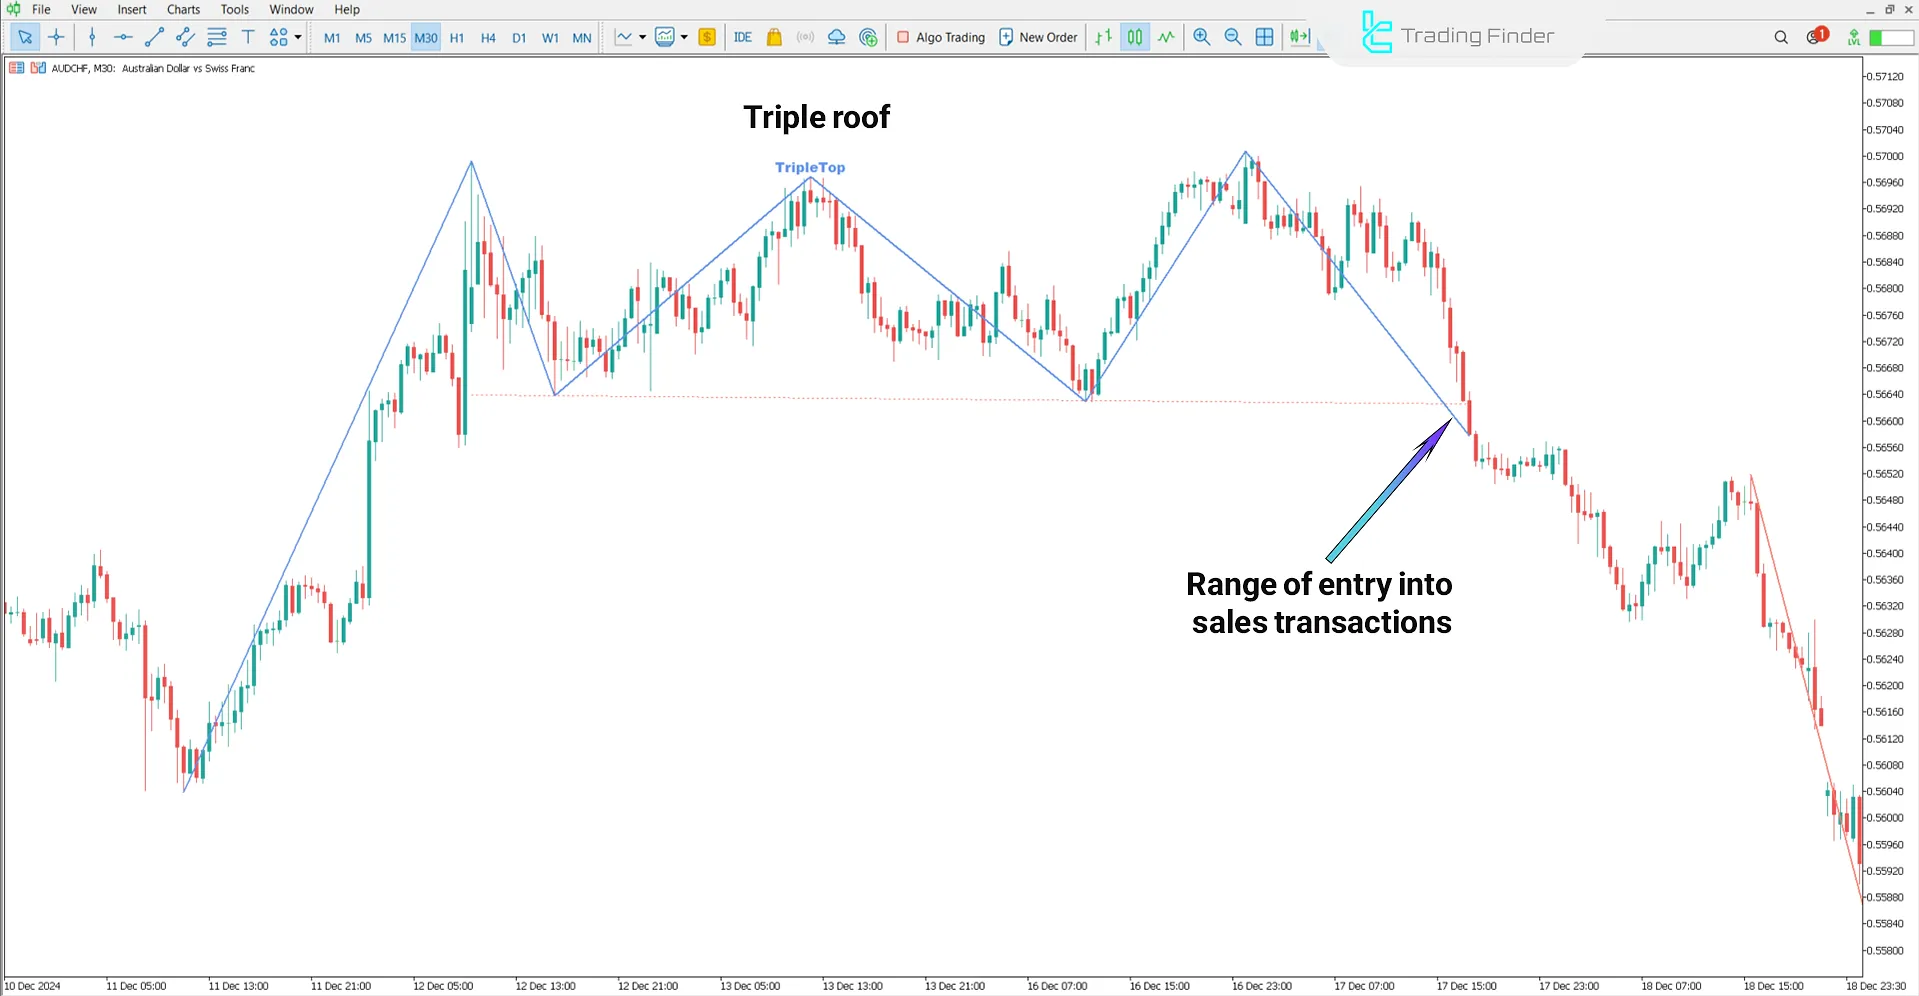
The chart below displays the AUD/CHF currency pair in a 30-minute timeframe.
In this indicator, the Triple Top pattern issues a sell signal after three unsuccessful resistance attempts followed by a support break. This breakout signals decreased demand and increased selling pressure.

Indicator Settings
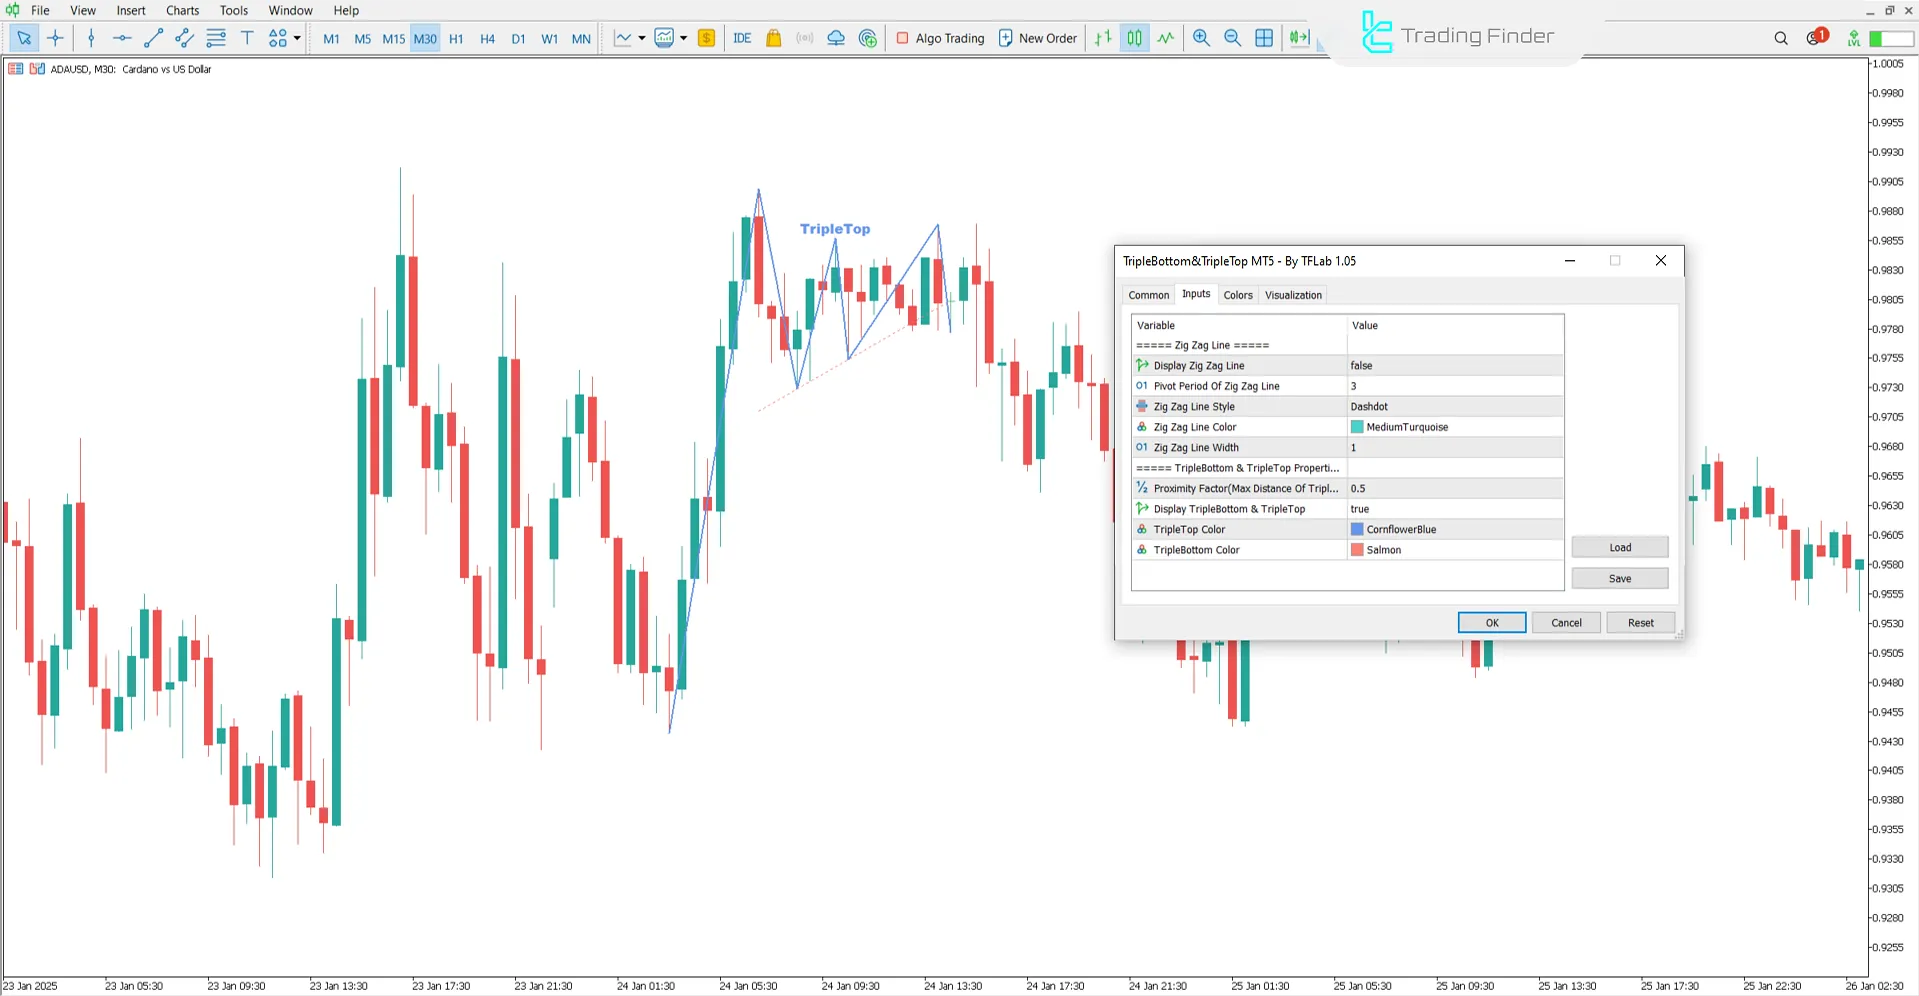
The indicator settings panel for Triple Bottom and Triple Top is shown in the image below:

- Display Zig Zag Line: Show zigzag line
- Pivot Period Of Zig Zag Line: Zigzag pivot period (number of candles required to detect turning points)
- Zig Zag Line Style: Display style of the zigzag line
- Zig Zag Line Color: Color of the zigzag line
- Zig Zag Line Width: Width of the zigzag line
- Proximity Factor (Max Distance): Maximum allowed distance between peaks or troughs for pattern validation
- Display TripleBottom & TripleTop: Show Triple Bottom and Triple Top patterns
- TripleTop Color: The Color of the Triple Top pattern
- TripleBottom Color: The Color of the Triple Bottom pattern
Conclusion
The Triple Bottom and Triple Top indicators are useful in technical analysis for detecting reversal patterns, A Triple Top with a support break is considered a sell signal. A Triple Bottom with a resistance breakout is treated as a buy signal.
Triple Bottom Triple Top MT5 PDF
Triple Bottom Triple Top MT5 PDF
Click to download Triple Bottom Triple Top MT5 PDFIn which markets can the Triple Bottom and Triple Top indicators be used?
This trading tool applies to all financial markets, including Forex, cryptocurrencies, and stocks.
What timeframes does this tool support?
This is a multi-time frame indicator and can be used across all timeframes.


