![TRO Midpoint Indicator for MetaTrader 5 Download - [TradingFinder]](https://cdn.tradingfinder.com/image/433212/2-92-en-tro-midpoint-indicator-mt5-1.webp)
![TRO Midpoint Indicator for MetaTrader 5 Download - [TradingFinder] 0](https://cdn.tradingfinder.com/image/433212/2-92-en-tro-midpoint-indicator-mt5-1.webp)
![TRO Midpoint Indicator for MetaTrader 5 Download - [TradingFinder] 1](https://cdn.tradingfinder.com/image/433213/2-92-en-tro-midpoint-indicator-mt5-2.webp)
![TRO Midpoint Indicator for MetaTrader 5 Download - [TradingFinder] 2](https://cdn.tradingfinder.com/image/433215/2-92-en-tro-midpoint-indicator-mt5-3.webp)
![TRO Midpoint Indicator for MetaTrader 5 Download - [TradingFinder] 3](https://cdn.tradingfinder.com/image/433214/2-92-en-tro-midpoint-indicator-mt5-4.webp)
The TRO Midpoint Indicator is a simple yet practical trading tool that calculates the midpoint between the current and previous candles using raw price data and displays them as colored dots.
Its main focus is purely on price action, making it ideal for assessing the true strength of candles in guiding market trends.
TRO Midpoint Indicator Table
The general specifications of the TRO Midpoint Indicator are presented in the table below.
Indicator Categories: | Currency Strength MT5 Indicators Trading Assist MT5 Indicators Candle Sticks MT5 Indicators |
Platforms: | MetaTrader 5 Indicators |
Trading Skills: | Elementary |
Indicator Types: | Reversal MT5 Indicators |
Timeframe: | Multi-Timeframe MT5 Indicators |
Trading Style: | Intraday MT5 Indicators |
Trading Instruments: | Forex MT5 Indicators Crypto MT5 Indicators Stock MT5 Indicators |
Indicator at a Glance
By calculating the average of the high and low of each candle, the TRO Midpoint Indicator identifies the center of price fluctuations and plots two midpoint dots—one for the current and one for the previous candle—on the chart.
The position of these dots relative to the candle body plays a significant role in trend analysis:
- If the midpoint lies below the body, it signals buying pressure;
- If the midpoint lies above the body, it reflects selling pressure.
Uptrend Condition
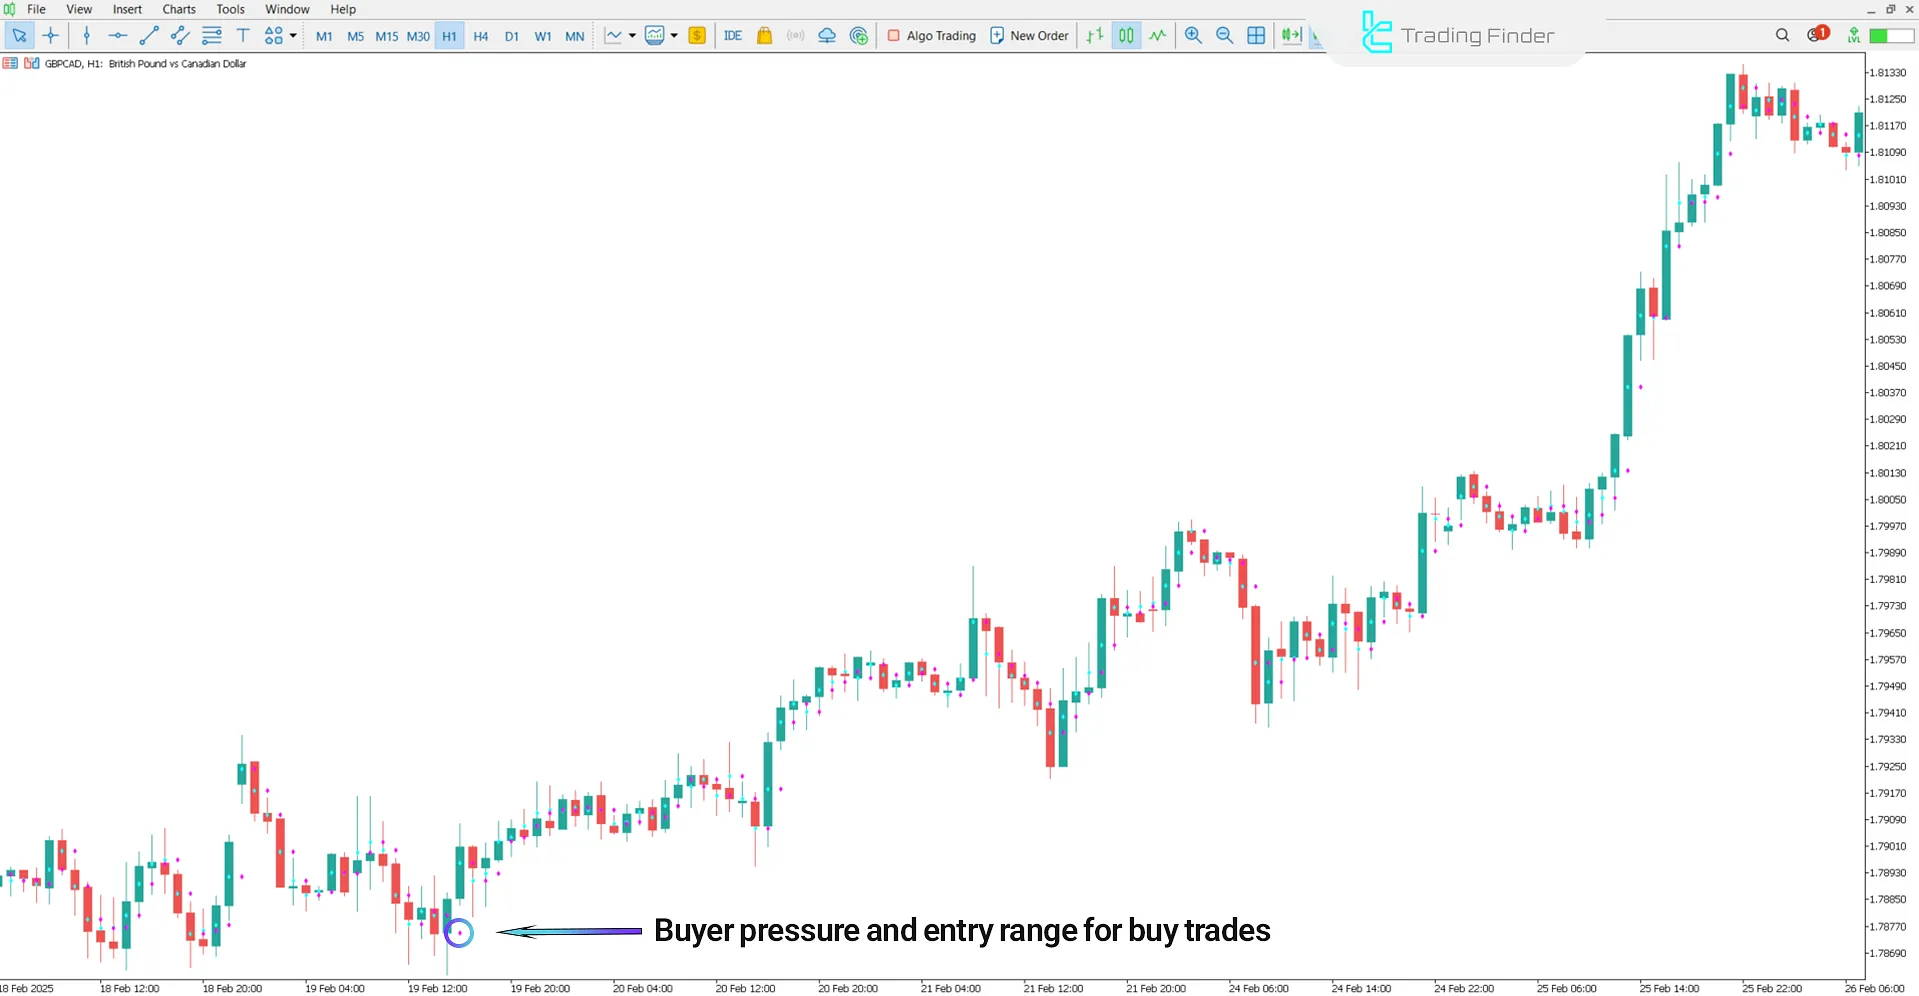
The following chart shows the GBP/CAD pair on a 1-hour timeframe. In technical analysis using this trading tool, When the red midpoint dot appears below the candle, it indicates that the price spent most of its time above the fluctuation center—this suggests strong bullish momentum and signals a potential buy zone.

Downtrend Condition
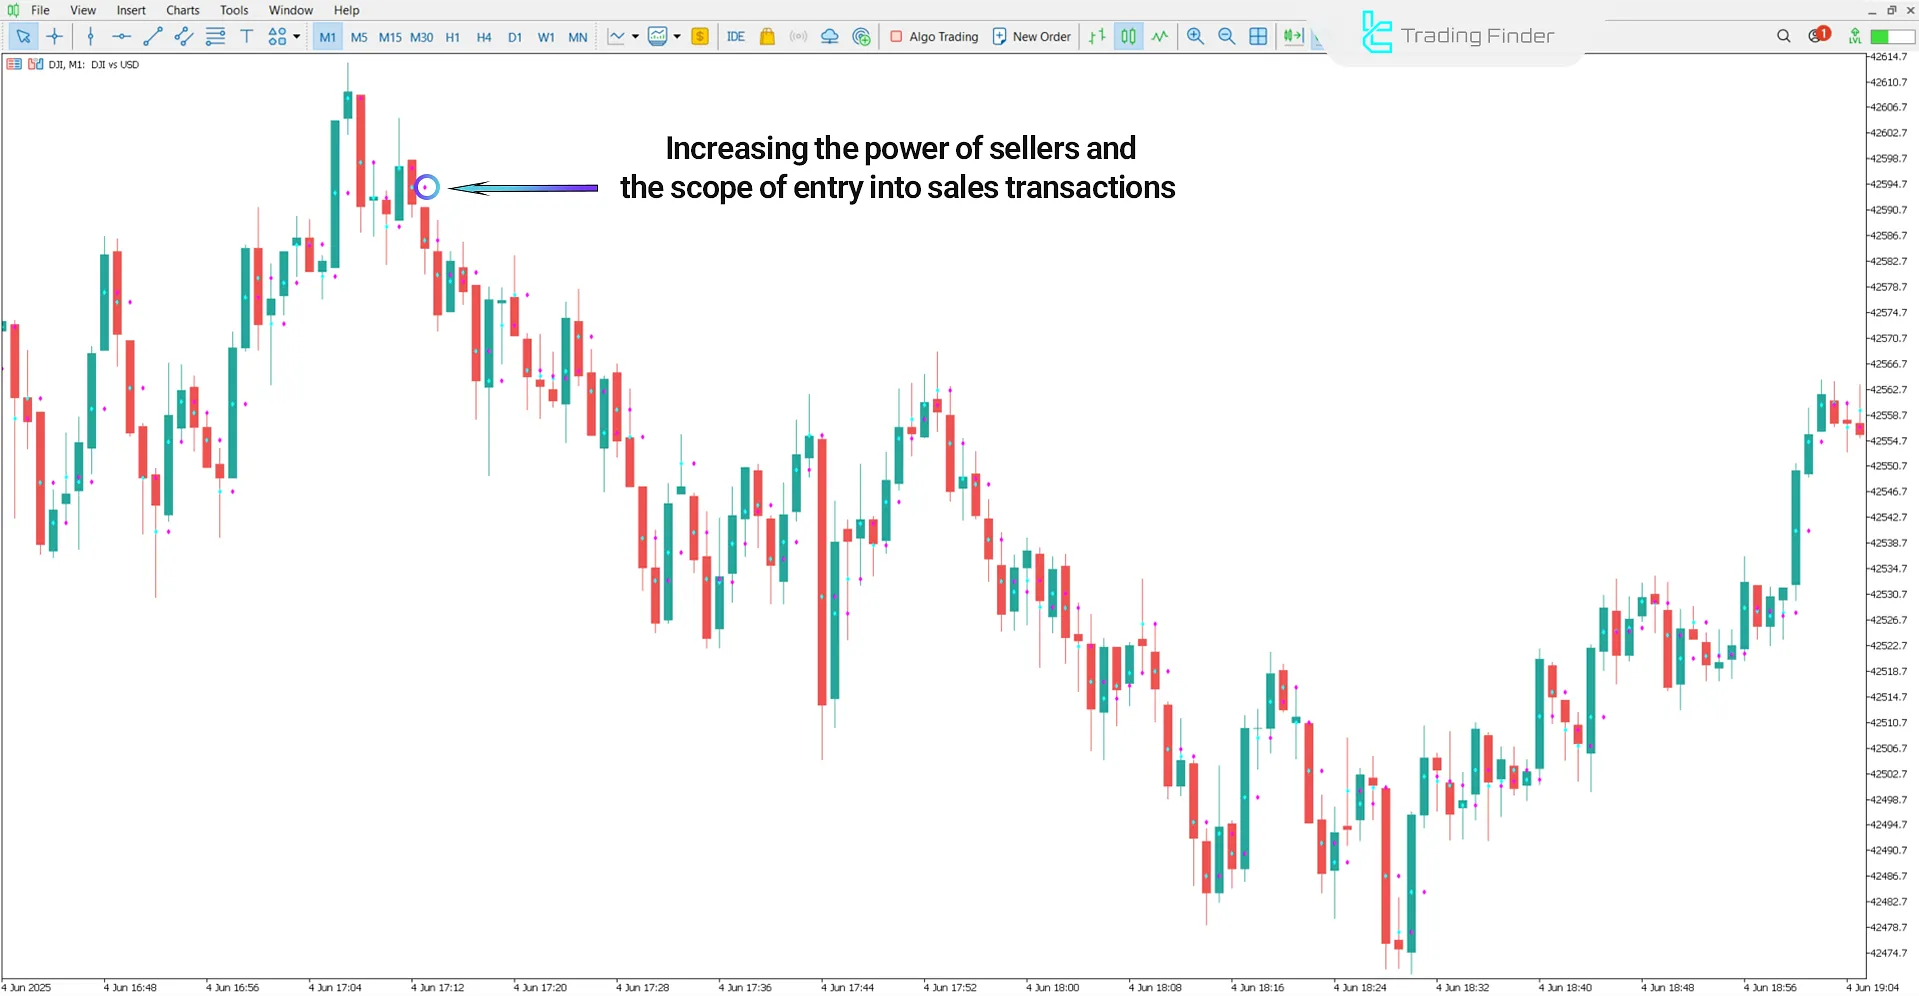
The chart below shows the Dow Jones Index (DJI) on a 1-minute timeframe. In this case, when the red midpoint is above the candle, it reflects selling pressure.
The price remains mostly in the lower half of the candle, which may signal a possible trend reversal from bullish to bearish.

TRO Midpoint Indicator Settings
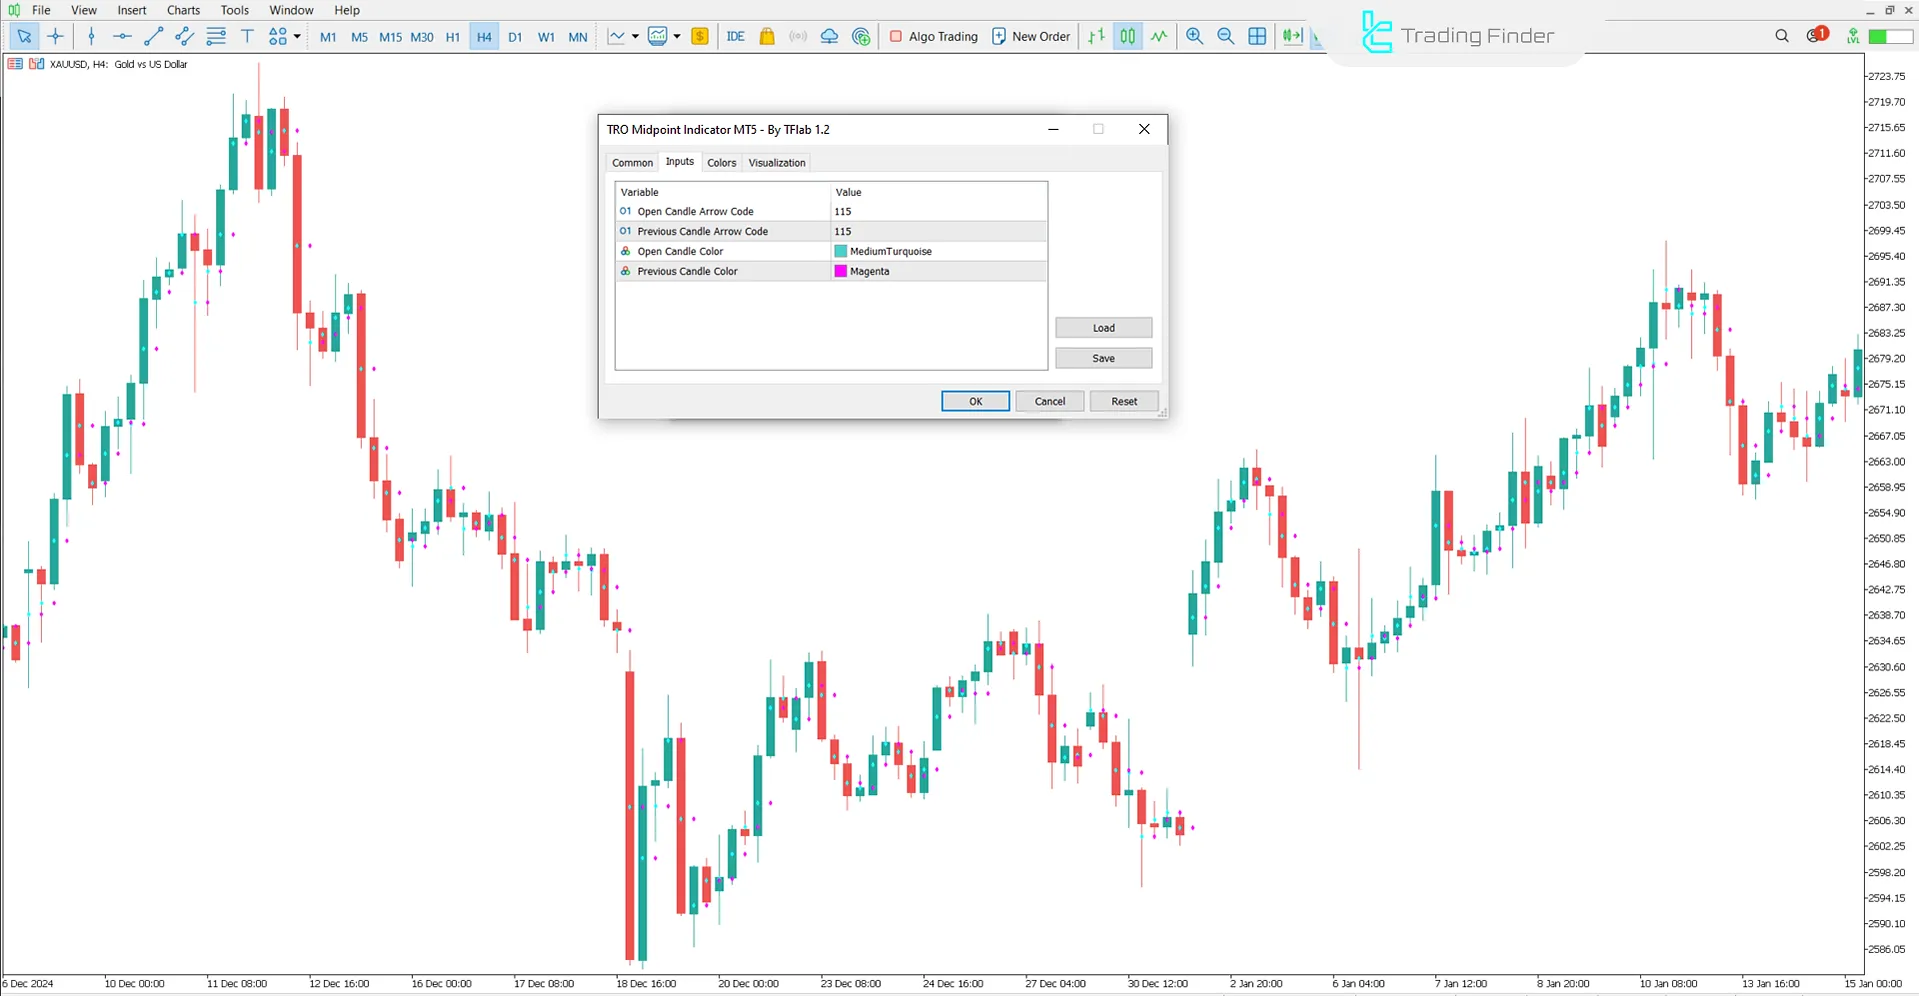
The following image shows the settings panel for the TRO Midpoint Indicator:

- Open Candle Arrow Code: arrow code for the current candle;
- Previous Candle Arrow Code: arrow code for the previous candle;
- Open Candle Color: color of the current candle;
- Previous Candle Color: color of the previous candle.
Conclusion
The TRO Midpoint Indicator is a price-based trading tool that displays the midpoints of the current and previous candles, enabling traders to analyze the structure of price movements.
It not only offers deeper insights into price action but also identifies key zones for entering buy or sell trades.
TRO Midpoint MT5 PDF
TRO Midpoint MT5 PDF
Click to download TRO Midpoint MT5 PDFIs the TRO Midpoint usable in all markets?
Yes. Due to its simple structure, this indicator performs effectively in forex, stocks, crypto, and other financial markets.
Does the TRO Midpoint use complex averages or statistical filters?
No. This indicator is designed purely based on raw price data, with no smoothing or statistical processing.


