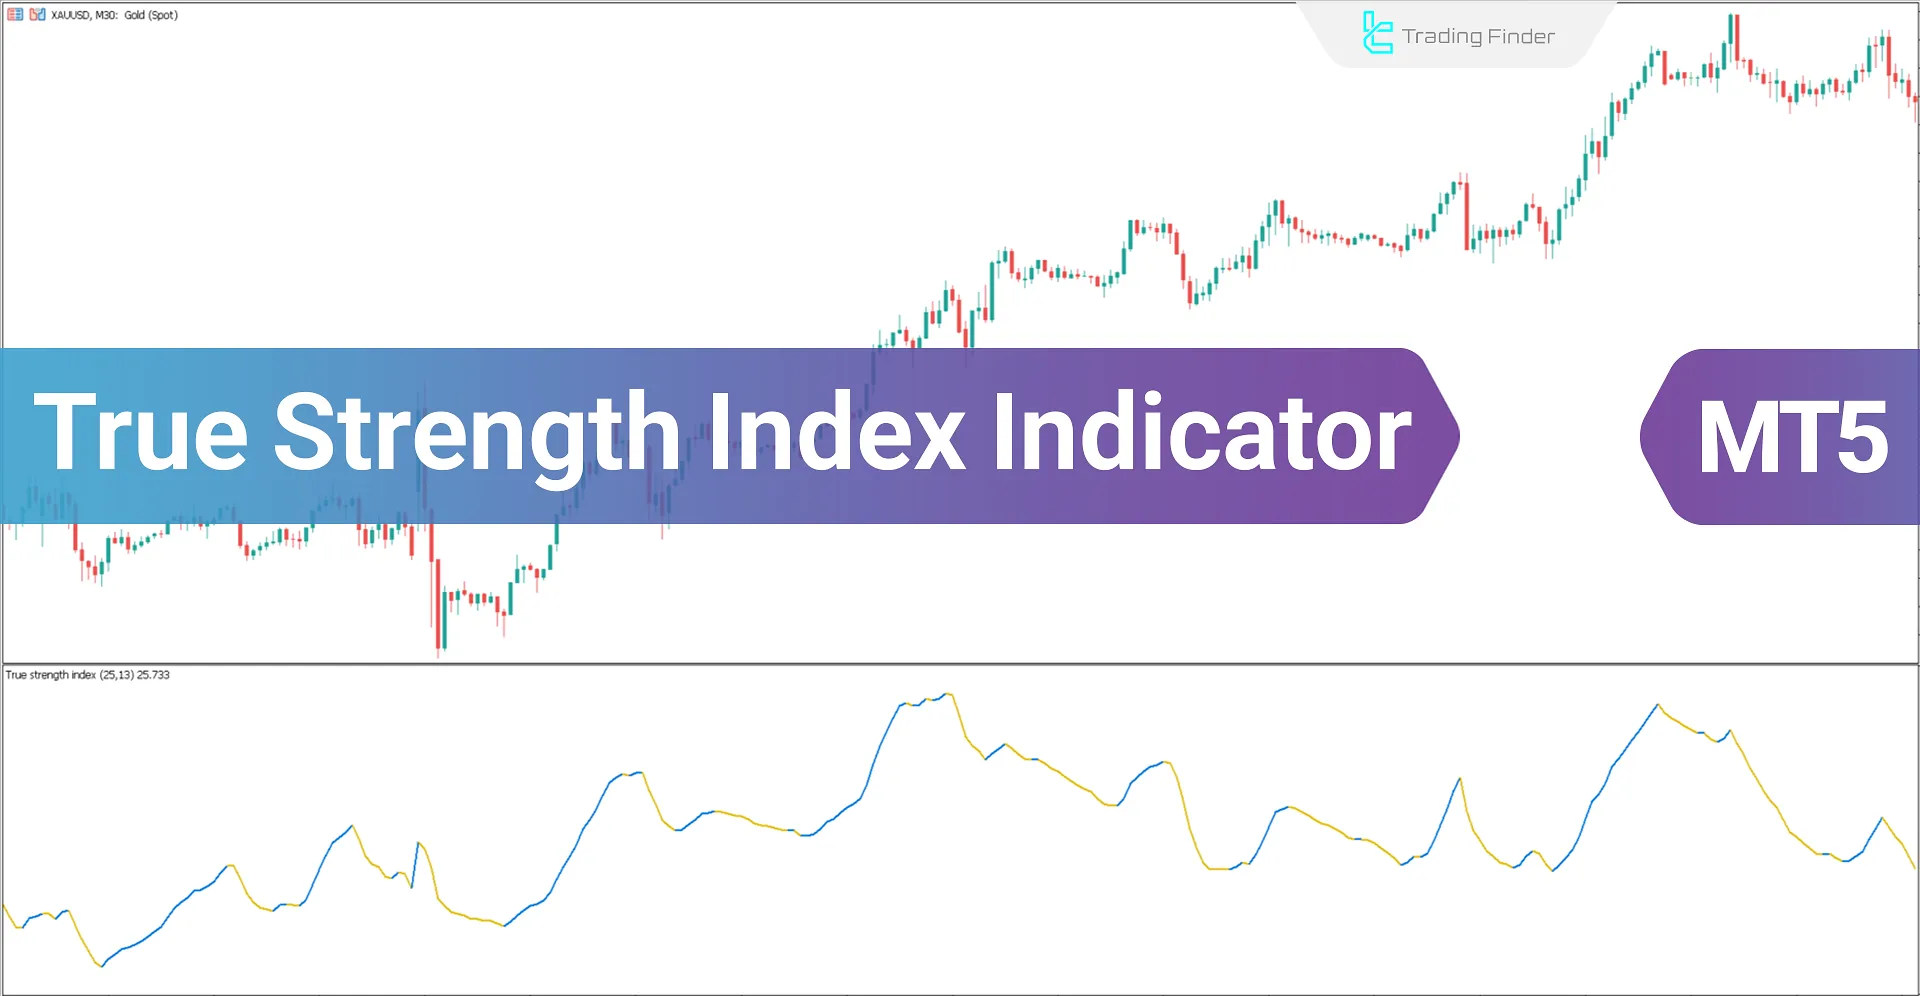

The True Strength Index (TSI) in MetaTrader 5 oscillator uses two moving averages (MA) to analyze movements and trend direction, providing traders with insights into significant reversal points and trend continuations.
The TSI oscillator is divided into two main sections by the zero level. When the curve is above this zero level, it indicates a bullish trend, while movements below the zero level signal a bearish trend.
Indicator Table
Indicator Categories: | Oscillators MT5 Indicators Signal & Forecast MT5 Indicators Currency Strength MT5 Indicators |
Platforms: | MetaTrader 5 Indicators |
Trading Skills: | Elementary |
Indicator Types: | Trend MT5 Indicators Lagging MT5 Indicators Reversal MT5 Indicators |
Timeframe: | Multi-Timeframe MT5 Indicators |
Trading Style: | Intraday MT5 Indicators Scalper MT5 Indicators Day Trading MT5 Indicators |
Trading Instruments: | Forex MT5 Indicators Crypto MT5 Indicators Stock MT5 Indicators Commodity MT5 Indicators Indices MT5 Indicators Share Stock MT5 Indicators |
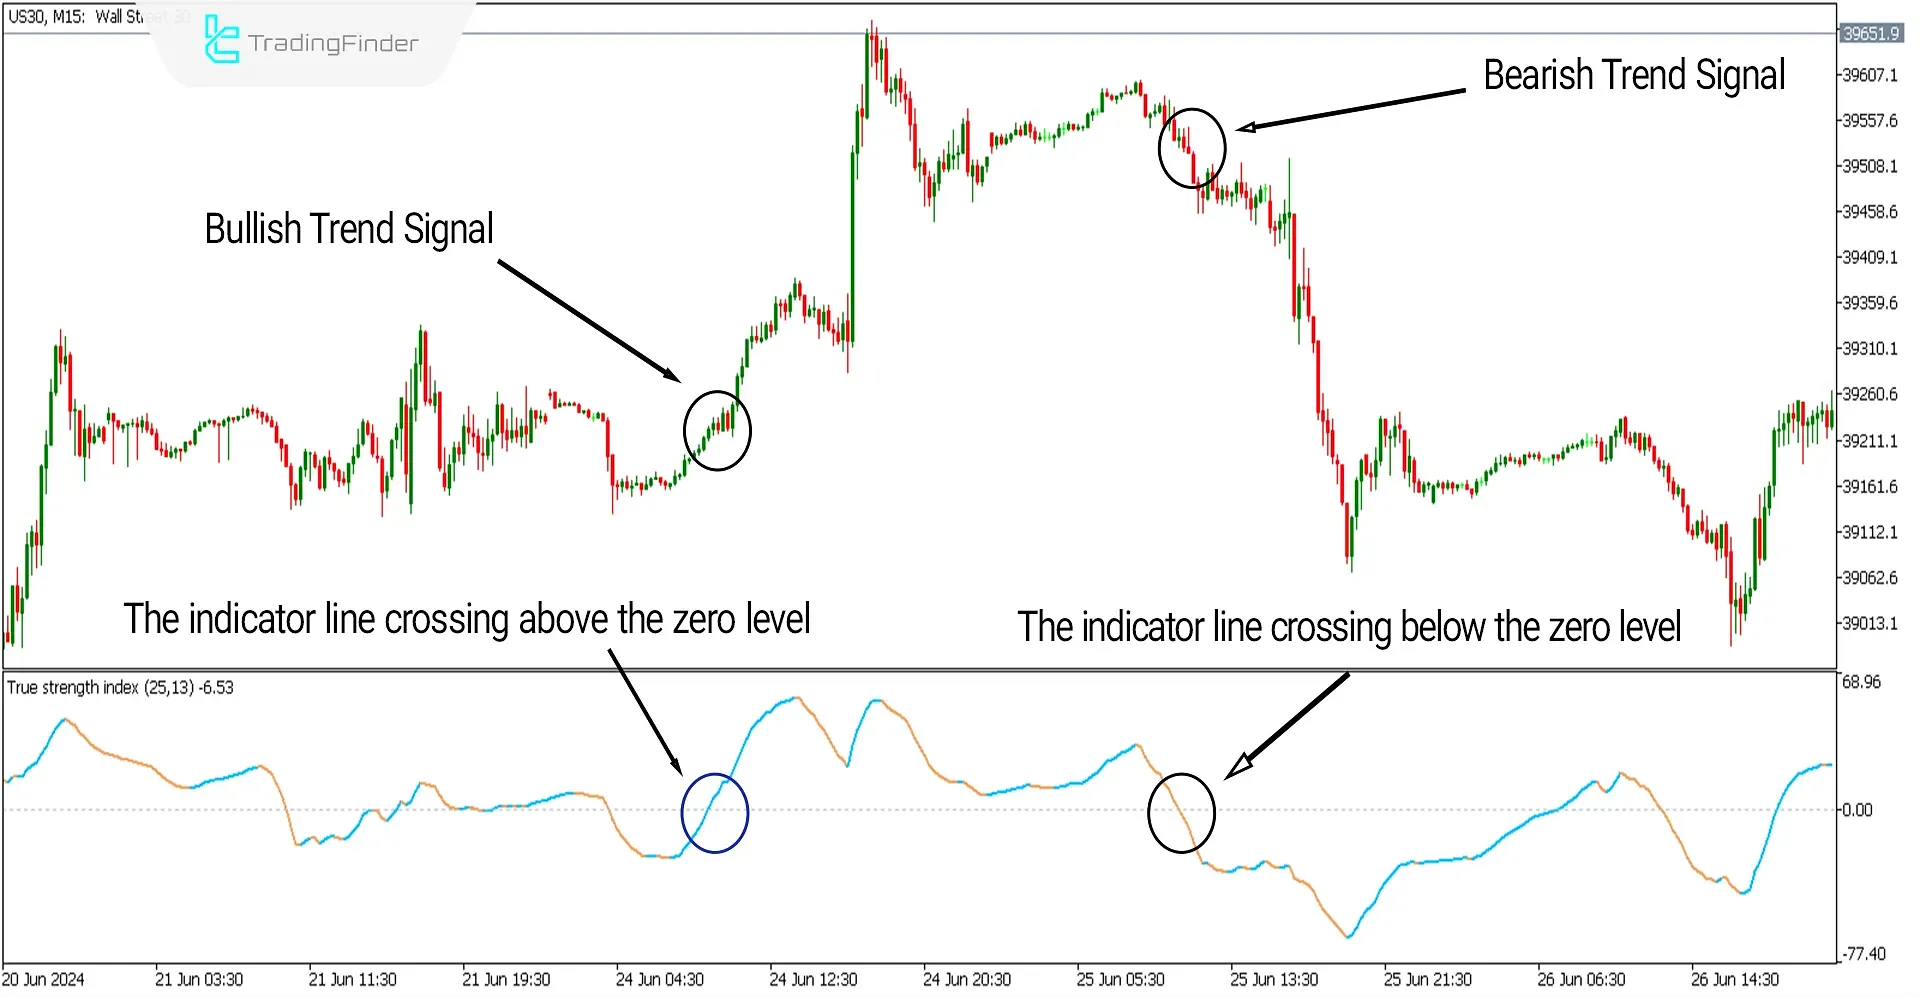
The image below shows the 15-minute chart of the Dow Jones Index [US30]. On the left side of the image, a bullish trend begins after forming a swing low. The indicator curve is blue and is positioned above the zero level, indicating the start of a bullish trend.
On the right side of the image, after the formation of a swing high, the TSI curve turns orange and moves below the zero level, signaling the start of a bearish trend.

Overview
Accurately identifying the trend and trading in its direction is crucial for trading strategies and should be given significant attention.
The True Strength Index, utilizing the 25-period and 13-period moving averages (MA 25, MA 13), helps forecast the direction of the price trend and can be used as a confirmation tool for trend direction alongside various analytical styles and trading strategies.
Uptrend Signals (Buy Positions)
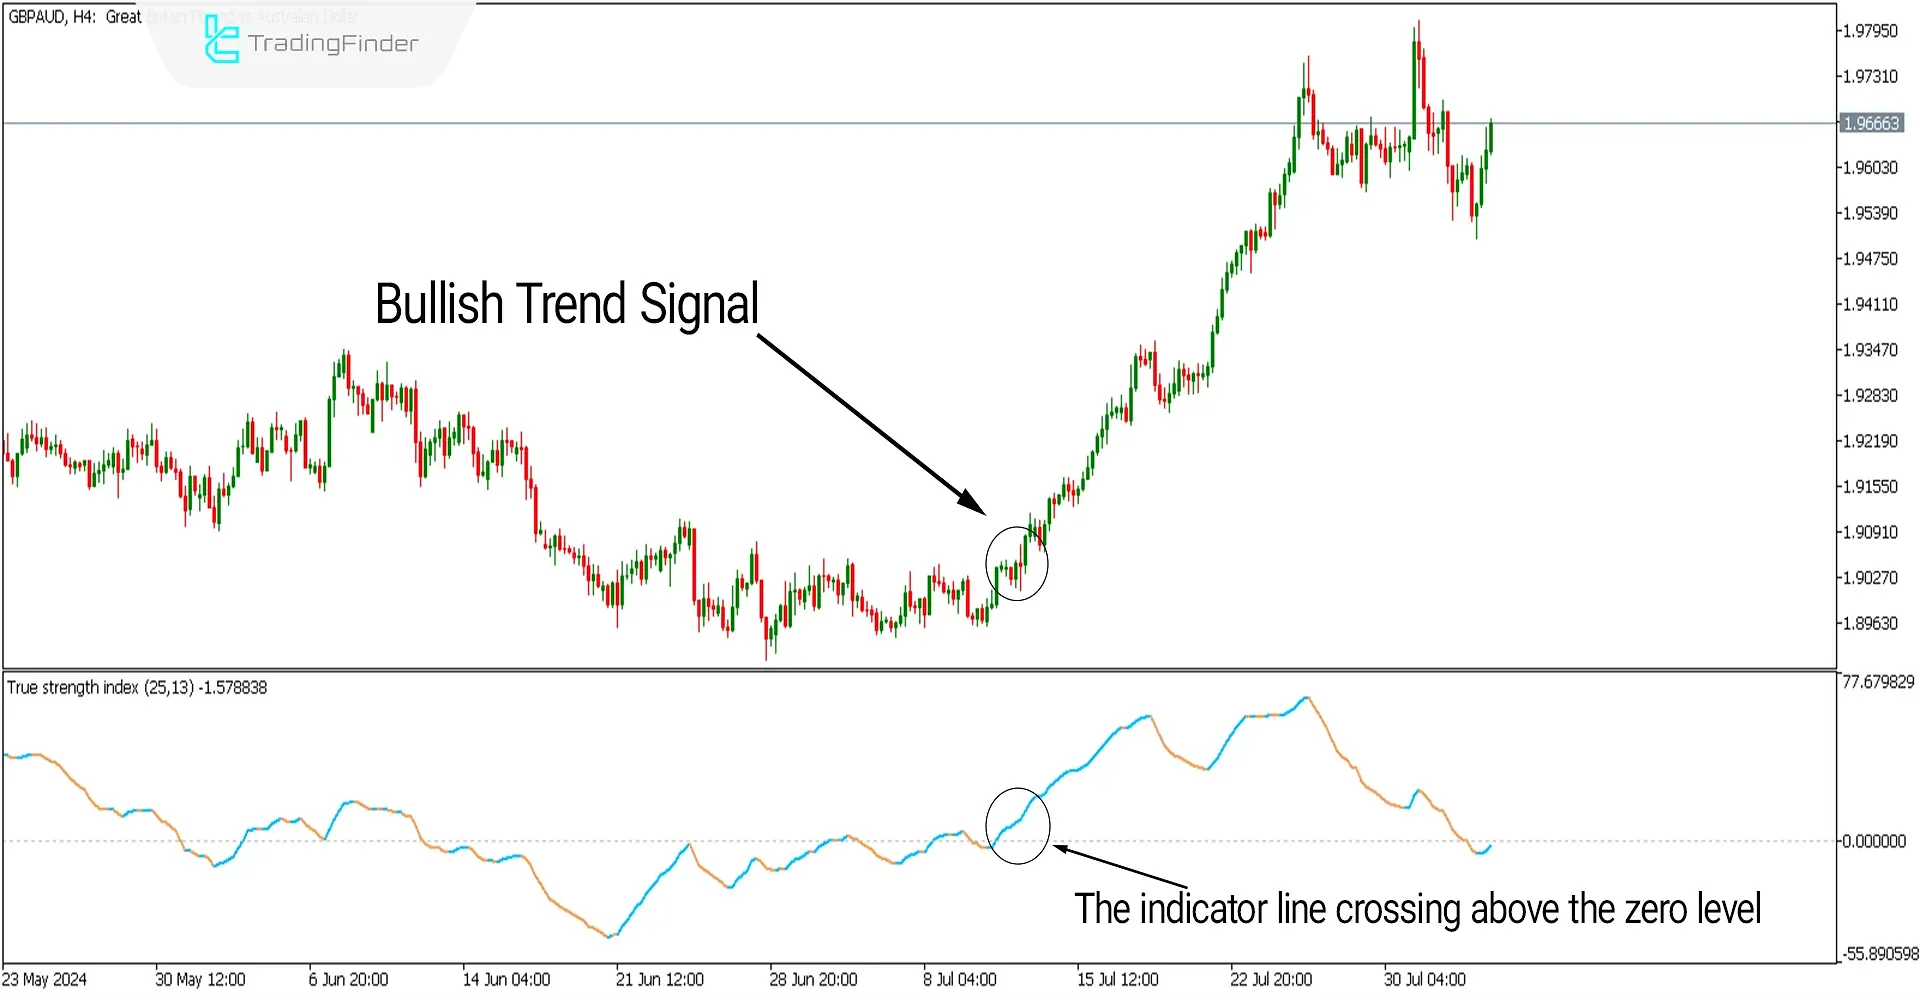
The image below shows the 4-hour chart of the GBP/AUD pair. The MT5 Signal and Forecast indicator curve has moved above the zero level and has turned blue, signaling the start of a bullish trend.
This condition can confirm the accurate identification of the upward trend direction and can be used as a confirmation in other trading strategies.

Downtrend Signals (Sell Positions)
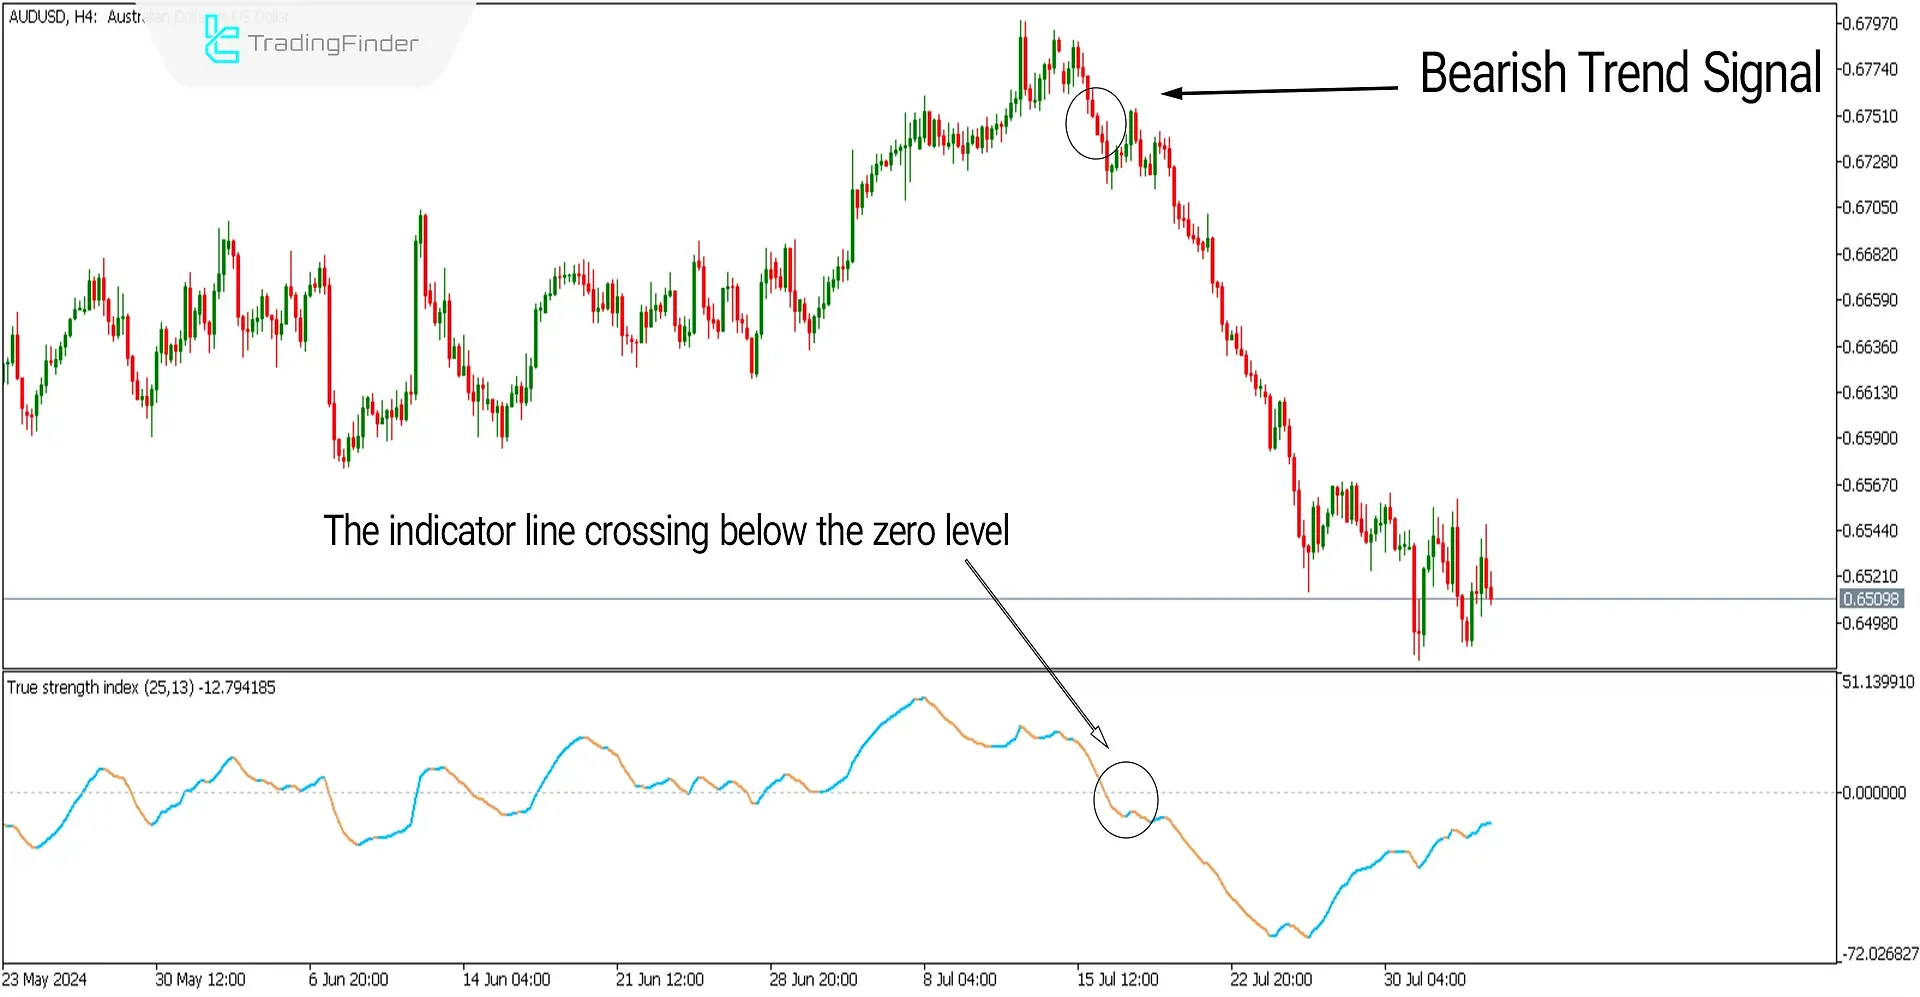
The image below shows the 4-hour chart of the AUD/USD pair. The indicator curve has moved above the zero level and has turned orange, signaling the start of a bearish trend.
This condition can confirm the accurate identification of the downward trend direction and can be used as a confirmation in other trading strategies.

Settings of the TSI Indicator
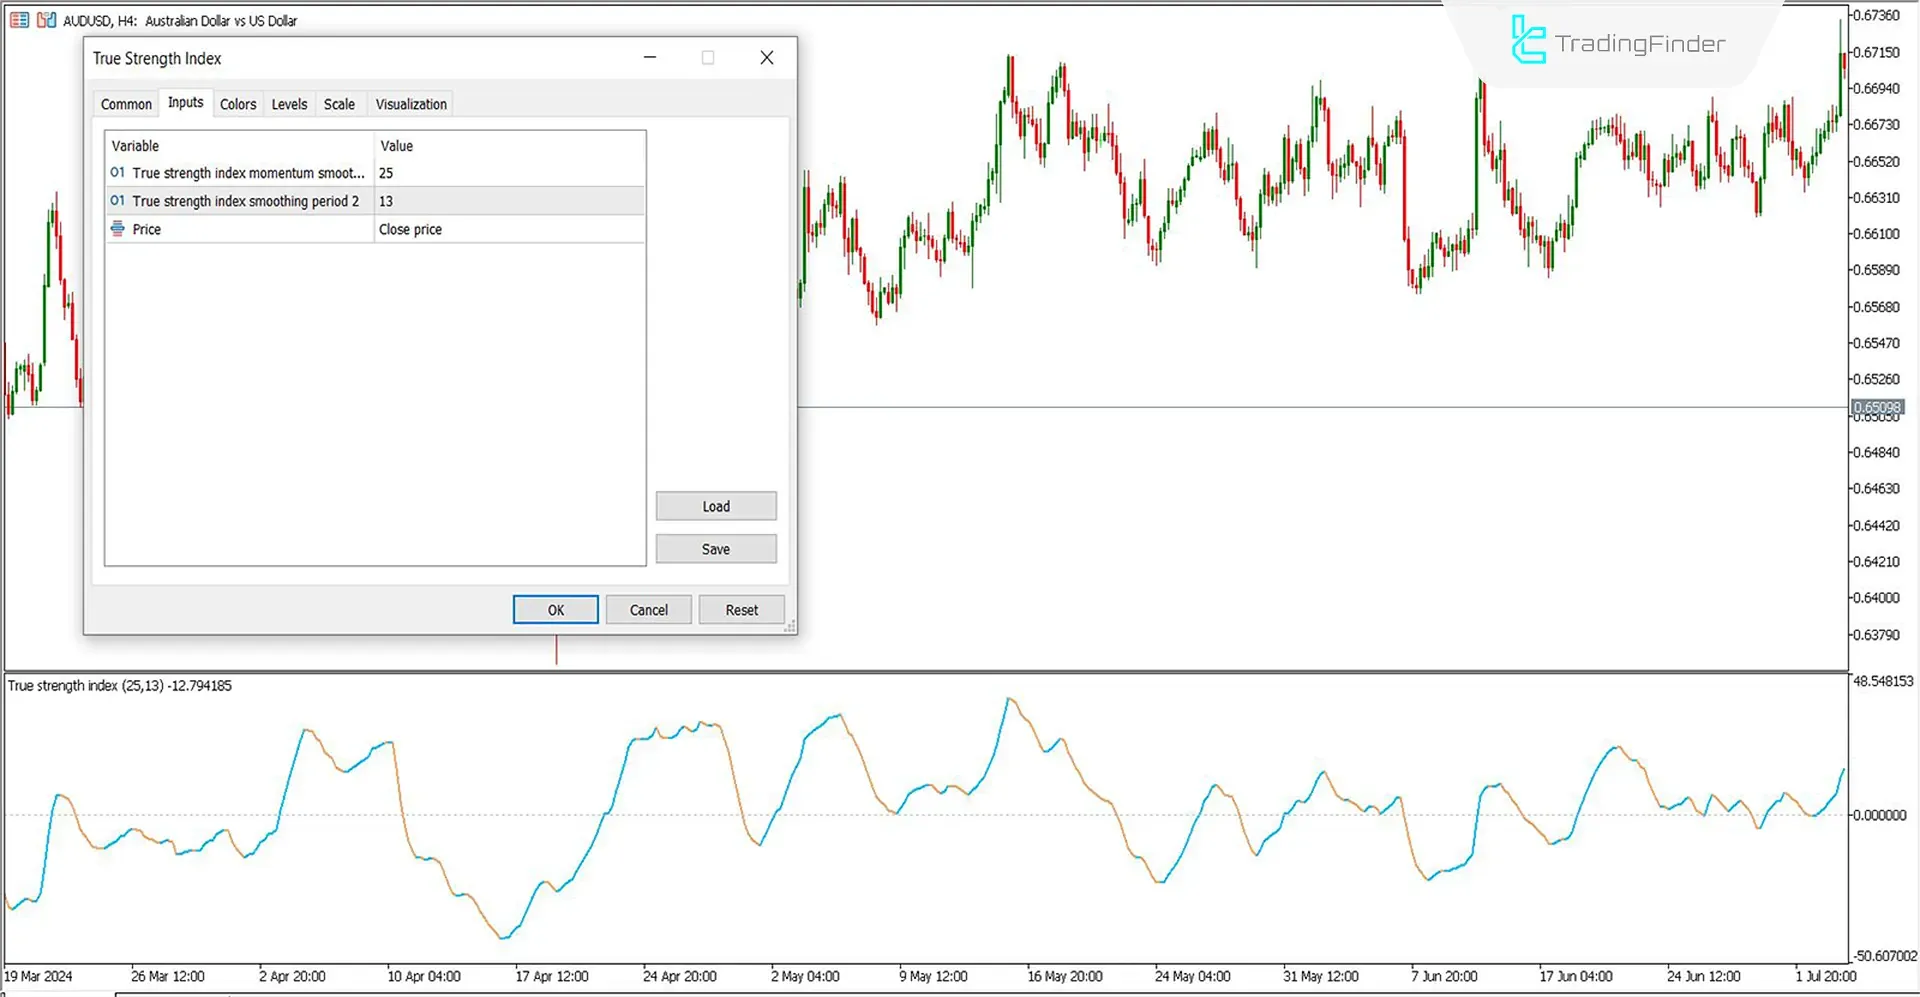
- True Strength Index momentum smoothing period: Use the slow-moving average (MA 25);
- True Strength Index smoothing period 2: Use the fast-moving average (MA 13);
- Price: [Close Price] — the closing price should be used for this setting.
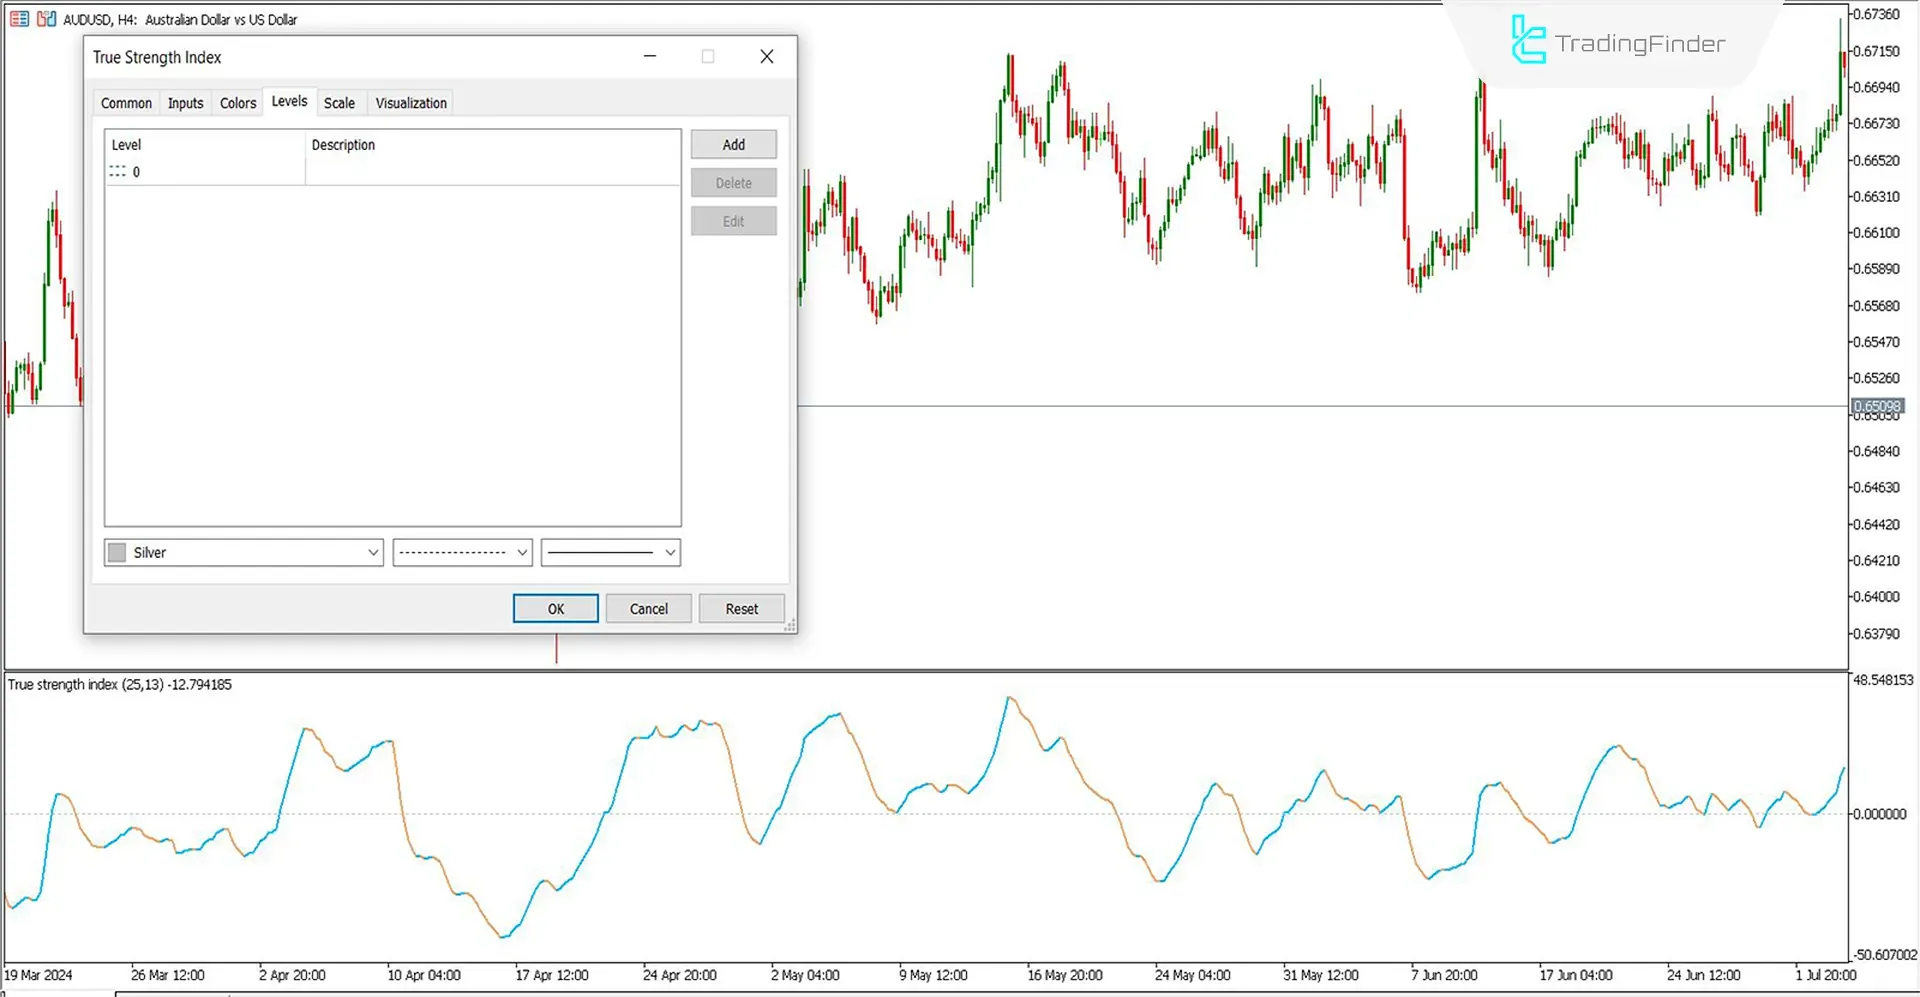
Note: To highlight the zero level of the indicator, as shown in the image below, you can use the (Add) option in the indicator settings under the (Level) section to add the zero level and choose the color according to your preference.
Conclusion
The TSI indicator can be used across all time frames and in trending markets such as Forex and stocks because it can assess accurate buy and sell signals and forecast the future direction of trends.
For beginners, it is advisable to start trading with TSI in conjunction with simple support-resistance and trend oscillators. Meanwhile, experienced traders can use it for trend confirmation in their strategies.
TSI MT5 PDF
TSI MT5 PDF
Click to download TSI MT5 PDFCan the TSI indicator be used in all market conditions?
No, this indicator works best in trending and volatile markets like Forex.
Can the True Strength Index (TSI) indicator be used alone for trading?
No, the TSI indicator might produce false signals, so it is recommended to use it in conjunction with other analytical tools, such as support-resistance oscillators, trend lines, and price channels, for better results.


