![TSV Bullish Bearish Oscillator for MT5 Download – Free – [TFlab]](https://cdn.tradingfinder.com/image/449975/13-146-en-tsv-bullish-bearish-mt5-01.webp)
![TSV Bullish Bearish Oscillator for MT5 Download – Free – [TFlab] 0](https://cdn.tradingfinder.com/image/449975/13-146-en-tsv-bullish-bearish-mt5-01.webp)
![TSV Bullish Bearish Oscillator for MT5 Download – Free – [TFlab] 1](https://cdn.tradingfinder.com/image/449978/13-146-en-tsv-bullish-bearish-mt5-02.webp)
![TSV Bullish Bearish Oscillator for MT5 Download – Free – [TFlab] 2](https://cdn.tradingfinder.com/image/449977/13-146-en-tsv-bullish-bearish-mt5-03.webp)
![TSV Bullish Bearish Oscillator for MT5 Download – Free – [TFlab] 3](https://cdn.tradingfinder.com/image/449976/13-146-en-tsv-bullish-bearish-mt5-04.webp)
The TSV Bullish Bearish Indicator is recognized as one of the tools used to determine trend direction in technical analysis.This indicator operates based on the analysis of trading volume over different timeframes, and its output is displayed as colorc oded histograms in a separate window.
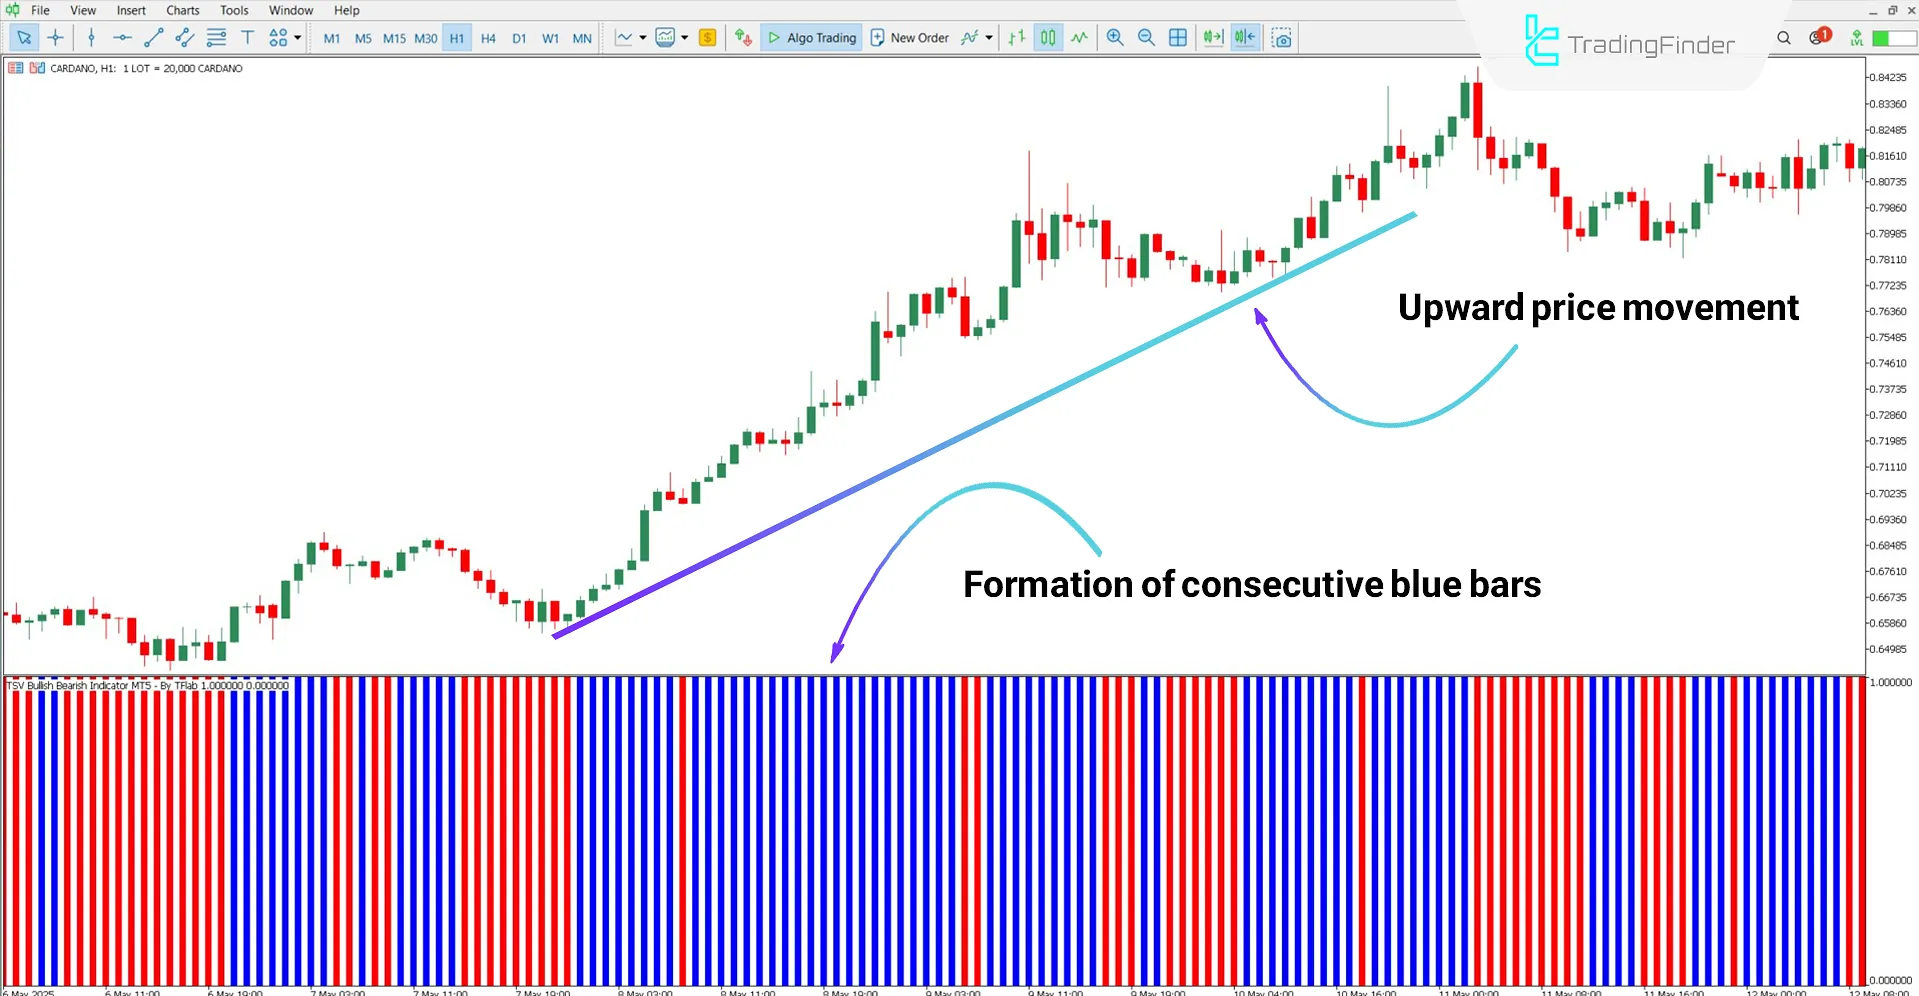
In this graphical display, blue bars indicate buying pressure or a bullish trend, while red bars represent selling pressure or a bearish market bias.
TSV Bullish Bearish Oscillator Specifications Table
The features of the TSV Bullish Bearish Indicator are detailed in the table below:
Indicator Categories: | Volume MT5 Indicators Trading Assist MT5 Indicators Oscillators Tradingview Indicators |
Platforms: | MetaTrader 5 Indicators |
Trading Skills: | Elementary |
Indicator Types: | Reversal MT5 Indicators |
Timeframe: | Multi-Timeframe MT5 Indicators |
Trading Style: | Swing Trading MT5 Indicators Scalper MT5 Indicators Day Trading MT5 Indicators |
Trading Instruments: | Forex MT5 Indicators Crypto MT5 Indicators Stock MT5 Indicators Commodity MT5 Indicators Indices MT5 Indicators Share Stock MT5 Indicators |
TSV Bullish Bearish Indicator at a Glance
The TSV Bullish Bearish Oscillator provides entry signals for buy or sell positions through changes in the histogram colors.
When the first bar with a different color than the previous direction appears on the chart, it can be interpreted as a signal to open a position in the direction of the new color.
Bullish Trend Identification
Based on the Cardano (ADA) chart in the 1-hour timeframe, observing several consecutive blue bars in the indicator reflects the market's inclination to continue its uptrend.
In such conditions, the entry point can be considered where the bar color changes from red to blue.

Bearish Trend Identification
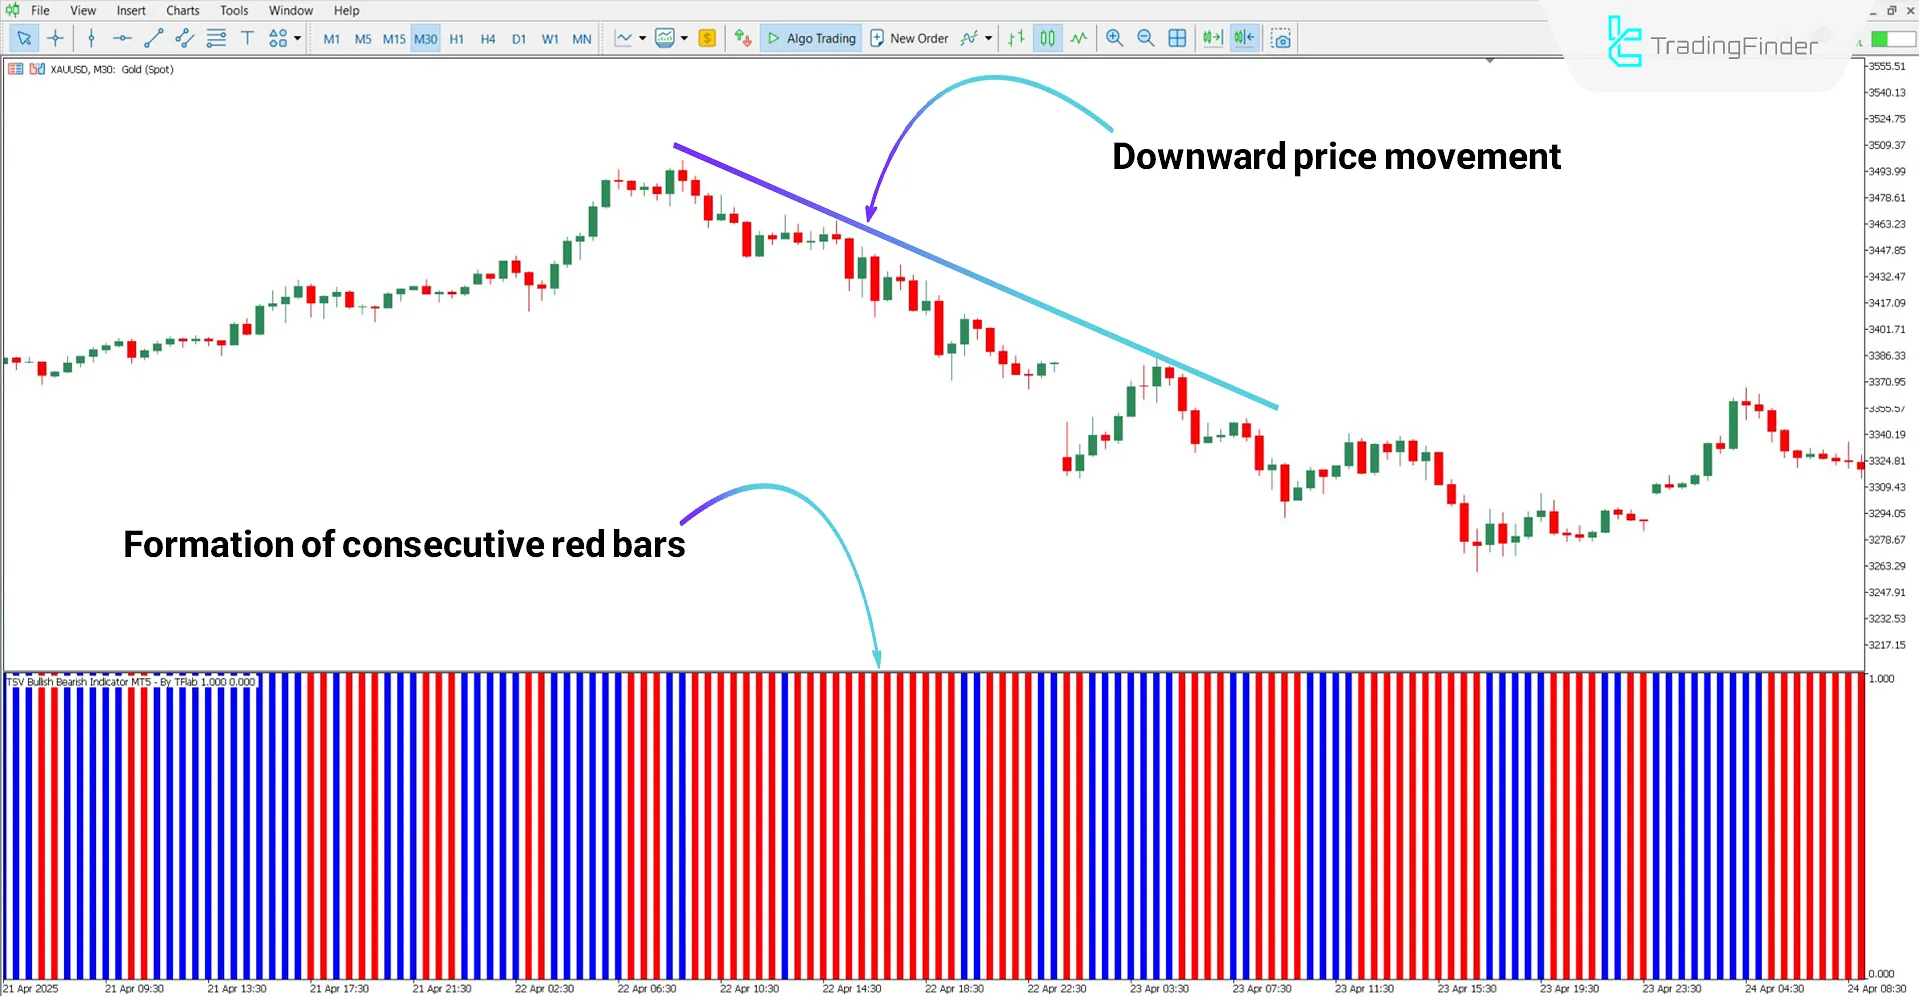
According to the XAU/USD (Gold vs USD) chart analysis in the 3 minute timeframe, a color change from blue to red in the histogram can be a signal for entering a sell position.
Repeated red bars in this indicator indicate the strength and persistence of the bearish trend in the market.

TSV Bullish Bearish Oscillator Settings
Settings for the TSV Bullish Bearish Indicator are as follows:

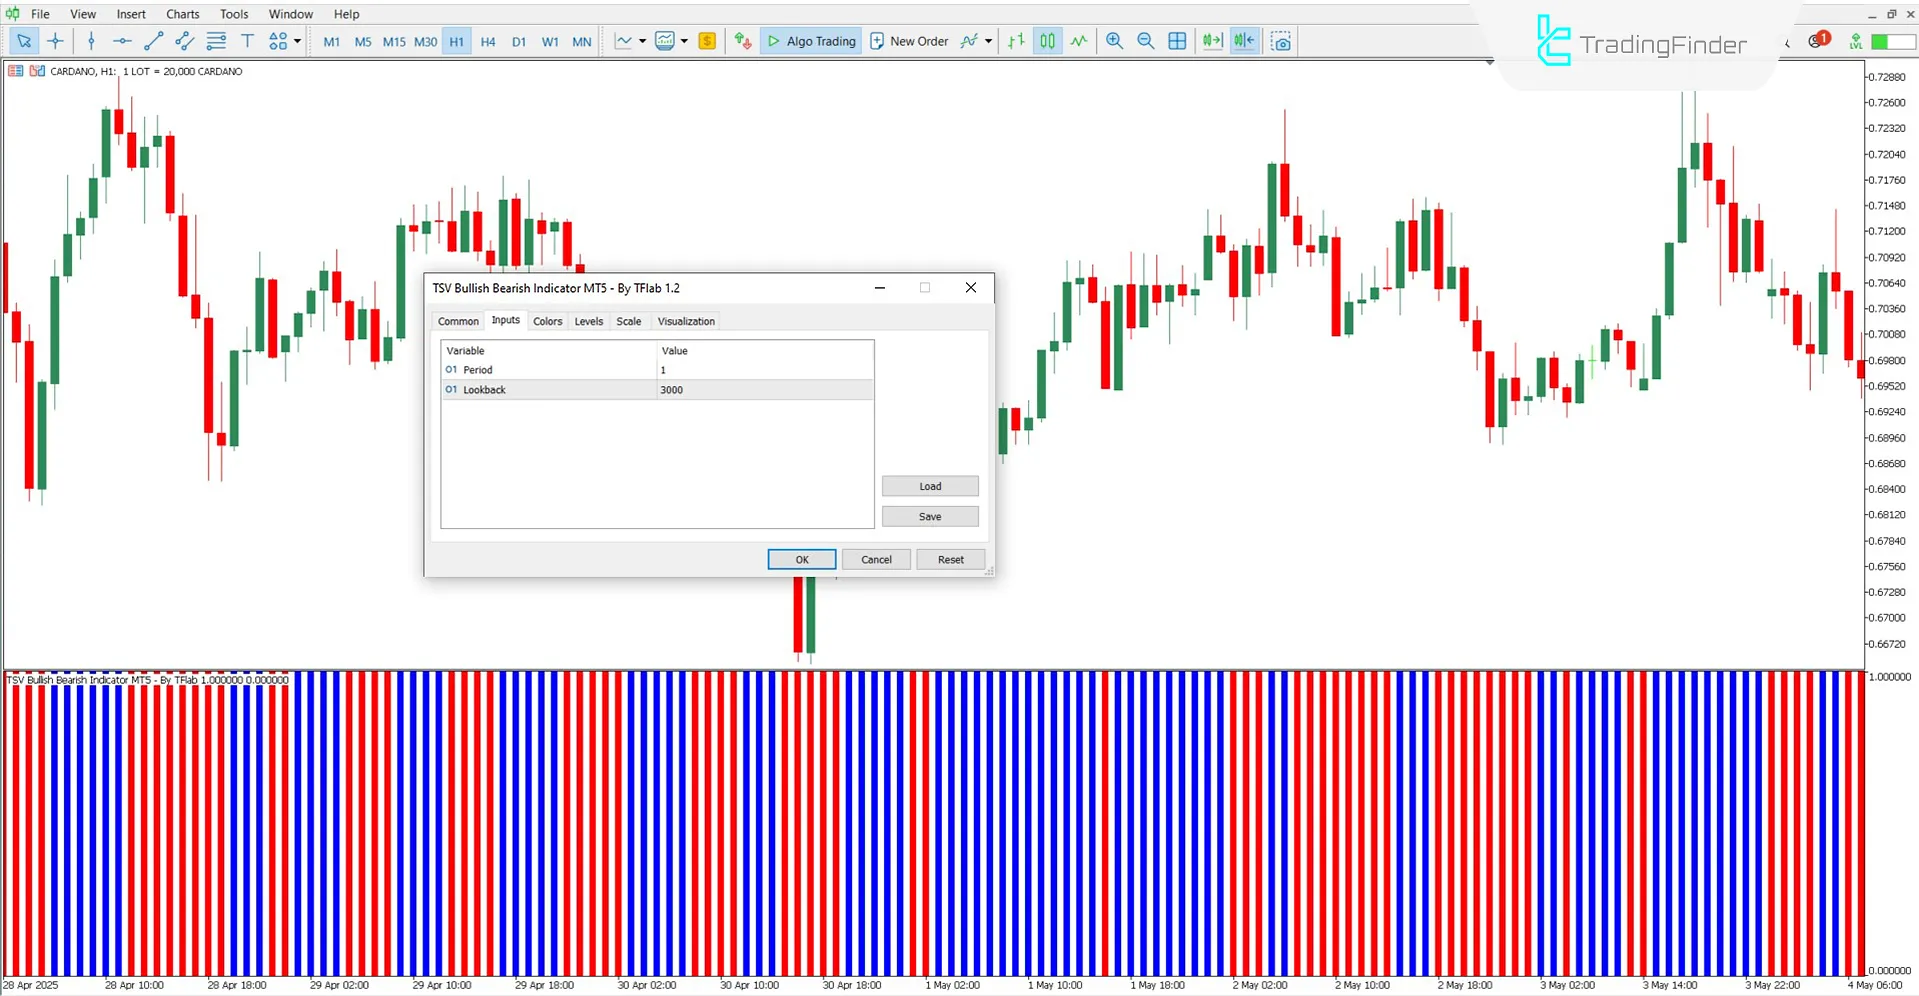
- Period: The calculation period of the indicator
- Lookback: Number of previous candles used in the indicator’s calculations
Conclusion
The TSV Bullish Bearish Oscillator is a simple yet effective tool for determining market trend direction, operating on the combination of trading volume and price volatility across specific timeframes.
Using color-coded bars, this indicator not only reflects market direction but also clearly shows the intensity of buying or selling pressure.
This analytical tool is applicable across a wide range of markets, including Forex, cryptocurrencies, stock indices, and commodities.
TSV Bullish Bearish Oscillator MT5 PDF
TSV Bullish Bearish Oscillator MT5 PDF
Click to download TSV Bullish Bearish Oscillator MT5 PDFWhat is the main purpose of this indicator?
The primary use of the TSV Bullish Bearish Oscillator is to identify the beginning and end of bullish or bearish trends.
Is the TSV Bullish Bearish Indicator suitable for scalping?
Yes, this indicator is suitable for all trading styles, including scalping.


