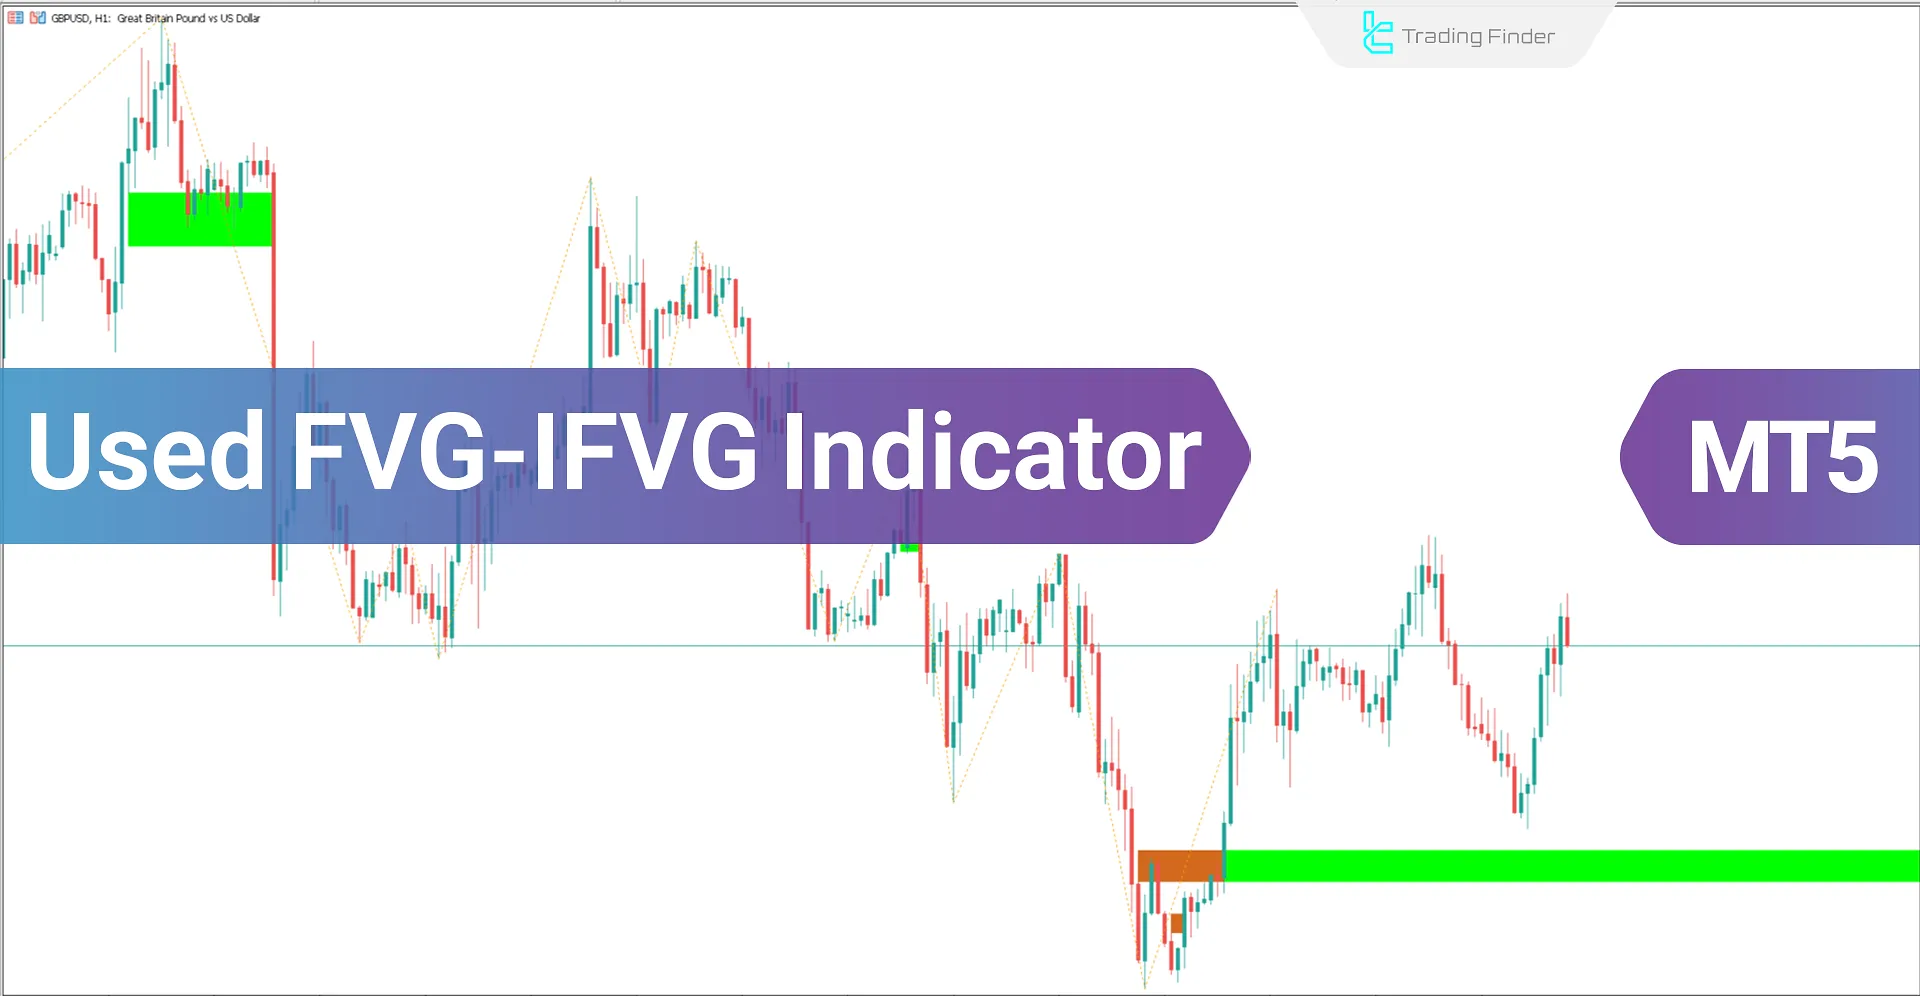


The Used Fair Value Gap (Used FVG-iFVG) indicator is an advanced and practical tool for ICT-styleand Smart Money-style traders designed for the MetaTrader 5 (MT5) platform. This indicator identifies and draws market imbalance zones (FVG), showing key supply and demand areas. Bullish FVG zones are marked in green, and bearish FVG zones in brown.
When the price returns to these areas, the indicator automatically displays the consumption of the imbalance by gradually narrowing the rectangular zones. This feature helps traders better identify key areas and make more informed decisions about entering or exiting trades.
The Used FVG-iFVG indicator plays a crucial role in determining supply and demand strength and potential price reversals in imbalance zones, which are key characteristics of ICT and Smart Money trading styles.
Used FVG-IFVG Indicator Table
Indicator Categories: | Smart Money MT5 Indicators Supply & Demand MT5 Indicators Currency Strength MT5 Indicators ICT MT5 Indicators |
Platforms: | MetaTrader 5 Indicators |
Trading Skills: | Advanced |
Indicator Types: | Leading MT5 Indicators Reversal MT5 Indicators |
Timeframe: | Multi-Timeframe MT5 Indicators |
Trading Style: | Intraday MT5 Indicators Scalper MT5 Indicators Day Trading MT5 Indicators |
Trading Instruments: | Forex MT5 Indicators Crypto MT5 Indicators Indices MT5 Indicators |
Indicator at a Glance
The Used Fair Value Gap (Used FVG-IFVG) Indicator simplifies the identification of FVG and IFVG zones by marking these areas on the chart with a box. Traders can easily recognize these zones using the indicator.
It highlights bullish FVG and IFVG areas in green and bearish zones in brown, providing valuable assistance to traders in their analysis.
FVG Identification

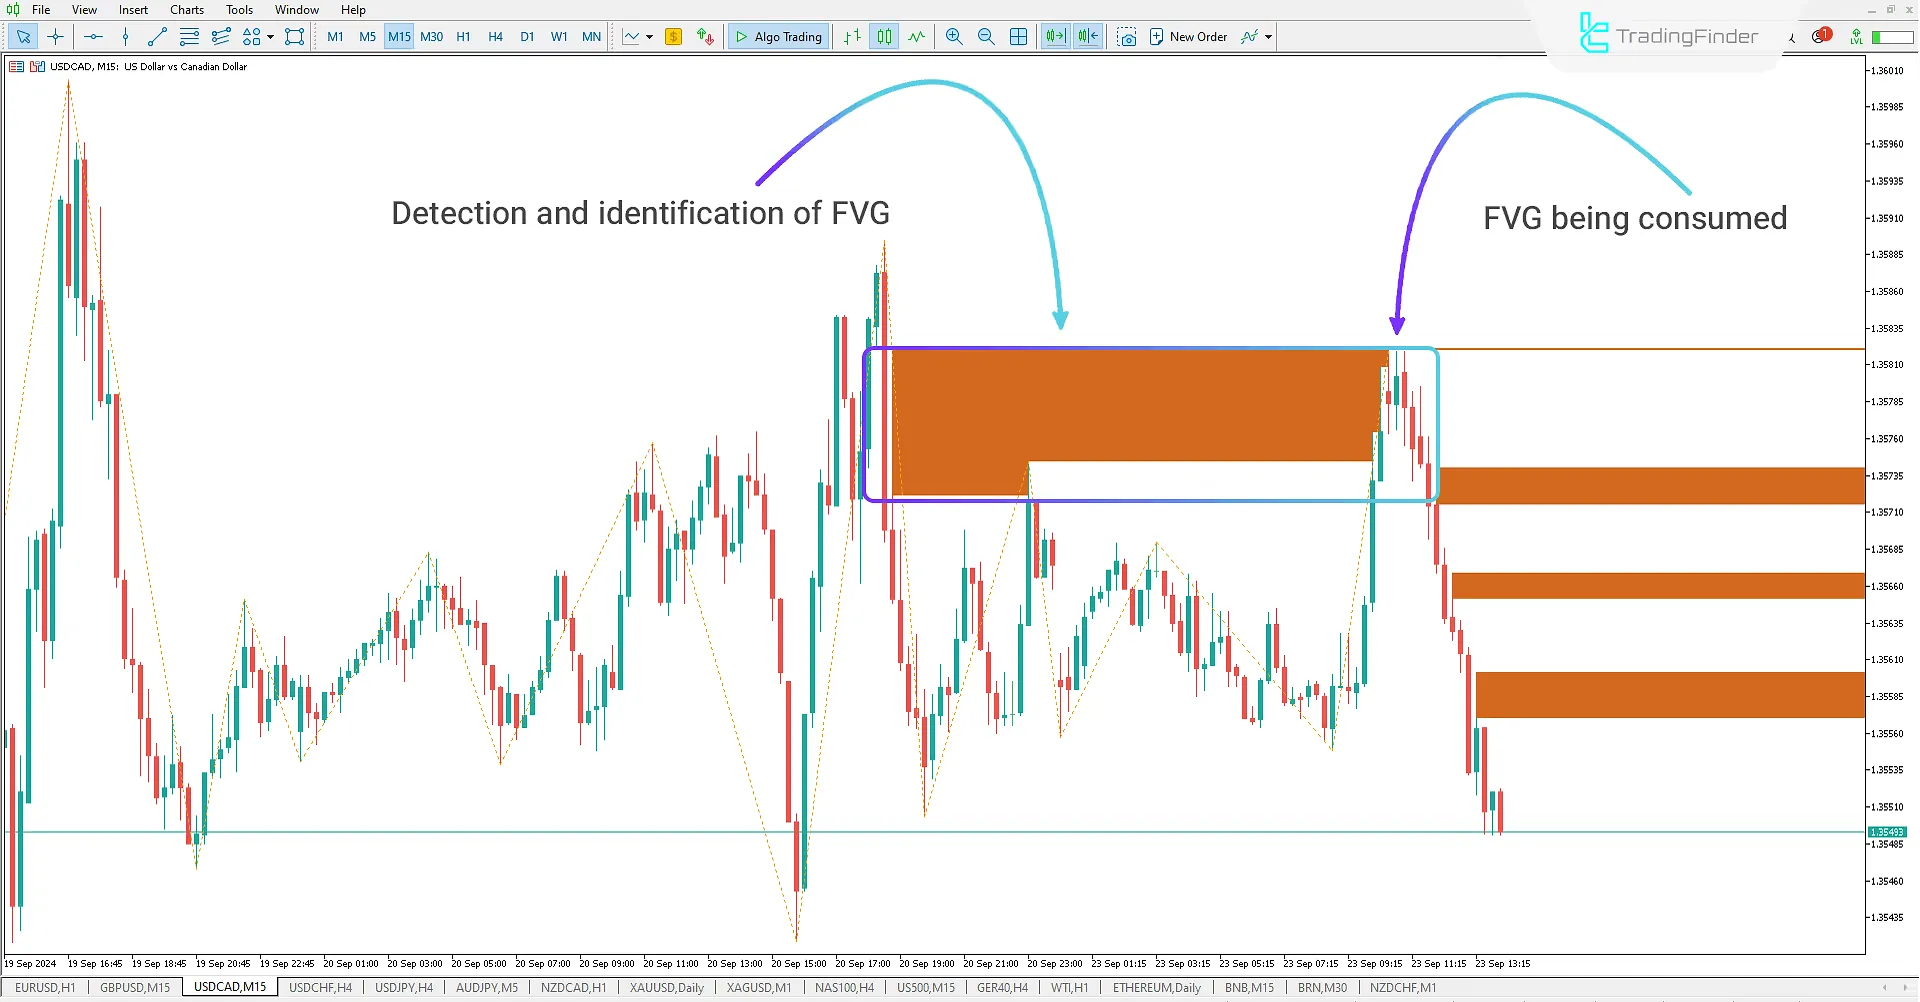
The 15-minute USD/CAD chart, the Used FVG-iFVG indicator identifies and displays bearish FVG zones as orange rectangles. When the price returns to these FVG zones, the consumption process of this imbalance begins. The indicator automatically shows the consumption of these areas by gradually narrowing the rectangles, providing traders with a visual representation of the consumption process. This feature helps ICT and Smart Money traders accurately identify key entry and exit points and better use imbalance zones.
iFVG Identification

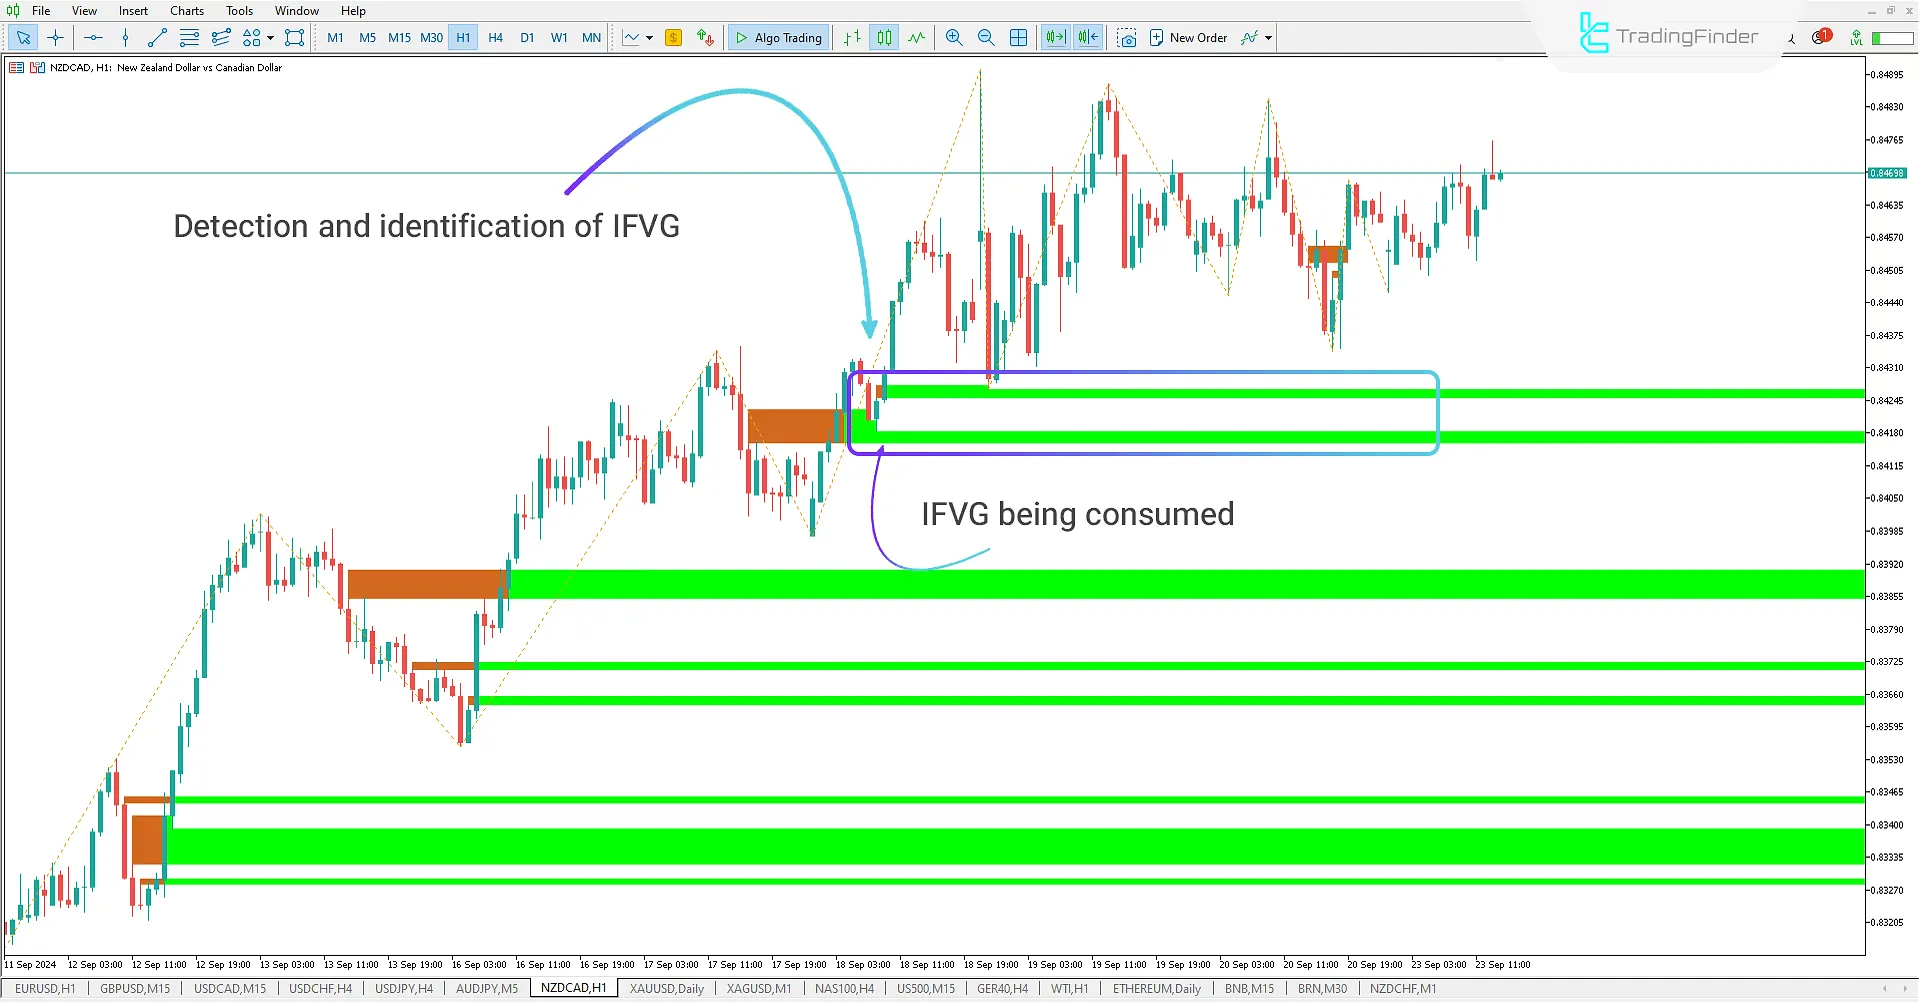
In the 1-hour NZD/CAD chart, the Used FVG-iFVG indicator identifies and displays bullish iFVG zones in green, helping traders recognize imbalance zones. The indicator marks FVG zones in brown and later converts them into green iFVG zones, notifying traders of critical price areas that could cause a reversal.
As the price returns to these areas, the consumption process begins, and the indicator narrows the imbalance rectangles, showing the amount consumed. This visual feature allows ICT and Smart Money traders to track imbalance and price changes more effectively and make better trading decisions.
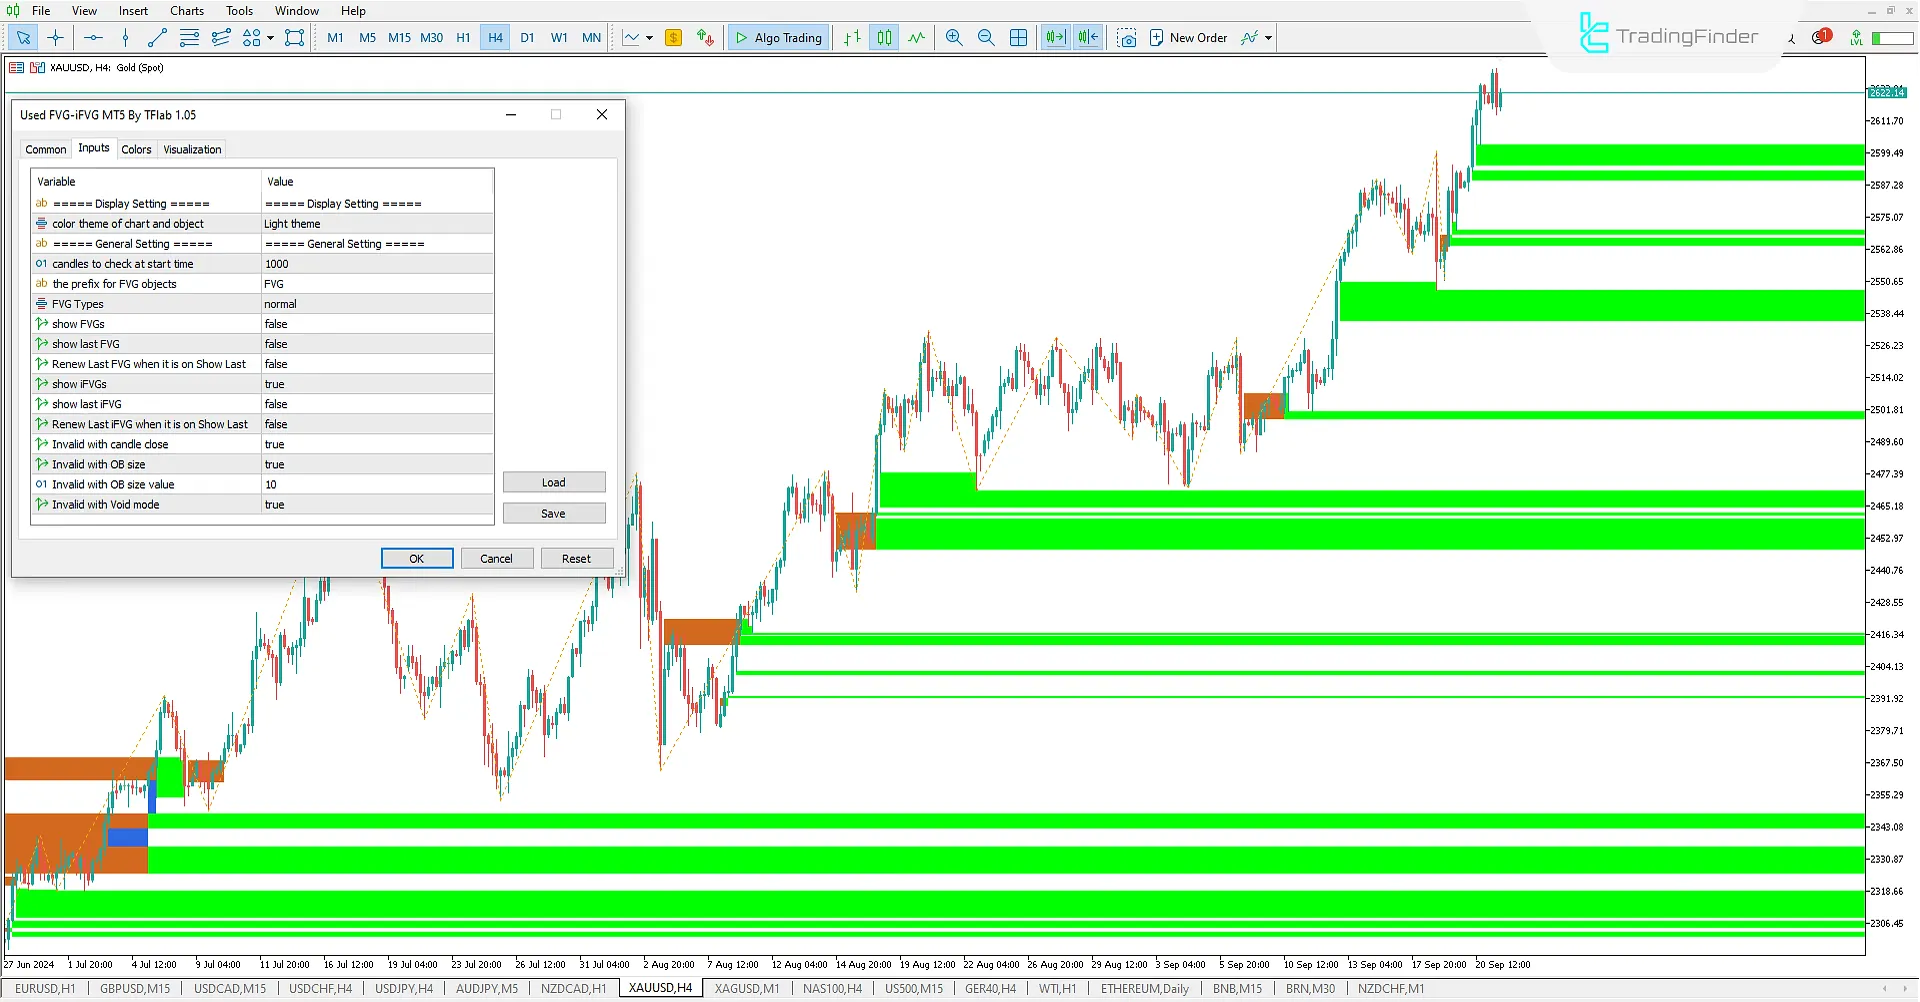
Used FVG-iFVG Indicator Settings 4-hour XAUUSD chart
Display Setting: Display settings selection
- Color theme of chart and object: Choose the chart theme.
General Setting: General settings
- Candles to check at start time: Select the number of candles to check in the past.
- FVG Types: Choose FVG drawing types from 6 models: Normal, Very Aggressive, Aggressive, Defensive, Very Defensive, or The furthest FVG or the first FVG in the same trend.
- Show FVGs: Enable/turn off the display of FVG.
- Show last FVG: Enable/turn off the display of the last FVG.
- Renew last FVG when it is on show last: When a new FVG forms, the last FVG is removed, and the new zone is considered the last FVG.
- Show iFVGs: Enable/turn off the display of iFVG.
- Show last iFVG: Enable/turn off the display of the last iFVG.
- Renew the last iFVG when it is on show last: When a new iFVG forms, the last iFVG is removed, and the new zone is considered the last iFVG.
- Invalid with candle close: Invalidate with the closing candle.
- Invalid with OB size: Invalidate based on the order block size.
- Invalid with OB size value: Invalidate based on the order block size value.
- Invalid with Void mode: Invalidate with the void mode.
Conclusion
The Used Fair Value Gap (Used FVG-iFVG) indicator, with green rectangles for bullish imbalances (FVG) and brown rectangles for bearish imbalances (iFVG), helps traders easily identify FVG and iFVG zones on the chart without manual searching. When the price returns to these potential areas, the indicator gradually narrows the rectangles to show the consumption of the imbalance.
This feature allows ICT and Smart Money traders to carefully monitor the consumption of these zones and make better-informed trading decisions based on market changes.
Used Fair Value Gap MT5 PDF
Used Fair Value Gap MT5 PDF
Click to download Used Fair Value Gap MT5 PDFHow does the Used FVG-iFVG Indicator help identify FVG and iFVG zones?
This indicator automatically draws bullish imbalances (FVG) as green rectangles and bearish imbalances (iFVG) as brown rectangles on the chart, allowing traders to identify these zones without manual searching.
How does the indicator show that an FVG or iFVG zone has been consumed?
As the price returns to the FVG & iFVG zones, the rectangles gradually narrow, indicating that the imbalance is being consumed. Eventually, the rectangle is removed from the chart once the imbalance has been fully consumed.
Why doesn't it shows fvg on H4 & daily time frame?
it works correctly


