![Val Bands V3 Oscillator for MetaTrader 5 Download – Free – [TFlab]](https://cdn.tradingfinder.com/image/451803/13-151-en-val-bands-v3-indicator-mt5-01.webp)
![Val Bands V3 Oscillator for MetaTrader 5 Download – Free – [TFlab] 0](https://cdn.tradingfinder.com/image/451803/13-151-en-val-bands-v3-indicator-mt5-01.webp)
![Val Bands V3 Oscillator for MetaTrader 5 Download – Free – [TFlab] 1](https://cdn.tradingfinder.com/image/451802/13-151-en-val-bands-v3-indicator-mt5-02.webp)
![Val Bands V3 Oscillator for MetaTrader 5 Download – Free – [TFlab] 2](https://cdn.tradingfinder.com/image/451804/13-151-en-val-bands-v3-indicator-mt5-03.webp)
![Val Bands V3 Oscillator for MetaTrader 5 Download – Free – [TFlab] 3](https://cdn.tradingfinder.com/image/451801/13-151-en-val-bands-v3-indicator-mt5-04.webp)
The Val Bands V3 Indicator, by combining Bollinger Bands with color coded histograms, offers a comprehensive view of trend strength and market entry/exit points.
This trading tool calculates Bollinger Bands based on candle length, providing greater flexibility in analyzing price movements. The colored histograms provide traders with a range of insights into current market trends.
Val Bands V3 Oscillator Specifications Table
The table below displays the specifications of the Val Bands V3 Indicator:
Indicator Categories: | Oscillators MT5 Indicators Currency Strength MT5 Indicators Bands & Channels MT5 Indicators |
Platforms: | MetaTrader 5 Indicators |
Trading Skills: | Intermediate |
Indicator Types: | Reversal MT5 Indicators |
Timeframe: | Multi-Timeframe MT5 Indicators |
Trading Style: | Swing Trading MT5 Indicators Scalper MT5 Indicators Day Trading MT5 Indicators |
Trading Instruments: | Forex MT5 Indicators Crypto MT5 Indicators Stock MT5 Indicators Commodity MT5 Indicators Indices MT5 Indicators Share Stock MT5 Indicators |
Val Bands V3 Indicator at a Glance
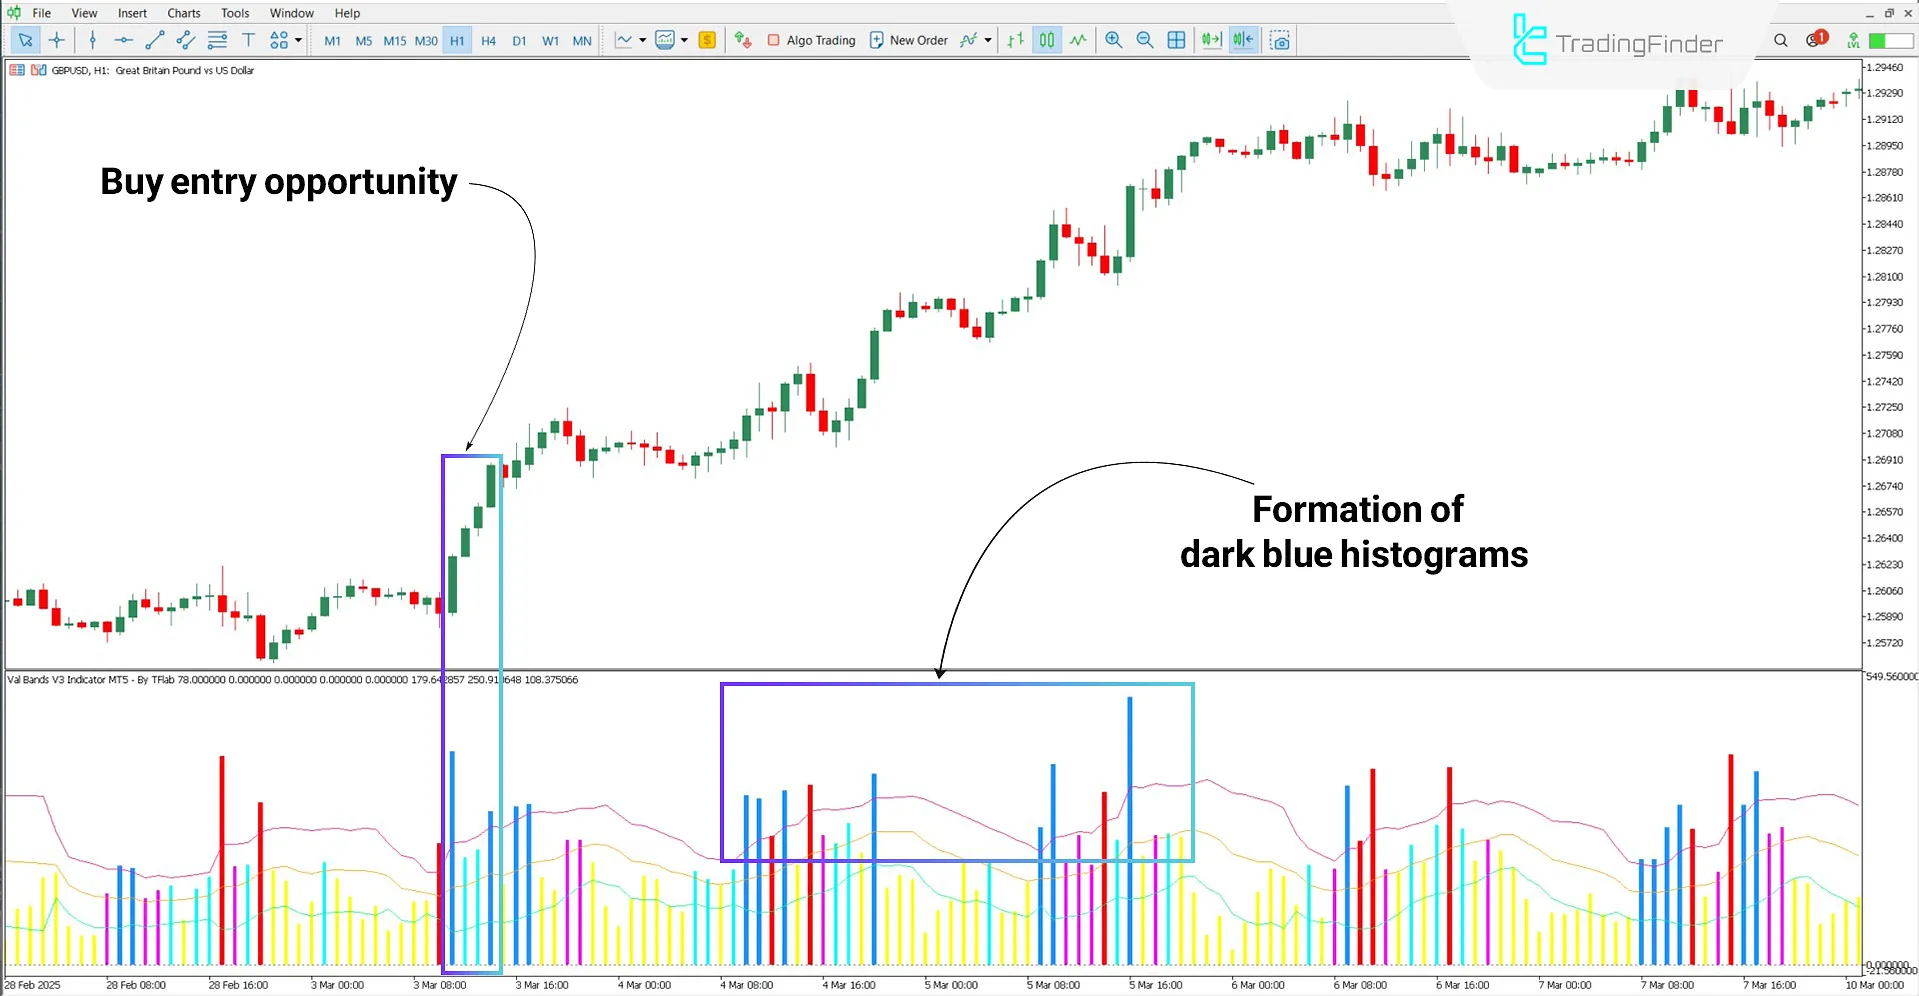
In the Val Bands V3 Oscillator, histogram colors act as a signal for market conditions.
A yellow bar indicates a neutral or ranging market. Light blue bars imply a weak bullish trend, while dark blue bars reflect a strong bullish move.
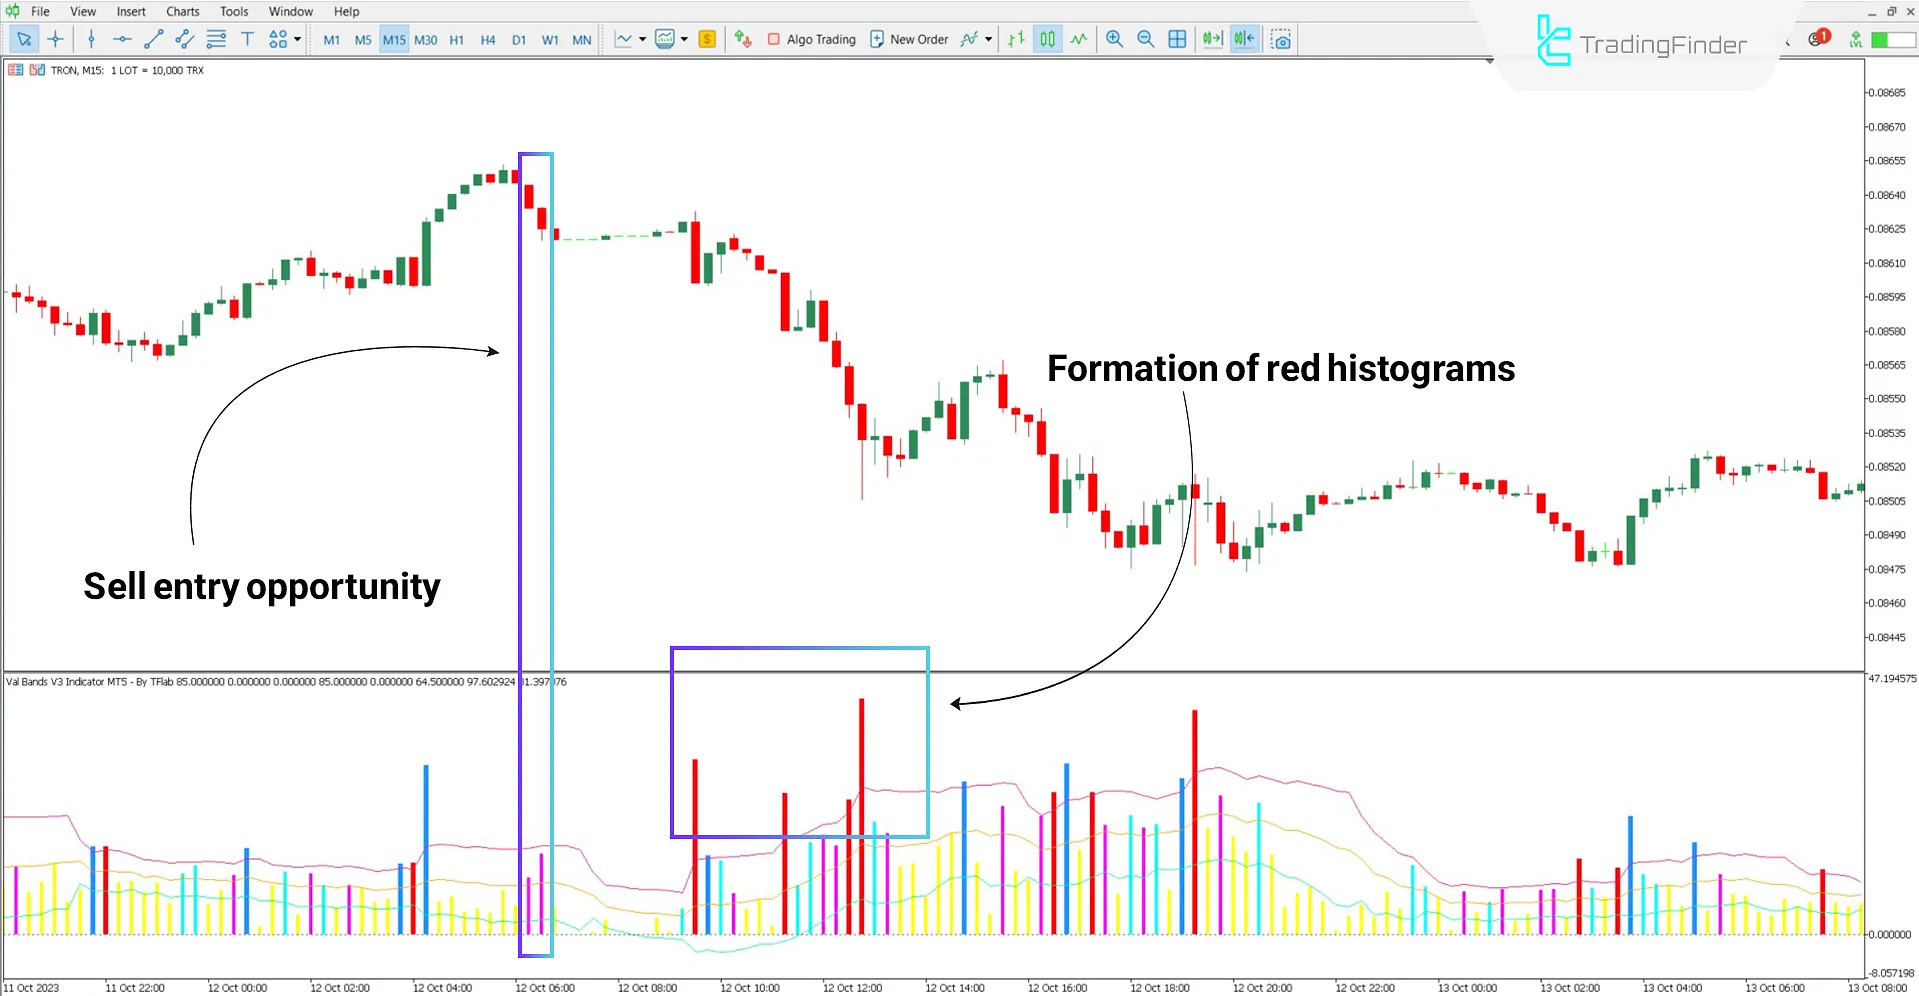
Conversely, pink bars point to mild bearish momentum, and red bars are used to signify intense downward pressure during sharp market declines.
Bullish Trend Conditions
According to the analysis of the GBP/USD currency pair in the 1-hour timeframe, the appearance of the first blue histograms above the Bollinger Bands can be interpreted as an indication to initiate buy positions.
Sustained dark blue bars during the trend confirm the increasing strength of the bullish movement.

Bearish Trend Conditions
Based on the 15-minute chart analysis of the Tron (TRX) cryptocurrency, two red histograms closed in the upper region of the Bollinger Bands.
In this scenario, the first color change in the histogram bars may be interpreted as a sign of market reversal and a possible sell entry.
Additionally, an increase in the size and frequency of pink and red bars signals intensifying selling pressure and a streng thening downtrend.

Val Bands V3 Indicator Settings
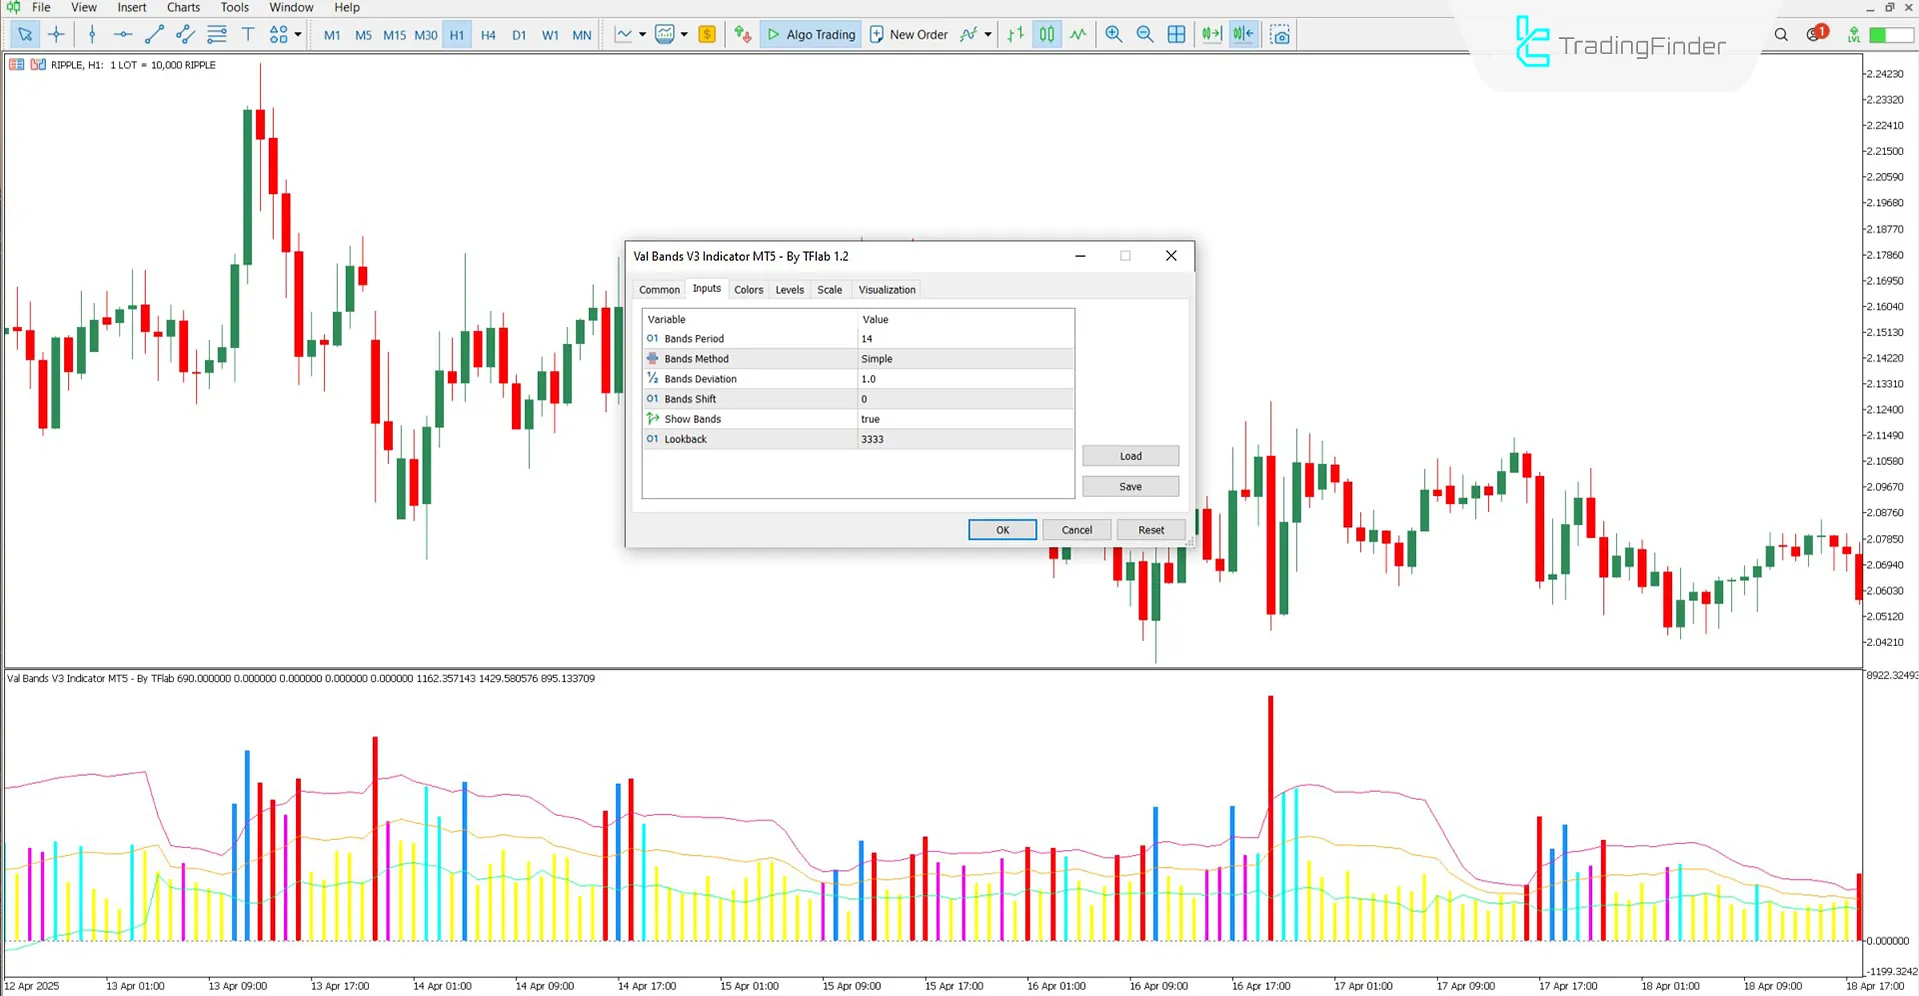
The image below shows the settings of the Val Bands V3 Indicator:

- Bands Period: The period used to calculate the Bollinger Bands
- Bands Method: The averaging method used for Bollinger Bands
- Bands Deviation: Standard deviation coefficient for plotting upper and lower Bollinger Bands
- Bands Shift: The shift applied to Bollinger Bands
- Show Bands: Toggle to show or hide the bands
- Lookback: Number of previous candles used for indicator calculations
Conclusion
The Val Bands V3 Oscillator facilitates the identification of market trends and ranging conditions by analyzing the length of candlesticks.
Through colorcoded histogram bars, it offers detailed insight into trend strength, potential reversal zones, and optimal trade entry and exit points.
One of the key advantages of this tool is its wide applicability across various markets, including Forex, cryptocurrencies, stock indices, and even commodities.
Val Bands V3 Oscillator MT5 PDF
Val Bands V3 Oscillator MT5 PDF
Click to download Val Bands V3 Oscillator MT5 PDFCan the Val Bands V3 Indicator be used in the stock market?
Yes, this indicator can be applied freely across all markets without any limitations.
What exactly does the Val Bands V3 Oscillator do?
This oscillator analyzes candle length to identify trend strength, ranging conditions, and reversal zones. With the help of its color-coded histograms, it delivers reliable buy/sell entry and exit signals.


