![Vertex Alerts Arrows Indicator for MetaTrader 5 Download – Free – [TFlab]](https://cdn.tradingfinder.com/image/330238/4-82-en-vertex-mod-alerts-arrows-mt5-1.webp)
![Vertex Alerts Arrows Indicator for MetaTrader 5 Download – Free – [TFlab] 0](https://cdn.tradingfinder.com/image/330238/4-82-en-vertex-mod-alerts-arrows-mt5-1.webp)
![Vertex Alerts Arrows Indicator for MetaTrader 5 Download – Free – [TFlab] 1](https://cdn.tradingfinder.com/image/330239/4-82-en-vertex-mod-alerts-arrows-mt5-2.webp)
![Vertex Alerts Arrows Indicator for MetaTrader 5 Download – Free – [TFlab] 2](https://cdn.tradingfinder.com/image/330237/4-82-en-vertex-mod-alerts-arrows-mt5-3.webp)
![Vertex Alerts Arrows Indicator for MetaTrader 5 Download – Free – [TFlab] 3](https://cdn.tradingfinder.com/image/330240/4-82-en-vertex-mod-alerts-arrows-mt5-4.webp)
The Vertex Alerts Arrows Indicator is an advanced signaling tool on the MetaTrader 5 platform. It combines the data of three key indicators: the internal oscillator, Bollinger Bands, and overbought/oversold (OB/OS) concepts.
This MetaTrader 5 signal and forecasting indicator uses a multi-stage structure to display two types of trading signals on the chart: colored arrows and bold circles representing weak and strong signals, respectively.
Indicator Features Table
The features of the Vertex Alerts Arrows Indicator are summarized in the table below.
Indicator Categories: | Oscillators MT5 Indicators Signal & Forecast MT5 Indicators Bands & Channels MT5 Indicators |
Platforms: | MetaTrader 5 Indicators |
Trading Skills: | Intermediate |
Indicator Types: | Reversal MT5 Indicators |
Timeframe: | Multi-Timeframe MT5 Indicators |
Trading Style: | Day Trading MT5 Indicators |
Trading Instruments: | Forex MT5 Indicators Crypto MT5 Indicators Stock MT5 Indicators Forward MT5 Indicators Share Stock MT5 Indicators |
Indicator at a Glance
In the initial overbought/oversold zone (level +6 or -6), a green or red arrow appears to identify regular entry or exit alerts.
If the momentum reaches more critical levels (such as +10 or -10), the indicator adds a bold circle on the candle, signaling a stronger and higher-risk trade.
Indicator in an Uptrend
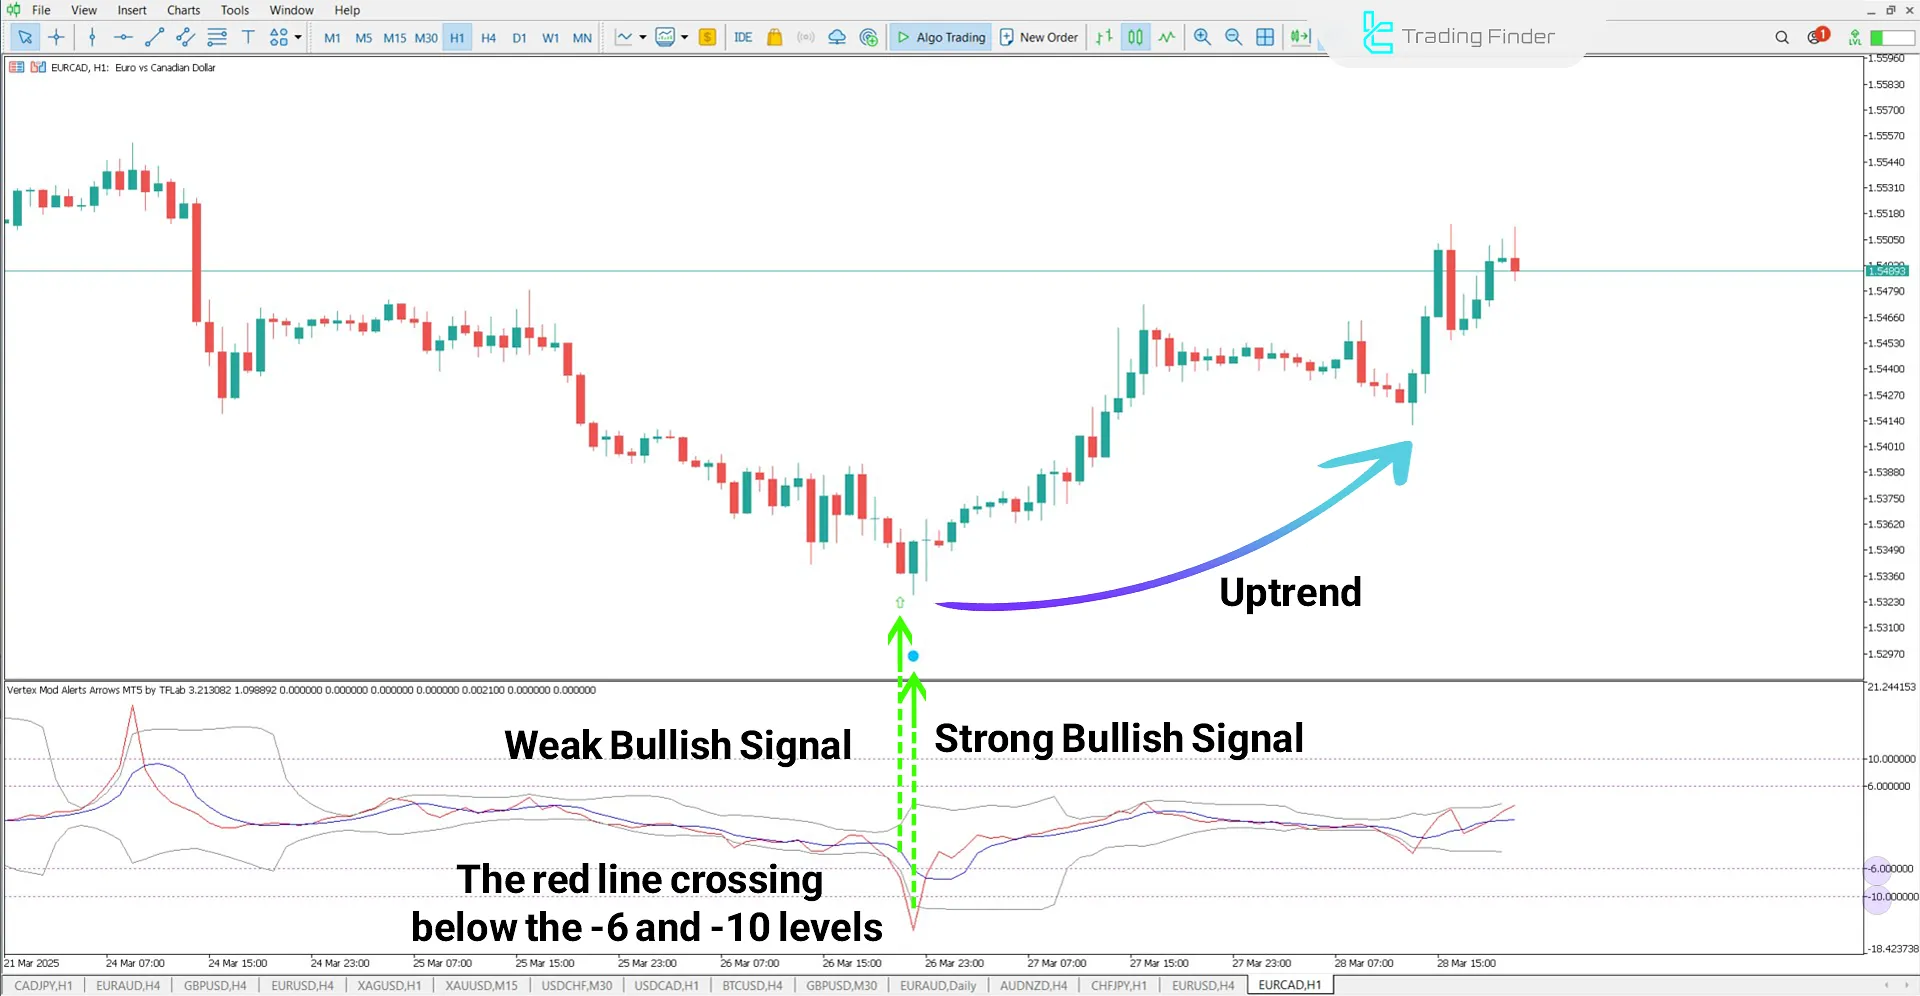
In theEUR/CAD one-hour chart, when the red oscillator line reaches -6, it signals an oversold condition, and the indicator displays a green arrow, indicating the initial weak uptrend signal.
As the oscillator moves downwards and reaches -10, the condition is interpreted as a strong uptrend signal, displayed with a bold blue circle on the candles.

Indicator in a Downtrend
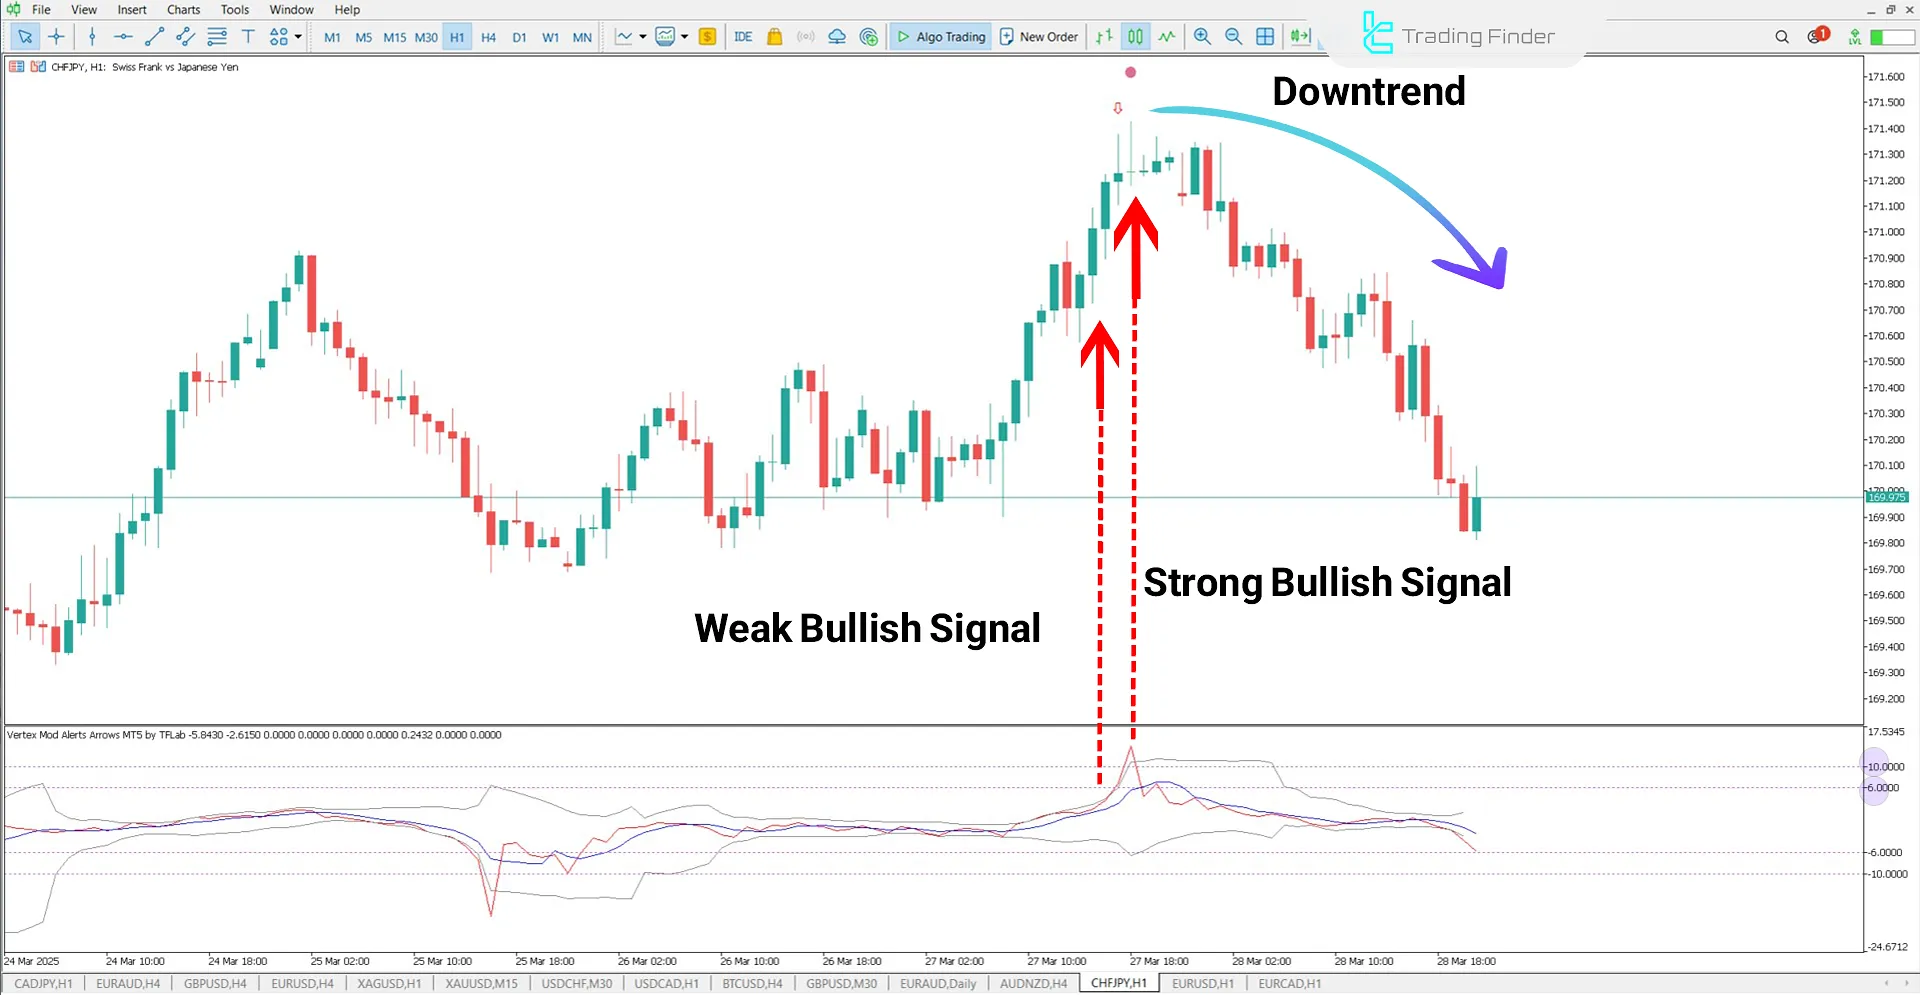
In the CHF/JPY chart, the indicator's red line reaches +6, indicating overbought conditions, and a red arrow shows a weak downtrend.
As the price moves upward and the oscillator crosses +10, the condition is recognized as a strong downtrend signal, marked with a bold red circle on the candle.

Indicator Settings
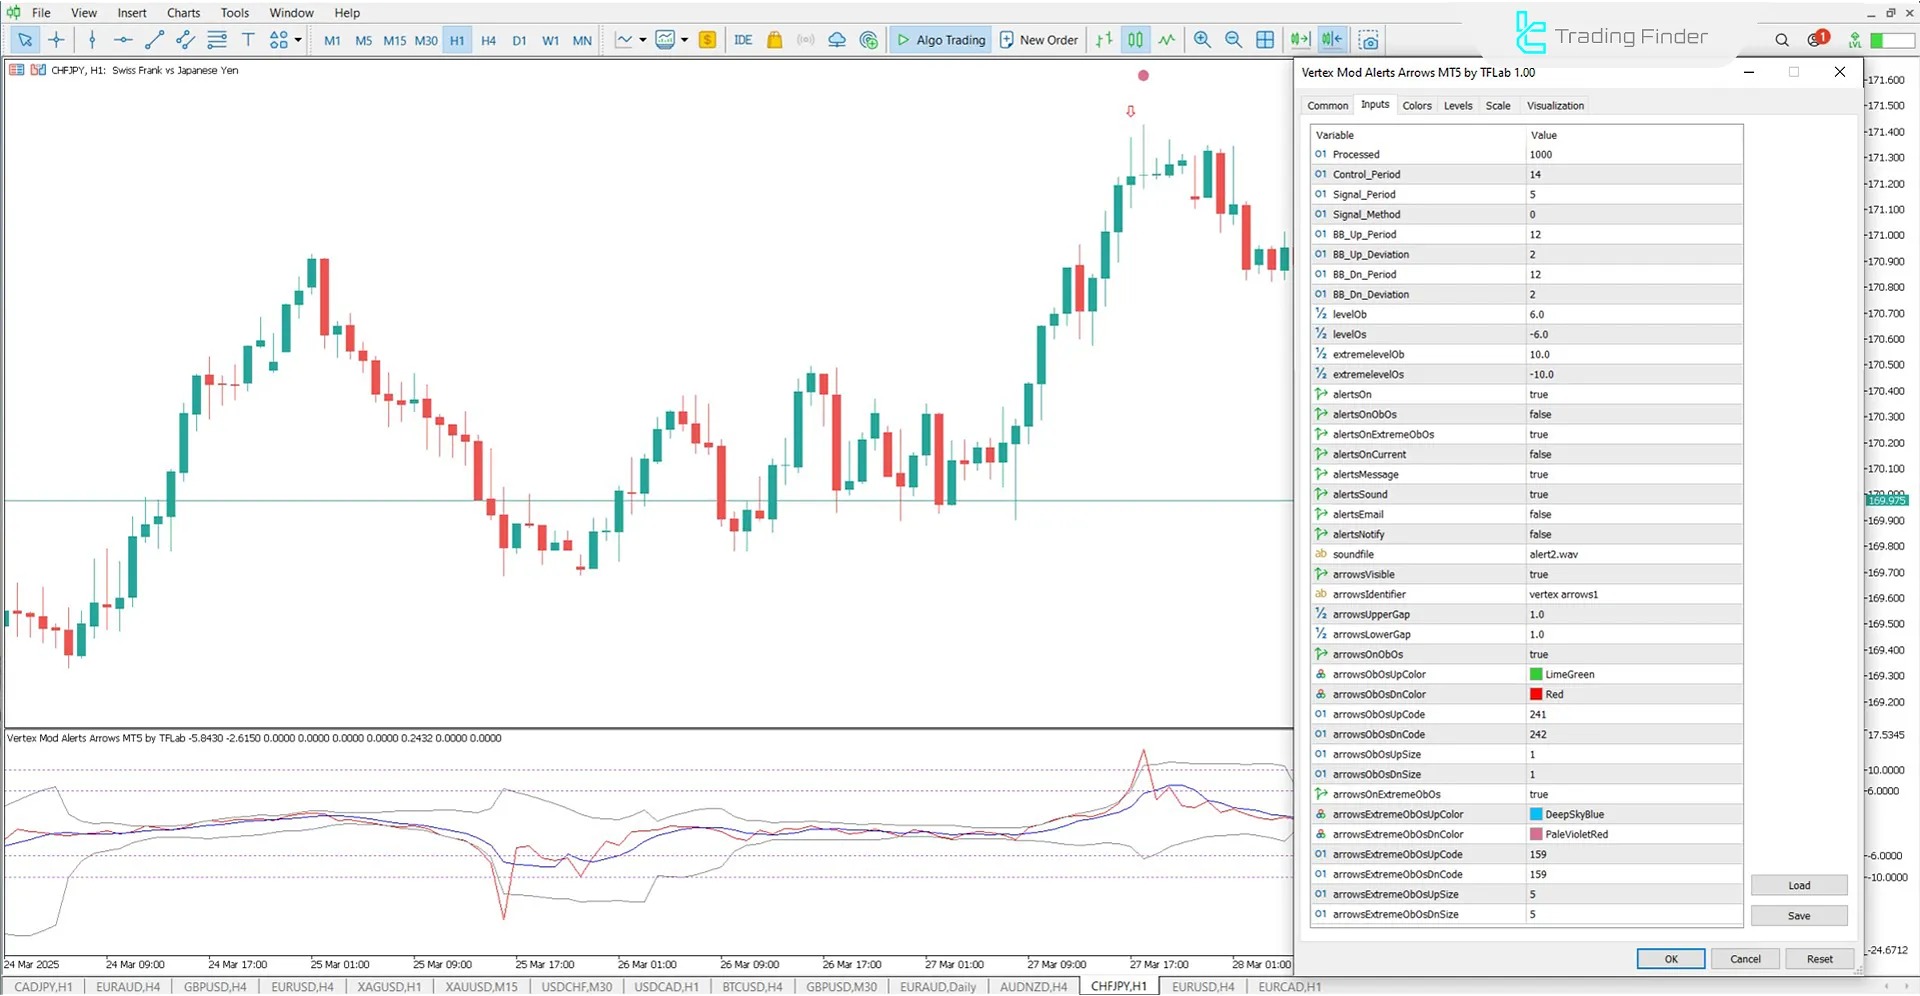
The parameter settings of the Vertex Alerts Arrows Indicator are displayed in the image below:

- Processed: Processing the number of candles for the indicator
- Control_Period: Control period for signal calculation
- Signal_Period: Period for calculating the signal
- Signal_Method: Method for calculating the signal
- BB_Up_Period: Number of candles for calculating the upper band
- BB_Up_Deviation: Standard deviation for the upper band
- BB_Dn_Period: Number of candles for calculating the lower band
- BB_Dn_Deviation: Standard deviation for the lower band
- levels: Overbought level
- levels: Oversold level
- extremelevelOb: Extreme overbought level
- extreme levels: Extreme oversold level
- Albertson: Enable all alerts
- alertsOnObOs: Alerts for standard overbought and oversold levels
- alertsOnExtremeObOs: Alerts for extreme overbought and oversold levels
- alertsOnCurrent: Alerts on the current candle
- alert message: Display alert message
- alert sound: Play alert sound
- alerts email: Send alert to email
- alerts notify: Send notification alert
- sound file: Alert sound file
- arrows visible: Enable arrow display
- arrowsIdentifier: Name for arrow identification on the chart
- arrowsUpperGap: Gap between the ascending arrow and the candle
- arrowsLowerGap: Gap between the descending arrow and the candle
- arrowsOnObOs: Display arrows for standard overbought and oversold
- arrowsObOsUpColor: Buy arrow color
- arrowsObOsDnColor: Sell arrow color
- arrowsObOsUpCode: Buy arrow graphic code
- arrowsObOsDnCode: Sell arrow graphic code
- arrowsObOsUpSize: Buy arrow size
- arrowsObOsDnSize: Sell arrow size
- arrowsOnExtremeObOs: Display arrows for extreme overbought and oversold
- arrowsExtremeObOsUpColor: Strong buy arrow color
- arrowsExtremeObOsDnColor: Strong sell arrow color
- arrowsExtremeObOsUpCode: Strong buy arrow graphic code
- arrowsExtremeObOsDnCode: Strong sell arrow graphic code
- arrowsExtremeObOsUpSize: Strong buy arrow size
- arrowsExtremeObOsDnSize: Strong sell arrow size
Conclusion
The Vertex Alerts Arrows Indicator is an advanced signaling tool in technical analysis. It was designed by combining three powerful indicators: Bollinger Bands, Momentum Oscillator, and Moving Average.
This indicator works based on overbought and oversold conditions, providing weak and strong signals.
Vertex Alerts Arrows MT5 PDF
Vertex Alerts Arrows MT5 PDF
Click to download Vertex Alerts Arrows MT5 PDFCan the color, size, and position of signals be customized?
Users can change the color, size, graphic code, and position of the arrows and circles in the indicator settings according to their needs.
Does this indicator also have audio or visual alerts?
Yes, audio alerts, text messages, email alerts, and notifications can be activated for both weak and strong signals via the settings.
Is this a lagging or repainting indicator?
Please review the usage guide carefully, and if any issues persist, contact the online chat for assistance.


