![Volatility Switch Indicator for MetaTrader 5 Download – Free – [TFlab]](https://cdn.tradingfinder.com/image/405447/4-53-en-vsi-indicator-mt5-1.webp)
![Volatility Switch Indicator for MetaTrader 5 Download – Free – [TFlab] 0](https://cdn.tradingfinder.com/image/405447/4-53-en-vsi-indicator-mt5-1.webp)
![Volatility Switch Indicator for MetaTrader 5 Download – Free – [TFlab] 1](https://cdn.tradingfinder.com/image/405434/4-53-en-vsi-indicator-mt5-2.webp)
![Volatility Switch Indicator for MetaTrader 5 Download – Free – [TFlab] 2](https://cdn.tradingfinder.com/image/405446/4-53-en-vsi-indicator-mt5-3.webp)
![Volatility Switch Indicator for MetaTrader 5 Download – Free – [TFlab] 3](https://cdn.tradingfinder.com/image/405445/4-53-en-vsi-indicator-mt5-4.webp)
The Volatility Switch Indicator (VSI) is a useful tool among MetaTrader 5 indicators. It is designed to display overbought and oversold conditions.
This indicator fluctuates between 0 and 1 and features three key levels: 0.2, 0.5, and 0.8. These levels help analyze reversal zones or trend continuation areas in the market.
Volatility Switch Indicator Specifications
The table below summarizes the specifications of this indicator.
Indicator Categories: | Oscillators MT5 Indicators Volatility MT5 Indicators Trading Assist MT5 Indicators |
Platforms: | MetaTrader 5 Indicators |
Trading Skills: | Intermediate |
Indicator Types: | Reversal MT5 Indicators |
Timeframe: | Multi-Timeframe MT5 Indicators |
Trading Style: | Intraday MT5 Indicators |
Trading Instruments: | Forex MT5 Indicators Crypto MT5 Indicators Stock MT5 Indicators Forward MT5 Indicators |
Indicator at a Glance
The Volatility Switch Indicator (VSI) provides valuable signals for identifying price reversal areas.
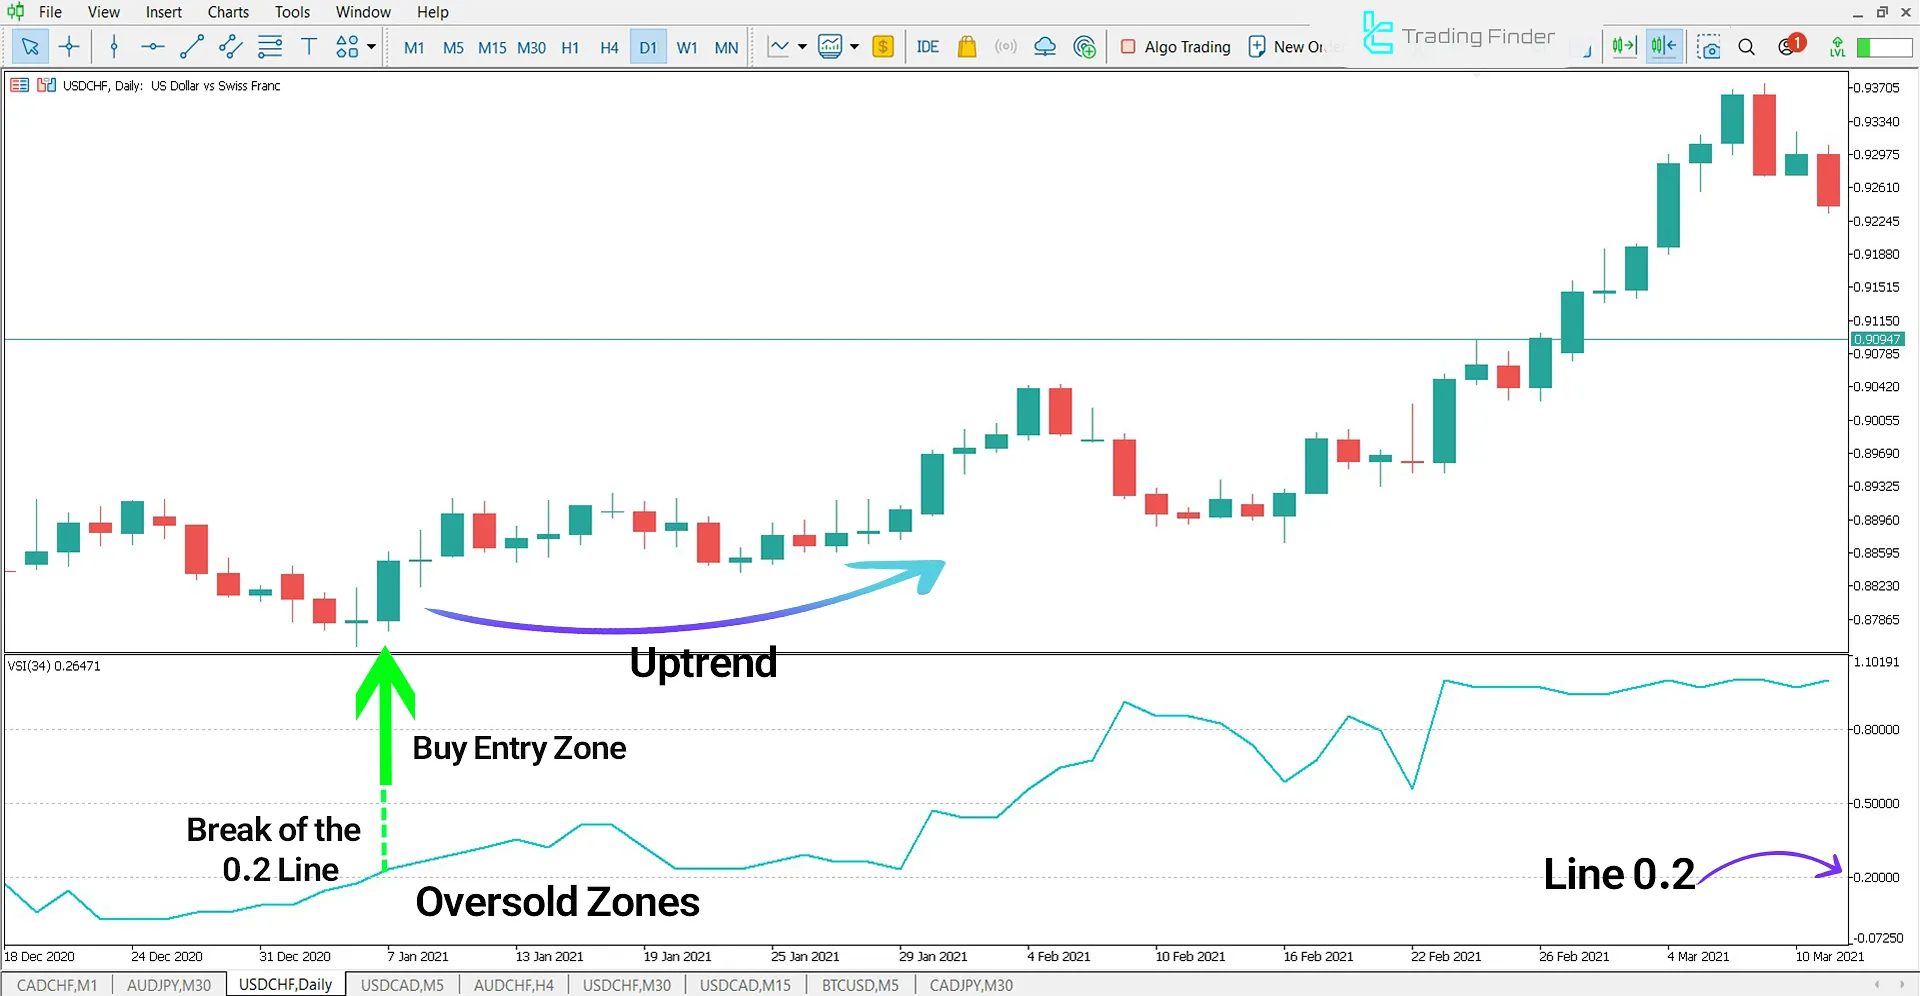
When the blue oscillator line crosses above the 0.2 level, it signals an oversold condition, indicating a potential increase in demand and a possible upward price movement.
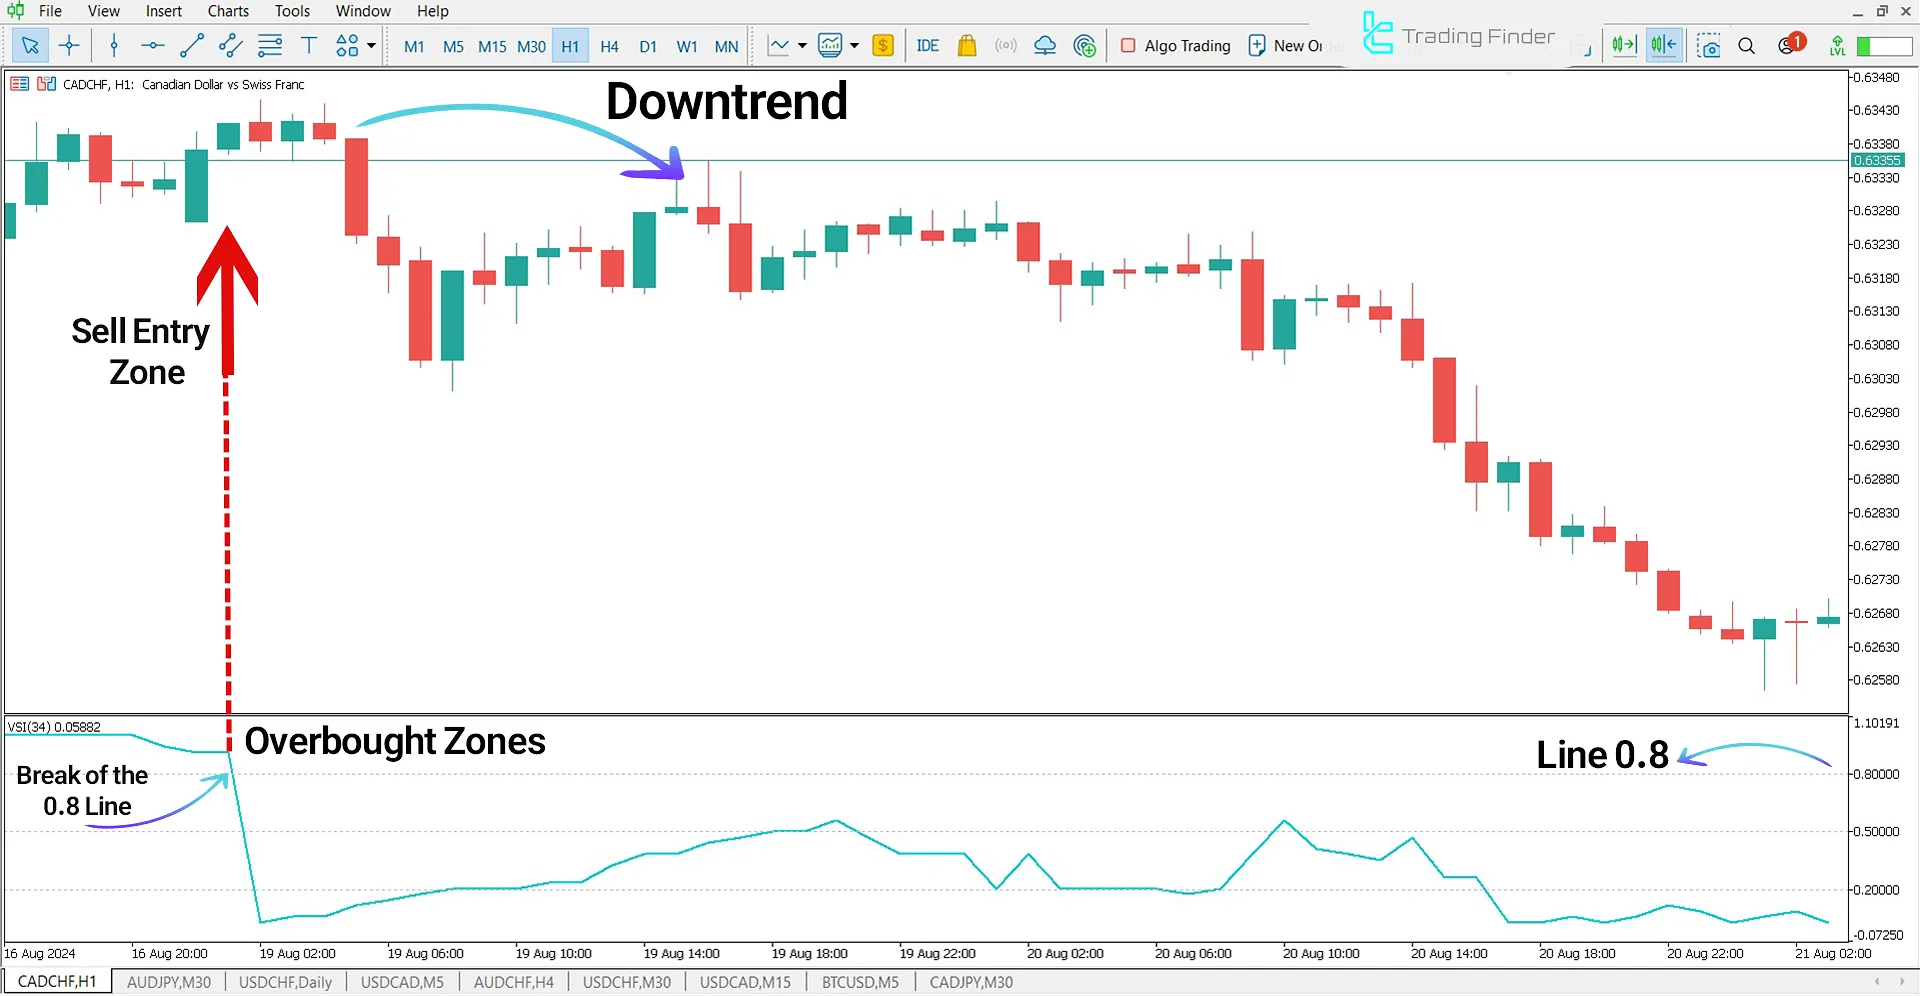
Conversely, when the oscillator line crosses below the 0.8 level, it suggests an overbought condition, meaning the market is entering a bearish phase.
Indicator in a Bullish Trend
In the USD/CHF currency pair chart, the price reaches the oversold zone, and the blue oscillator line crosses the 0.2 level upwards. Once the bullish trend is confirmed, traders can use these signals to enter buy trades.

Indicator in a Bearish Trend
After the price reaches oversold zones, the indicator line moves toward the 0.8 level.
When this level is crossed downward, traders can consider this a sell signal.

Indicator Settings
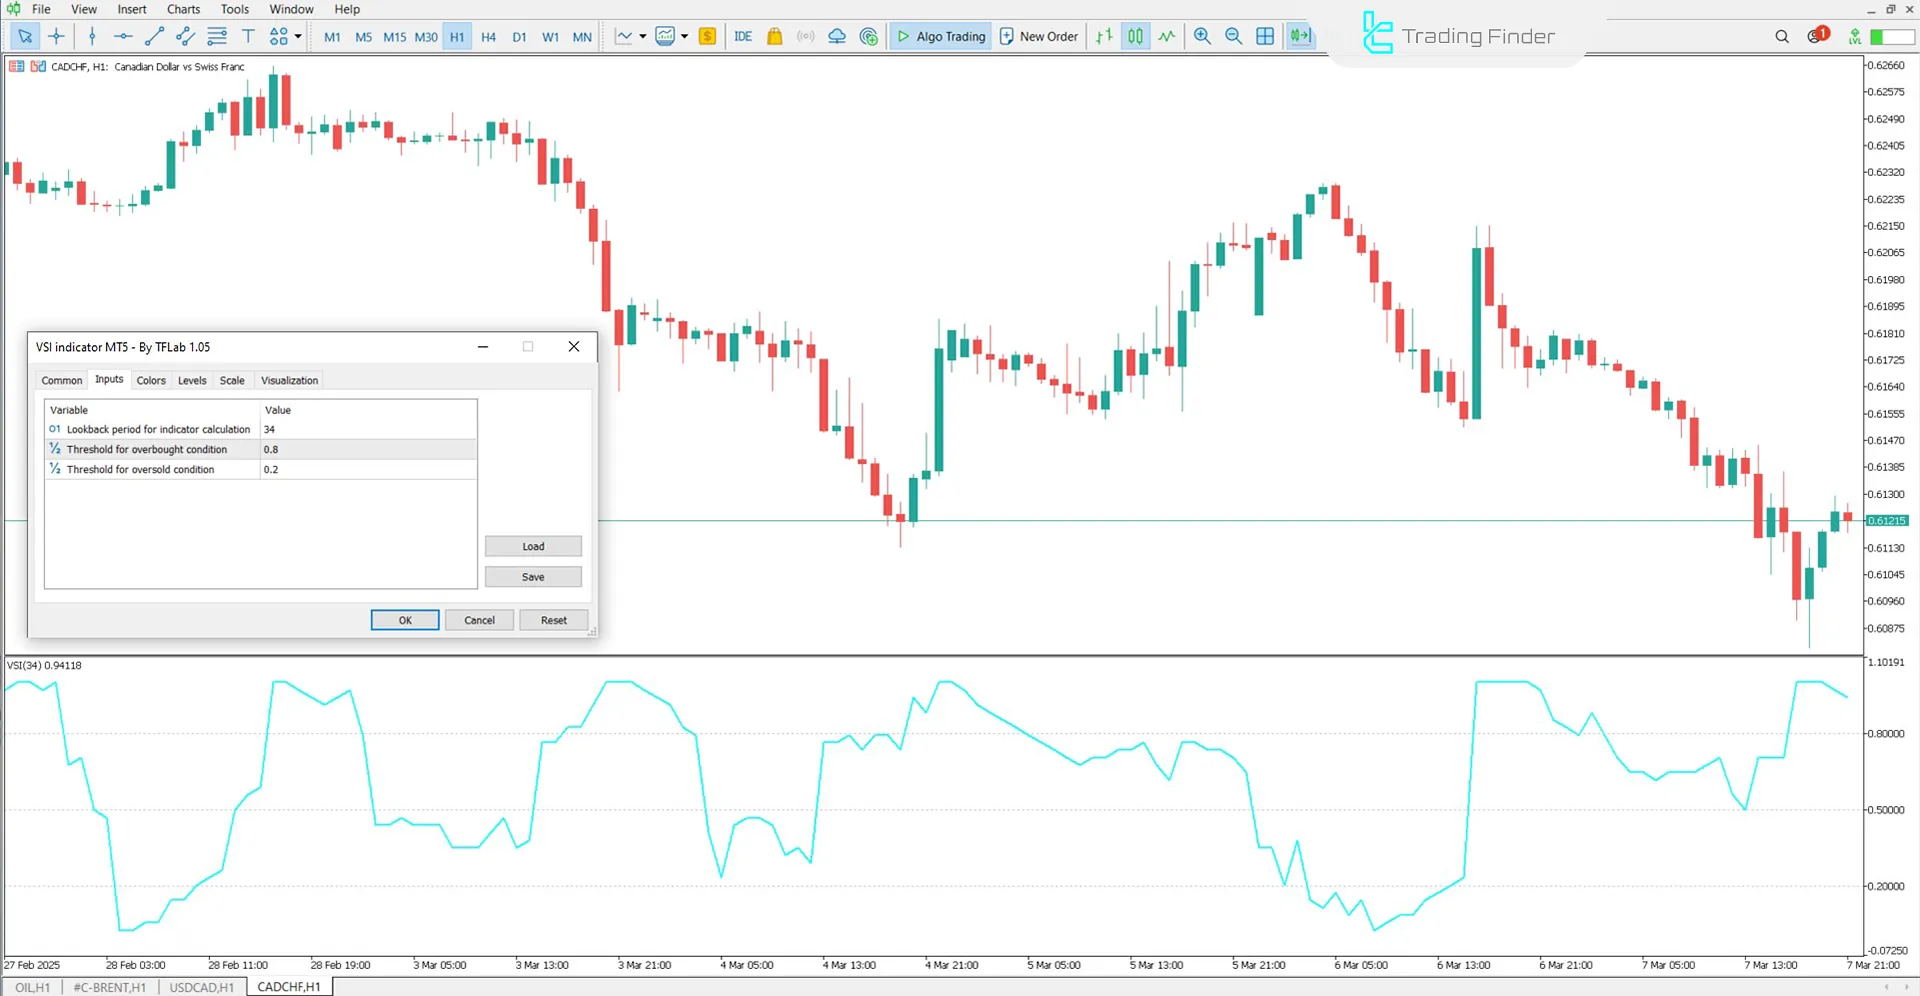
The image below displays the full settings of the Volatility Switch Indicator:

- The lookback period for indicator calculation: Defines the number of past candles used for calculations.
- The threshold for the overbought condition: Determines the overbought level.
- Threshold for oversold condition: Determines the oversold level.
Conclusion
The Volatility Switch Indicator (VSI) is a useful tool designed to detect overbought and oversold zones.
This MetaTrader 5 oscillator analyzes market volatility and normalizes values within the 0 to 1 range, helping traders identify key changes in price behavior.
Volatility Switch MT5 PDF
Volatility Switch MT5 PDF
Click to download Volatility Switch MT5 PDFHow does the Volatility Switch Indicator (VSI) work?
The VSI fluctuates between 0 and 1, using three key levels, 0.2, 0.5, and 0.8, to indicate market volatility changes.
What type of trading is the Volatility Switch Indicator suitable for?
The Volatility Switch Indicator suits day trading, scalping, and even long-term trading strategies.


