![Volume MA Indicator MetaTrader 5 Download - [TradingFinder]](https://cdn.tradingfinder.com/image/422706/2-69-en-volume-ma-mt5-1.webp)
![Volume MA Indicator MetaTrader 5 Download - [TradingFinder] 0](https://cdn.tradingfinder.com/image/422706/2-69-en-volume-ma-mt5-1.webp)
![Volume MA Indicator MetaTrader 5 Download - [TradingFinder] 1](https://cdn.tradingfinder.com/image/422705/2-69-en-volume-ma-mt5-2.webp)
![Volume MA Indicator MetaTrader 5 Download - [TradingFinder] 2](https://cdn.tradingfinder.com/image/422703/2-69-en-volume-ma-mt5-3.webp)
![Volume MA Indicator MetaTrader 5 Download - [TradingFinder] 3](https://cdn.tradingfinder.com/image/422704/2-69-en-volume-ma-mt5-4.webp)
The Volume MA indicator is a technical analysis tool in the MetaTrader 5 platform that simplifies volume fluctuations by using the moving average of volume over a defined period (e.g., the past 14 or 20 candles).
This oscillator compares each candle’s trading volume with the average volume of the selected period:
- Volume above average: Indicates increased trading activity
- Volume below average: Suggests a decrease in trading activity
Volume MA Specifications Table
The table below presents the general specifications of the Volume MA indicator on the MetaTrader 5 platform:
Indicator Categories: | Volume MT5 Indicators Oscillators MT5 Indicators Trading Assist MT5 Indicators |
Platforms: | MetaTrader 5 Indicators |
Trading Skills: | Intermediate |
Indicator Types: | Reversal MT5 Indicators |
Timeframe: | Multi-Timeframe MT5 Indicators |
Trading Style: | Intraday MT5 Indicators |
Trading Instruments: | Forex MT5 Indicators Crypto MT5 Indicators Stock MT5 Indicators Commodity MT5 Indicators Indices MT5 Indicators Share Stock MT5 Indicators |
Indicator Overview
The Volume MA indicator is an Trading tool for reviewing trade volume, functioning similarly to a moving average. It uses different colored bars in the histogram to reflect market activity:
- Green bar: Indicates rising prices when the fast volume MA is below the slow volume MA;
- Gray bar: Confirms price growth when the short-term volume MA is above the long-term volume MA;
- Pink bar: As prices decline, the fast volume MA moves below the slow volume MA;
- Dark red bar: Indicates sharp price drops accompanied by increased volume, where the fast volume moving average (MA) crosses above the slow one.
Uptrend Conditions
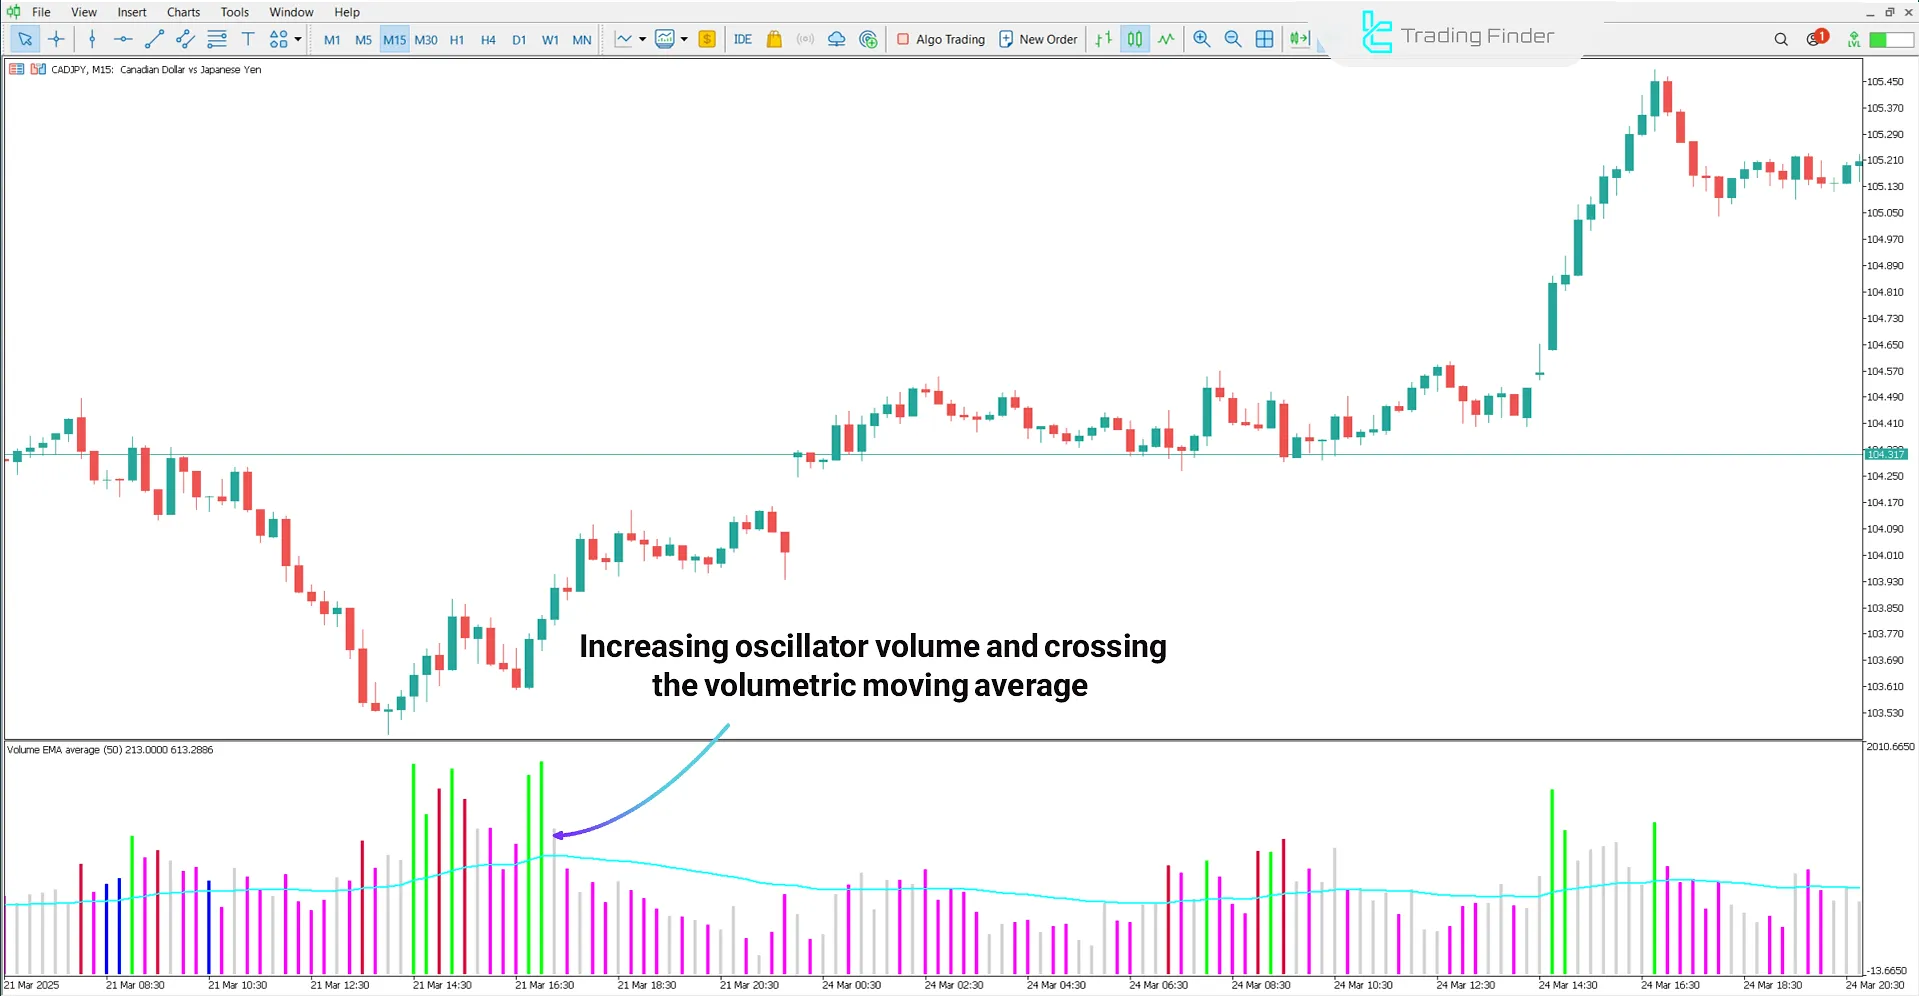
In the 15-minute chart of the CAD/JPY currency pair, an increase in volume accompanied by a bullish candle above the volume moving average (MA) reflects a strong uptrend. This is often considered a confirmation signal for trend continuation.

Downtrend Conditions
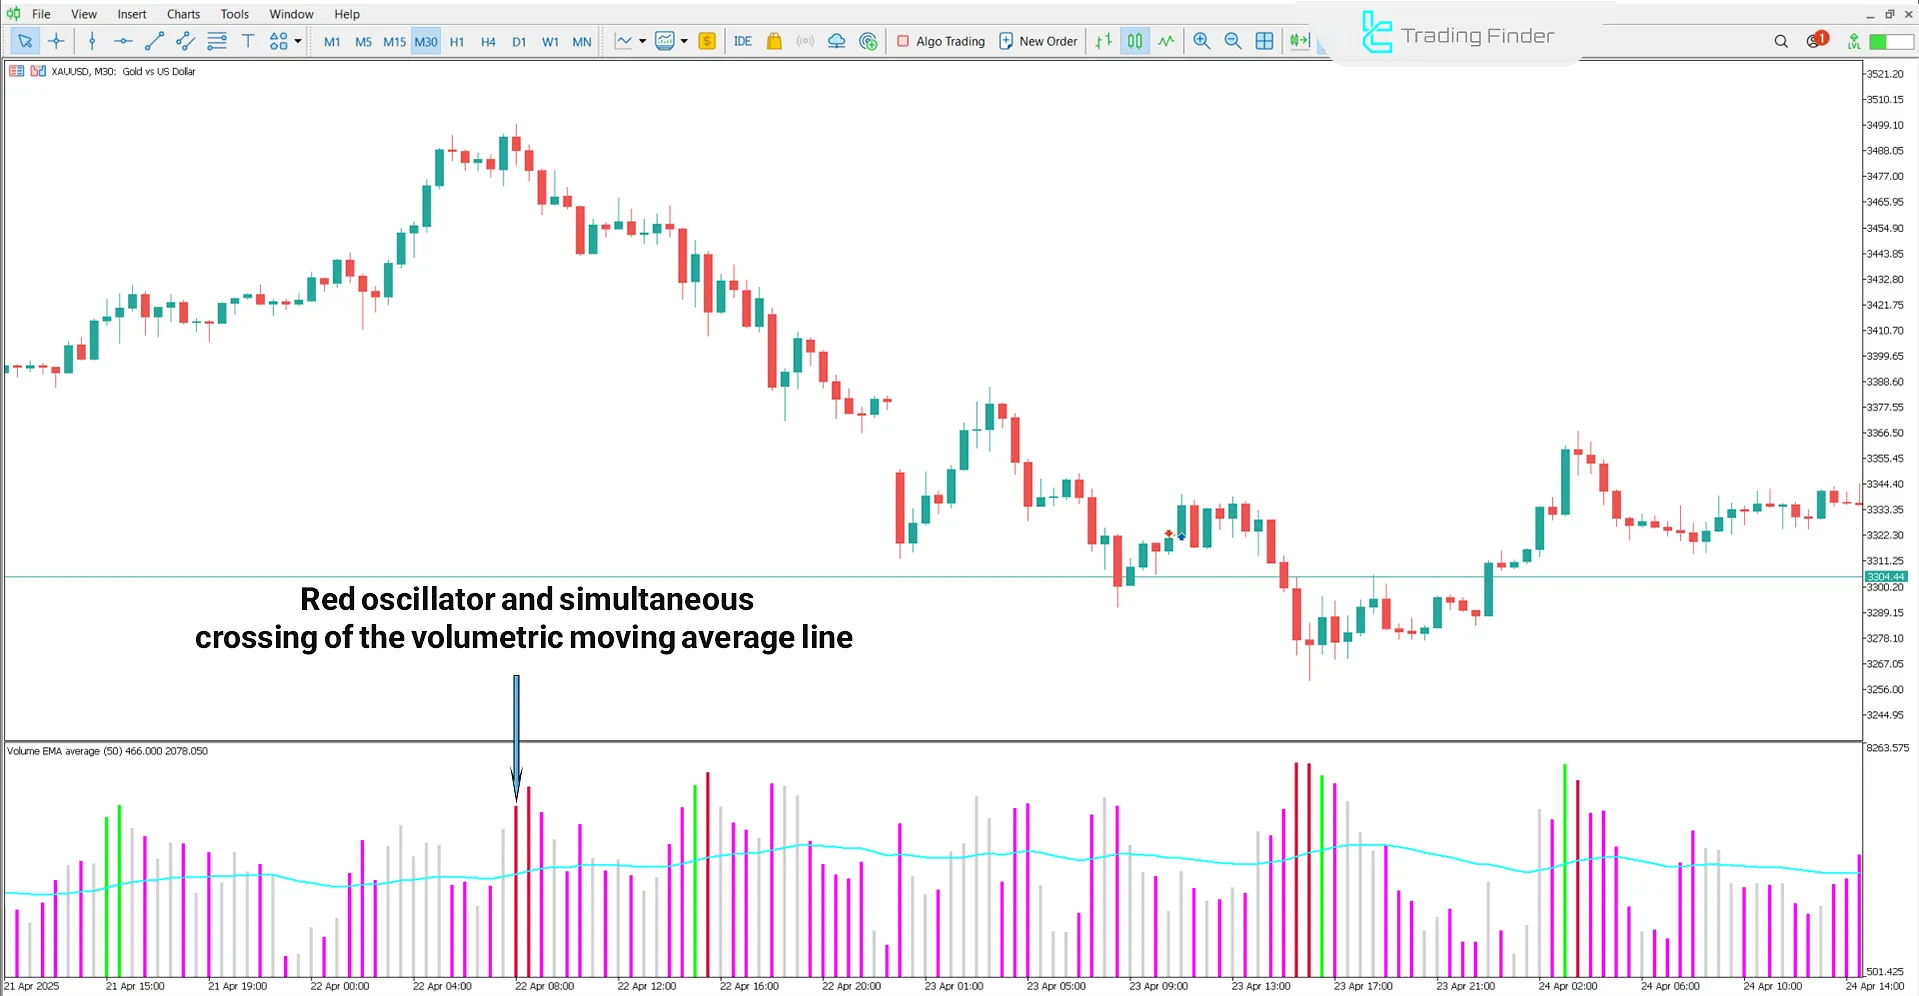
The price chart below displays the Gold Spot Index (XAU/USD) in the 30-minute timeframe.
A bearish candle with above-average volume in a resistance zone may indicate intense selling pressure, providing a suitable setup for short positions.

Volume MA Indicator Settings
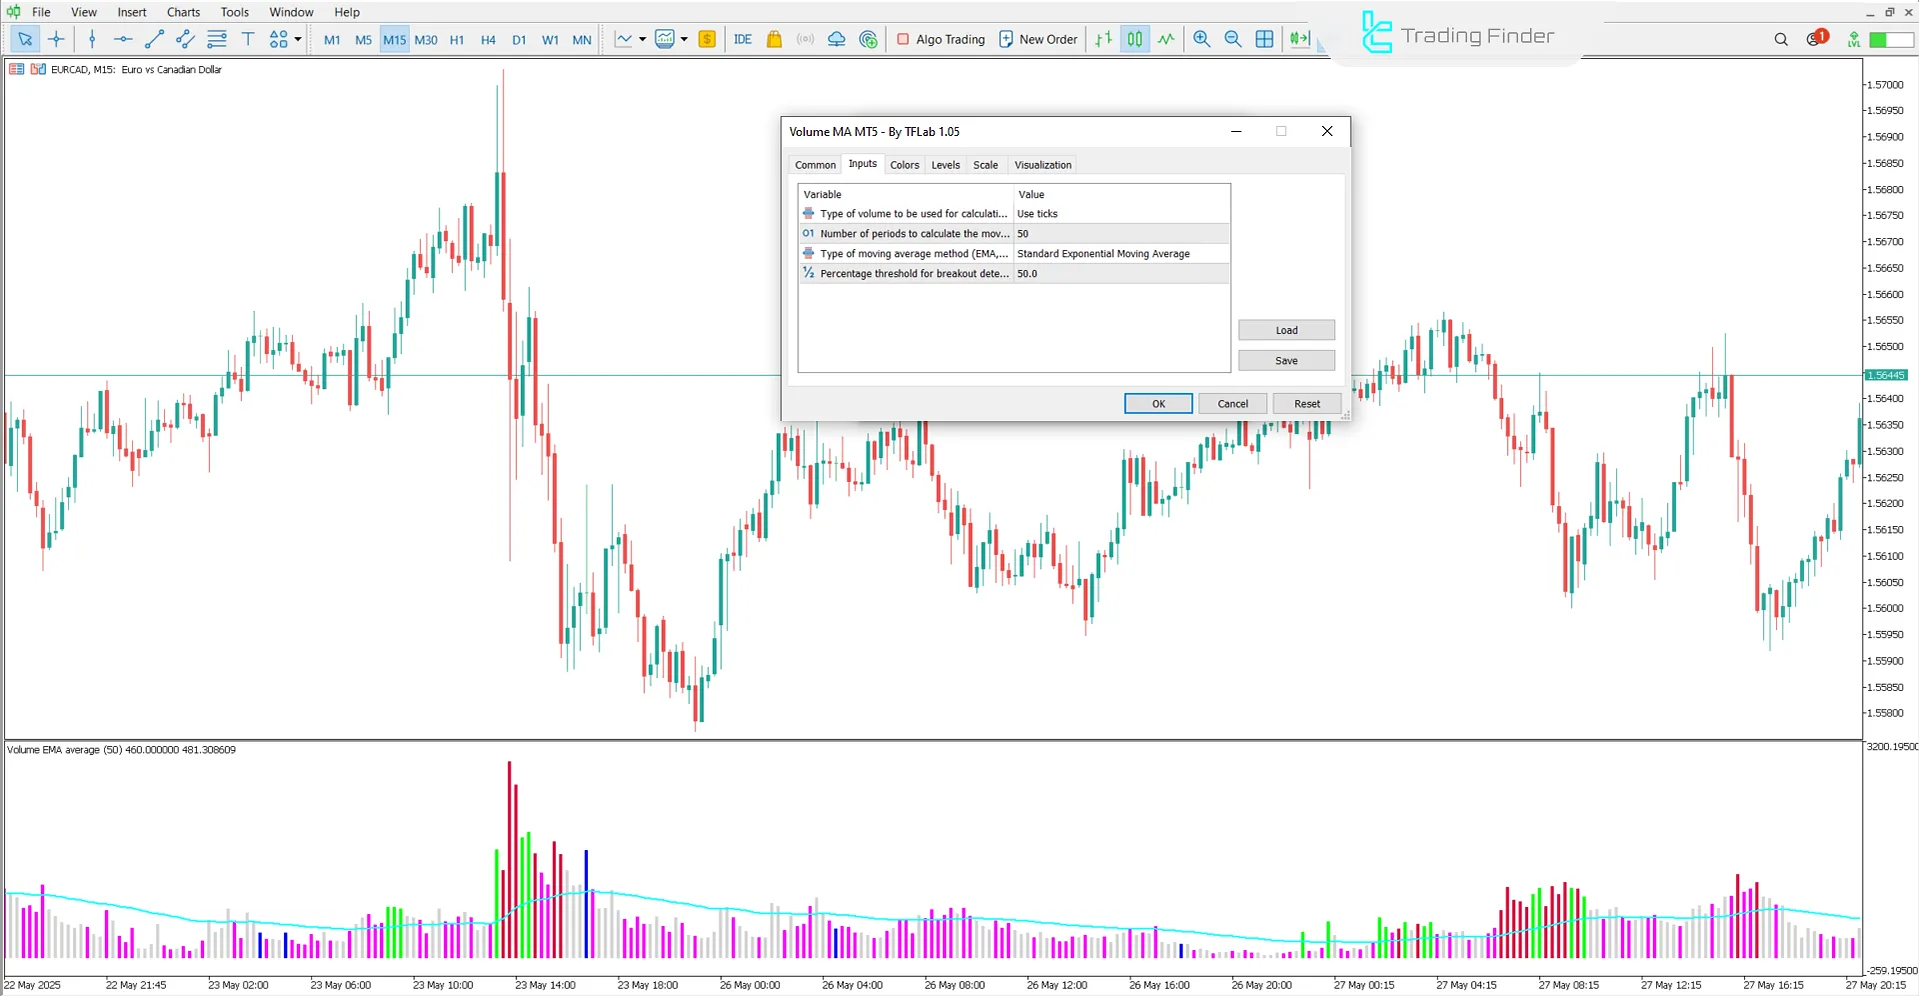
The image below shows the settings panel of the Volume MA indicator in MetaTrader 5:

- Type of volume to be used for calculation: Volume type used for calculation
- Number of periods to calculate the moving average: Number of candles for calculating volume MA
- Moving average method (EMA,...): Moving average method used
- Percentage threshold for breakout detection: Threshold percentage for detecting volume breakout from average
Conclusion
The Volume MA indicator identifies strengths and weaknesses in trends by comparing current volume against the volume moving average.
An increased volume with a strong bullish candle confirms trend continuation and signals an Entry, whereas high volume with a bearish candle in a resistance zone indicates selling pressure.
In which timeframes can the Volume MA indicator be used?
This trading tool is applicable across all timeframes.
What is the significance of bar colors in the Volume MA indicator?
Green bars indicate volume increases compared to the previous candle or above-average volume, while red bars indicate decreasing volume or values below the average.


