


![VSA Text Indicator for MetaTrader 5 Download - [TradingFinder]](https://cdn.tradingfinder.com/image/406635/2-73-en-vsa-text-indicator-mt5-1-1.webp)
![VSA Text Indicator for MetaTrader 5 Download - [TradingFinder] 1](https://cdn.tradingfinder.com/image/406616/2-73-en-vsa-text-indicator-mt5-1-2.webp)
![VSA Text Indicator for MetaTrader 5 Download - [TradingFinder] 2](https://cdn.tradingfinder.com/image/406634/2-73-en-vsa-text-indicator-mt5-1-3.webp)
![VSA Text Indicator for MetaTrader 5 Download - [TradingFinder] 3](https://cdn.tradingfinder.com/image/406618/2-73-en-vsa-text-indicator-mt5-1-4.webp)
The VSA Text Indicator on the MetaTrader 5 platform is a tool based on the "Volume Spread Analysis" method, used for simultaneous analysis of trading volume and candlestick behavior.
This tool was developed to detect smart money Style. By providing accurate text-based signals on the chart, it enables the identification of key market entry and exit points.
VSA Text Indicator Table
The features of the VSA Text Indicator are displayed in the table below:
Indicator Categories: | Smart Money MT5 Indicators Signal & Forecast MT5 Indicators ICT MT5 Indicators |
Platforms: | MetaTrader 5 Indicators |
Trading Skills: | Intermediate |
Indicator Types: | Reversal MT5 Indicators |
Timeframe: | Multi-Timeframe MT5 Indicators |
Trading Style: | Intraday MT5 Indicators |
Trading Instruments: | Forex MT5 Indicators Crypto MT5 Indicators Stock MT5 Indicators Commodity MT5 Indicators Indices MT5 Indicators Forward MT5 Indicators Share Stock MT5 Indicators |
Overview of the Indicator
The Volume Spread Analysis Text Indicator analyzes price behavior alongside trading volume to precisely detect supply and demand pressure conditions. It displays this as text signals on the chart.
Each signal indicates a specific market condition:
- Upthrust: Failed attempt to break resistance
- No Demand Bar: Weak demand with low volume
- Stopping Volume: Downtrend halting with increased volume
- Reverse Upthrust: Support reaction with buying pressure
- No Supply Bar: Lack of supply at market bottom
- Effort to Move Up: Upward move with significant volume
- Effort to Move Down: Downward move with heavy selling pressure
Uptrend Conditions
The image below shows the 4-hour chart of the GBP/CHF currency pair. At the end of a downtrend, an increase in volume alongside price growth and the "Effort to Move Up" signal indicates buyer pressure and a trend reversal.
Downtrend Conditions
The 4-hour chart of the cryptocurrency Zcash (ZEC/USD) shows a downtrend. In this scenario, the "Effort to Move Down" signal, a price drop, and increased trading volume indicate selling pressure and a sell trade opportunity.
VSA Text Indicator Settings
The image below displays the configurable settings panel of the VSA Text Indicator:
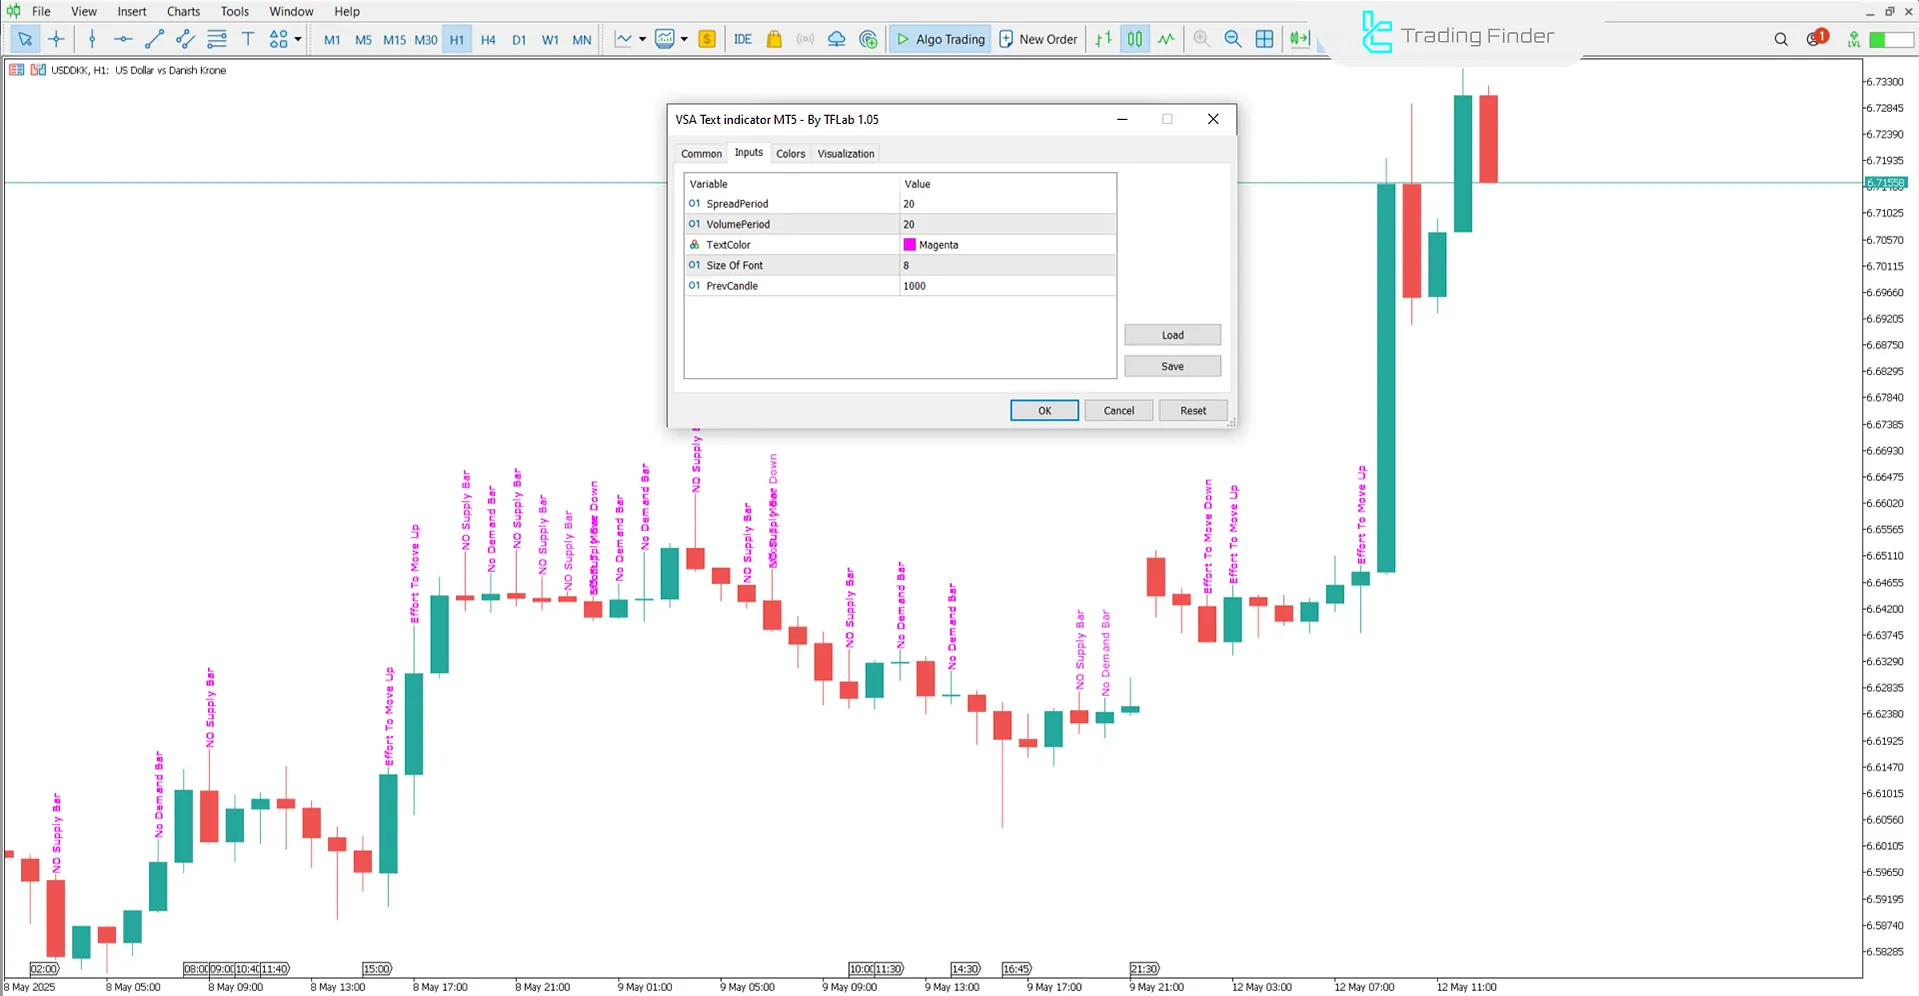
- Spread Period: Period for evaluating candle spread
- Volume Period: Period in assessing trading volume
- Text Color: Text color
- Size Of Font: Font size
- Prev Candle: Reference candle position
Conclusion
The VSA Text Indicator is designed based on volume-price analysis in technical analysis.
By simultaneously reviewing volume and price closing positions, it displays signals like Upthrust, No Demand, and Effort to Move Up directly on the chart in text format.
VSA Text MT5 PDF
VSA Text MT5 PDF
Click to download VSA Text MT5 PDFHow are the signals of the VSA Text Indicator displayed?
The indicator's signals are displayed as text directly on the candlesticks.
What is the primary purpose of using the VSA Text Indicator?
The primary goal of this indicator is to identify smart money entry or exit and analyze market behavior in terms of hidden supply and demand.


