![VZO Signal Alerts Oscillator for MT5 Download – Free – [TradingFinder]](https://cdn.tradingfinder.com/image/445296/13-160-en-vzo-signal-alerts-mt5-01.webp)
![VZO Signal Alerts Oscillator for MT5 Download – Free – [TradingFinder] 0](https://cdn.tradingfinder.com/image/445296/13-160-en-vzo-signal-alerts-mt5-01.webp)
![VZO Signal Alerts Oscillator for MT5 Download – Free – [TradingFinder] 1](https://cdn.tradingfinder.com/image/441460/13-160-en-vzo-signal-alerts-mt5-02.webp)
![VZO Signal Alerts Oscillator for MT5 Download – Free – [TradingFinder] 2](https://cdn.tradingfinder.com/image/441465/13-160-en-vzo-signal-alerts-mt5-03.webp)
![VZO Signal Alerts Oscillator for MT5 Download – Free – [TradingFinder] 3](https://cdn.tradingfinder.com/image/441472/13-160-en-vzo-signal-alerts-mt5-04.webp)
TheVZO Signal Alert Indicator is developed based on the Volume Zone Oscillator (VZO) and is designed to identify potential trend reversal areas. By simultaneously analyzing trading volume and price fluctuations, this tool can detect overbought and oversold zones with high accuracy.
One of the key features of this indicator is the color change of the oscillator line based on trend direction.
VZO Signal Alert Oscillator Specifications Table
The following table provides detailed specifications of the VZO Indicator:
Indicator Categories: | Volume MT5 Indicators Oscillators MT5 Indicators Trading Assist MT5 Indicators |
Platforms: | MetaTrader 5 Indicators |
Trading Skills: | Intermediate |
Indicator Types: | Reversal MT5 Indicators |
Timeframe: | Multi-Timeframe MT5 Indicators |
Trading Style: | Swing Trading MT5 Indicators Scalper MT5 Indicators Day Trading MT5 Indicators |
Trading Instruments: | Forex MT5 Indicators Crypto MT5 Indicators Stock MT5 Indicators Commodity MT5 Indicators Indices MT5 Indicators Share Stock MT5 Indicators |
Overview of the VZO Volume Zone Oscillator
The VZO Signal Alert Oscillator not only displays volume changes, but also includes a Moving Average (MA) line displayed in blue. When the oscillator line crosses the MA line, it can be interpreted as a suitable entry signal.
Additionally, two static gray levels at +40 and -40 represent the overbought and oversold zones, respectively.
Bullish Trend Condition
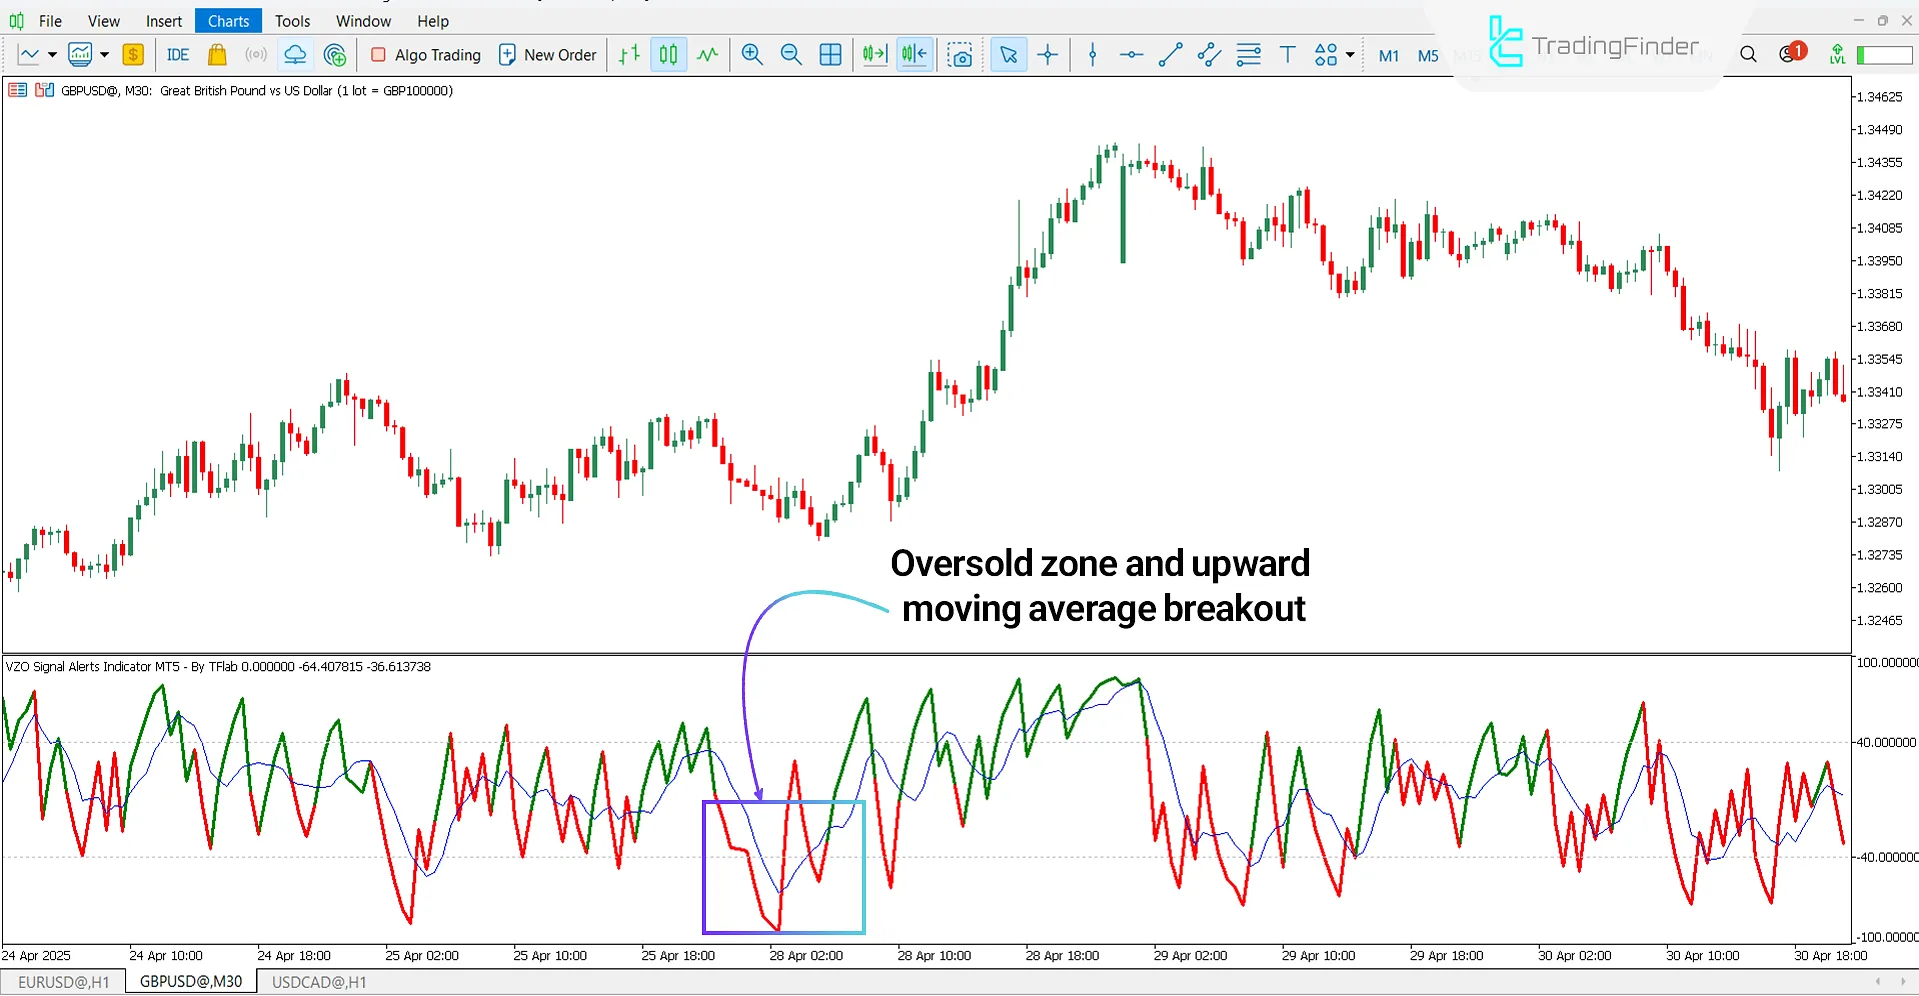
According to the 30-minute chart analysis of the GBP/USD pair, the oscillator line entered below the -40 level, indicating oversold conditions.
As shown in the chart, the line turned green and crossed above the blue moving average line. This bullish crossover is considered a potential buy entry signal.

Bearish Trend Condition
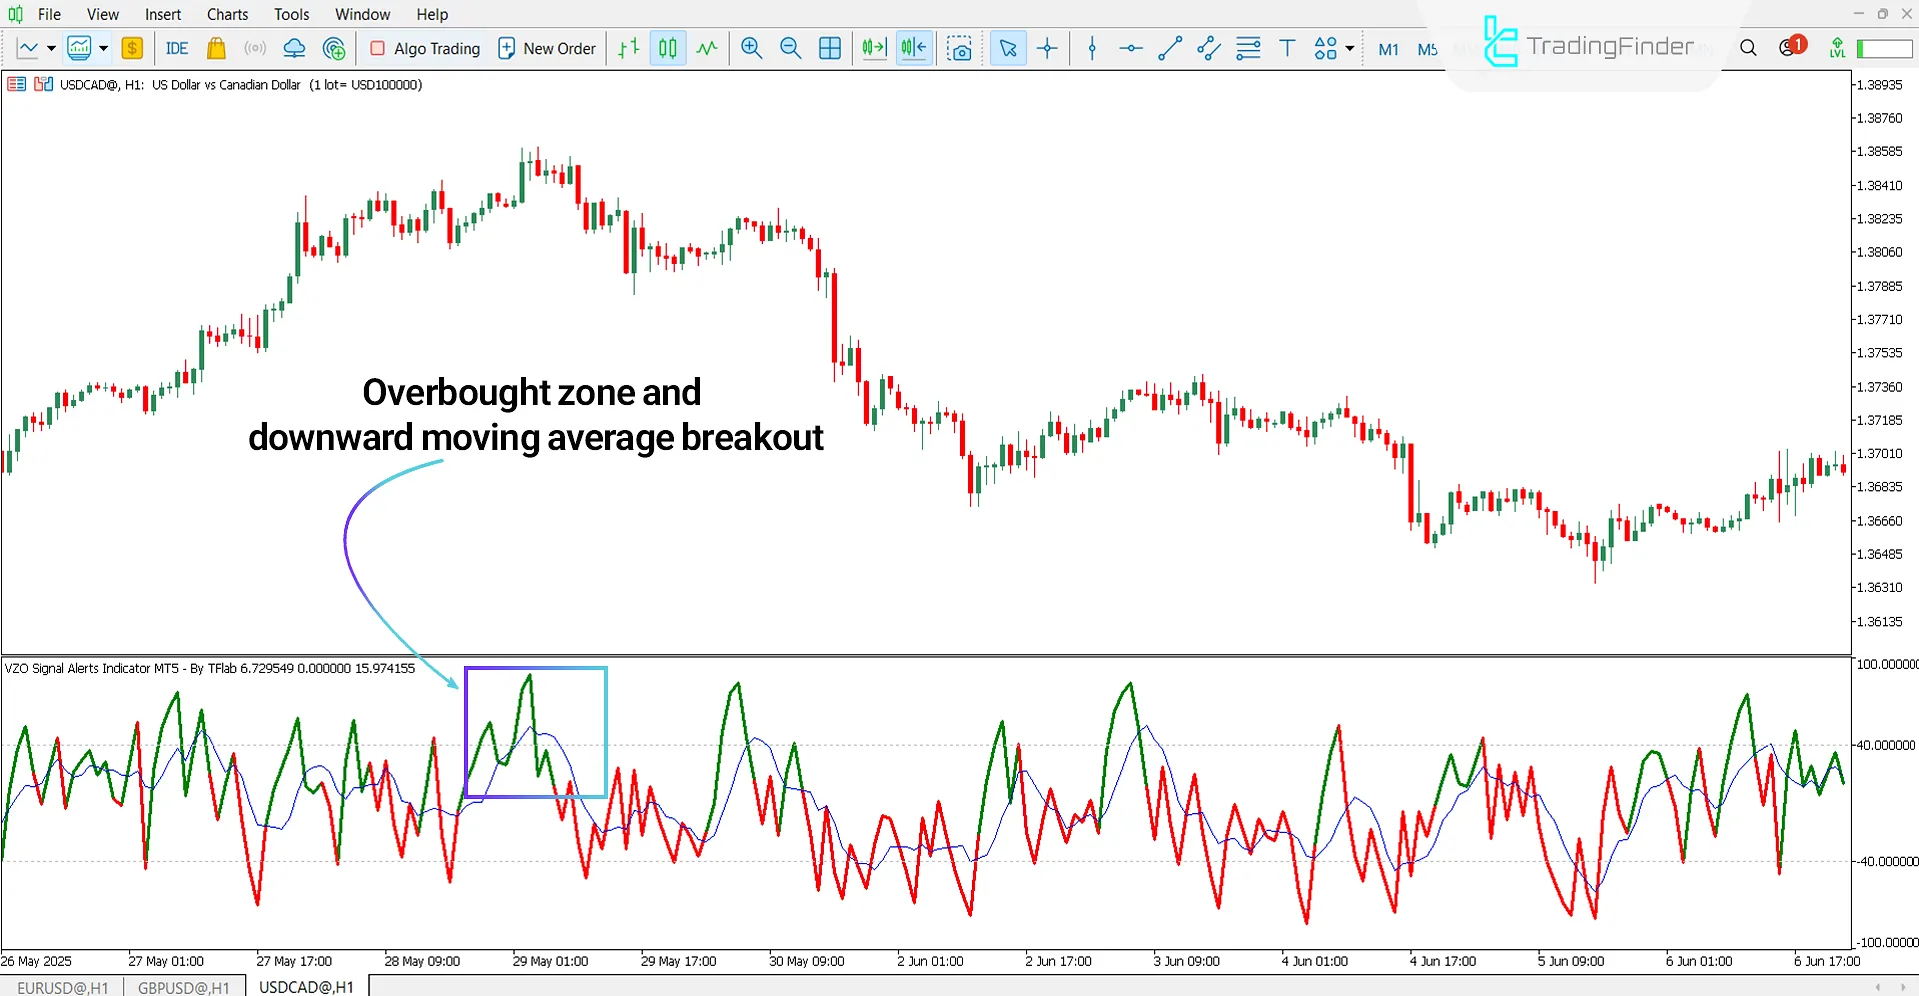
Based on the chart of the USD/CAD pair, after entering the -40 zone, the oscillator line reversed and moved downward, breaking below the moving average line. This movement reflects a strengthening bearish trend.

VZO Signal Alert Oscillator Settings
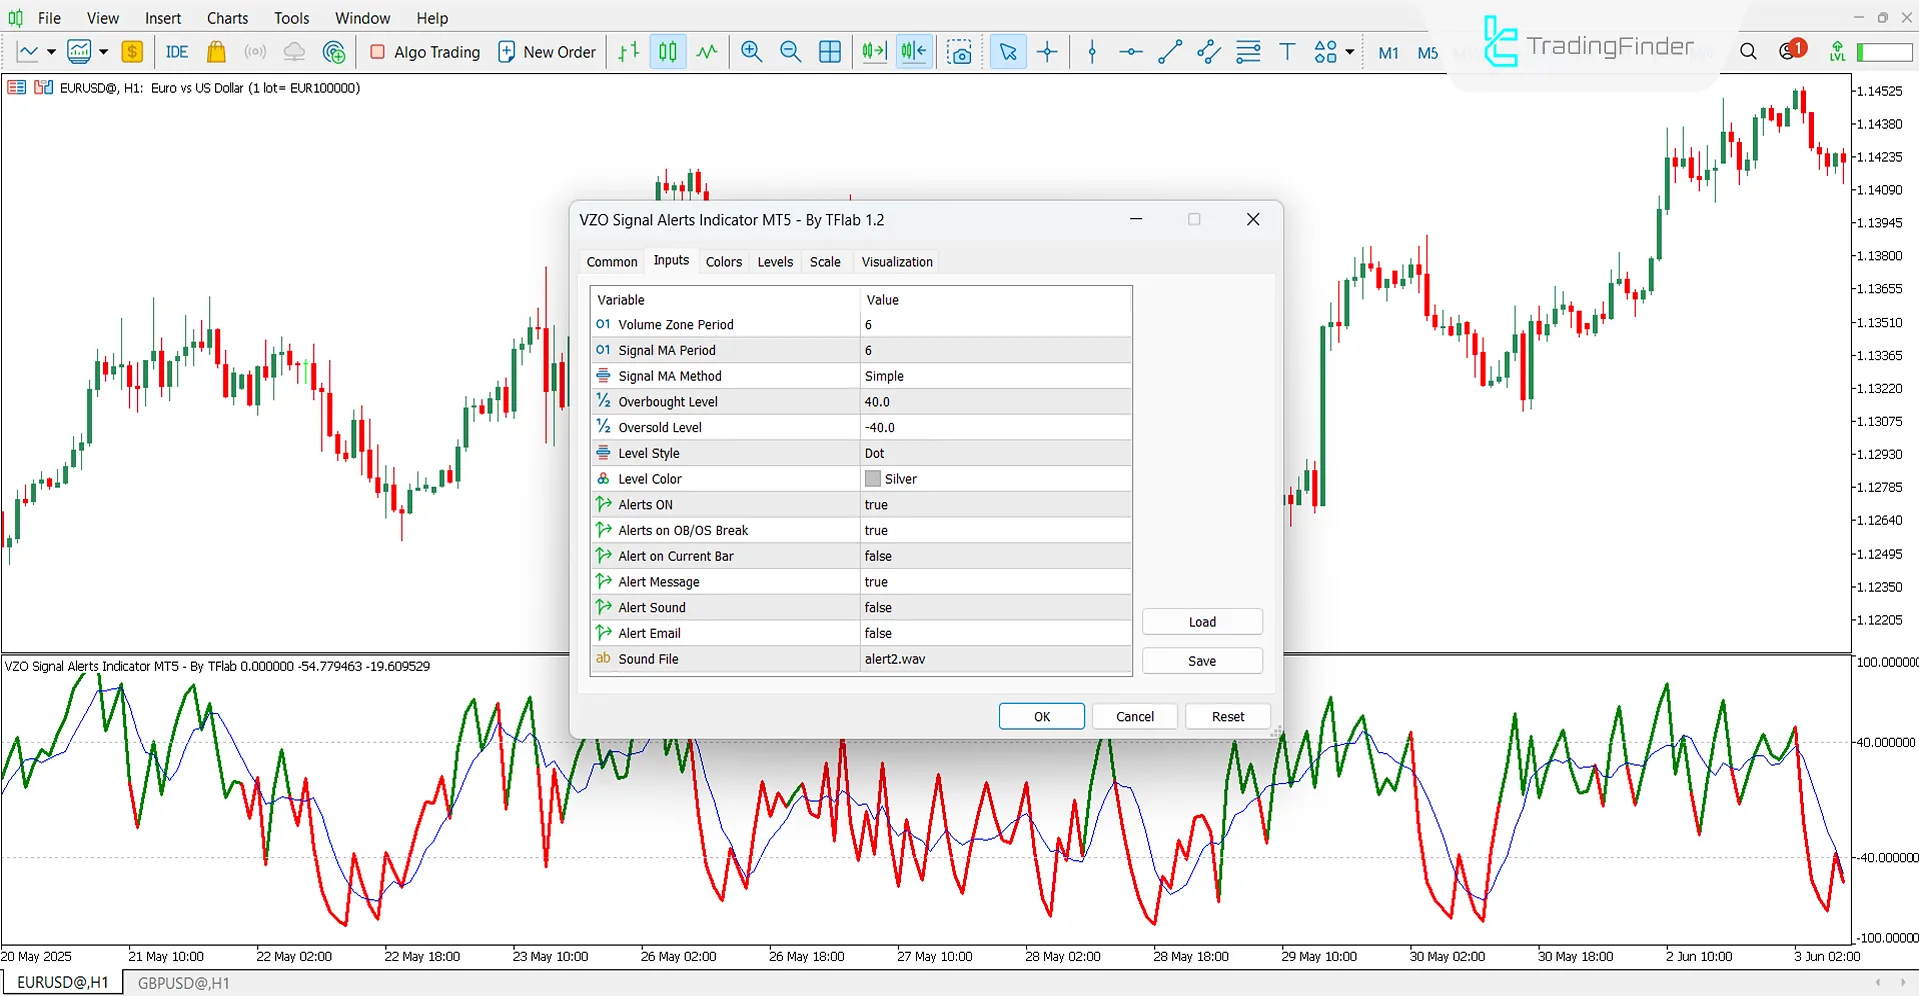
The image below shows the customizable settings of the VZO Signal Alert Indicator:

- Volume Zone Period: Period for calculating volume oscillations
- Signal MA Period: Period of the signal's moving average
- Signal MA Method: Type of moving average
- Overbought Level: Threshold for overbought condition
- Oversold Level: Threshold for oversold condition
- Level Style: Style for displaying horizontal levels
- Level Color: Color of overbought/oversold lines
- Alerts ON: Enable/disable alert system
- Alerts on OB/OS Break: Alert when entering OB/OS zones
- Alert on Current Bar: Alert on the currently forming candle
- Alert Message: Enable alert message pop-up
- Alert Sound: Play sound when signal occurs
- Alert Email: Enable email notifications
- Sound File: Audio file to be played for sound alerts
Conclusion
The VZO Signal Alert Oscillator enables identification of optimal entry and exit points by combining volume analysis with moving average crossover signals. It effectively highlights overbought and oversold areas, providing insight into potential trend reversals.
In this indicator, the crossing of the volume oscillator line with the moving average is considered a sign of trade entry or exit. When used alongside price action or candlestick pattern analysis, it significantly enhances the precision of technical analysis decision making.
VZO Signal Alerts Oscillator MT5 PDF
VZO Signal Alerts Oscillator MT5 PDF
Click to download VZO Signal Alerts Oscillator MT5 PDFWhat does it mean when the VZO oscillator line turns red?
A red oscillator line indicates a bearish market trend.
Is the VZO Signal Alert Indicator only usable in Forex markets?
No, it can be used across all markets, including crypto, stocks, and commodities.


