![Wave Dots Indicator for MT5 – Free Download [TradingFinder]](https://cdn.tradingfinder.com/image/556898/2-151-en-wave-dots-indicator-mt5-1.webp)
![Wave Dots Indicator for MT5 – Free Download [TradingFinder] 0](https://cdn.tradingfinder.com/image/556898/2-151-en-wave-dots-indicator-mt5-1.webp)
![Wave Dots Indicator for MT5 – Free Download [TradingFinder] 1](https://cdn.tradingfinder.com/image/556897/2-151-en-wave-dots-indicator-mt5-2.webp)
![Wave Dots Indicator for MT5 – Free Download [TradingFinder] 2](https://cdn.tradingfinder.com/image/556905/2-151-en-wave-dots-indicator-mt5-3.webp)
![Wave Dots Indicator for MT5 – Free Download [TradingFinder] 3](https://cdn.tradingfinder.com/image/556904/2-151-en-wave-dots-indicator-mt5-4.webp)
The Wave Dots Indicator in the MetaTrader 5 platform, with its internal algorithms, directly displays colored dots on the price chart.
These dots form around the market’s highs and lows and serve as a trend reversal signal as follows:
- Green Dot: formed below the chart, indicating oversold conditions along with the probability of a bullish move;
- Red Dot: positioned above the chart, showing overbought conditions along with the probability of a price decline.
Wave Dots Indicator Table
The main specifications of the Wave Dots Indicator are displayed in the table below.
Indicator Categories: | Signal & Forecast MT5 Indicators Trading Assist MT5 Indicators |
Platforms: | MetaTrader 5 Indicators |
Trading Skills: | Elementary |
Indicator Types: | Overbought & Oversold MT5 Indicators Reversal MT5 Indicators |
Timeframe: | Multi-Timeframe MT5 Indicators |
Trading Style: | Intraday MT5 Indicators |
Trading Instruments: | Forex MT5 Indicators Crypto MT5 Indicators Stock MT5 Indicators |
Wave Dots Indicator at a Glance
The Wave Dots Indicator in MetaTrader 5 is designed as an advanced technical analysis tool, with its primary goal being the precise identification of market reversal zones.
Using internal computational algorithms, this indicator plots colored dots on the price chart, allowing traders to detect momentum shifts as well as overbought and oversold conditions.
Indicator in Uptrend
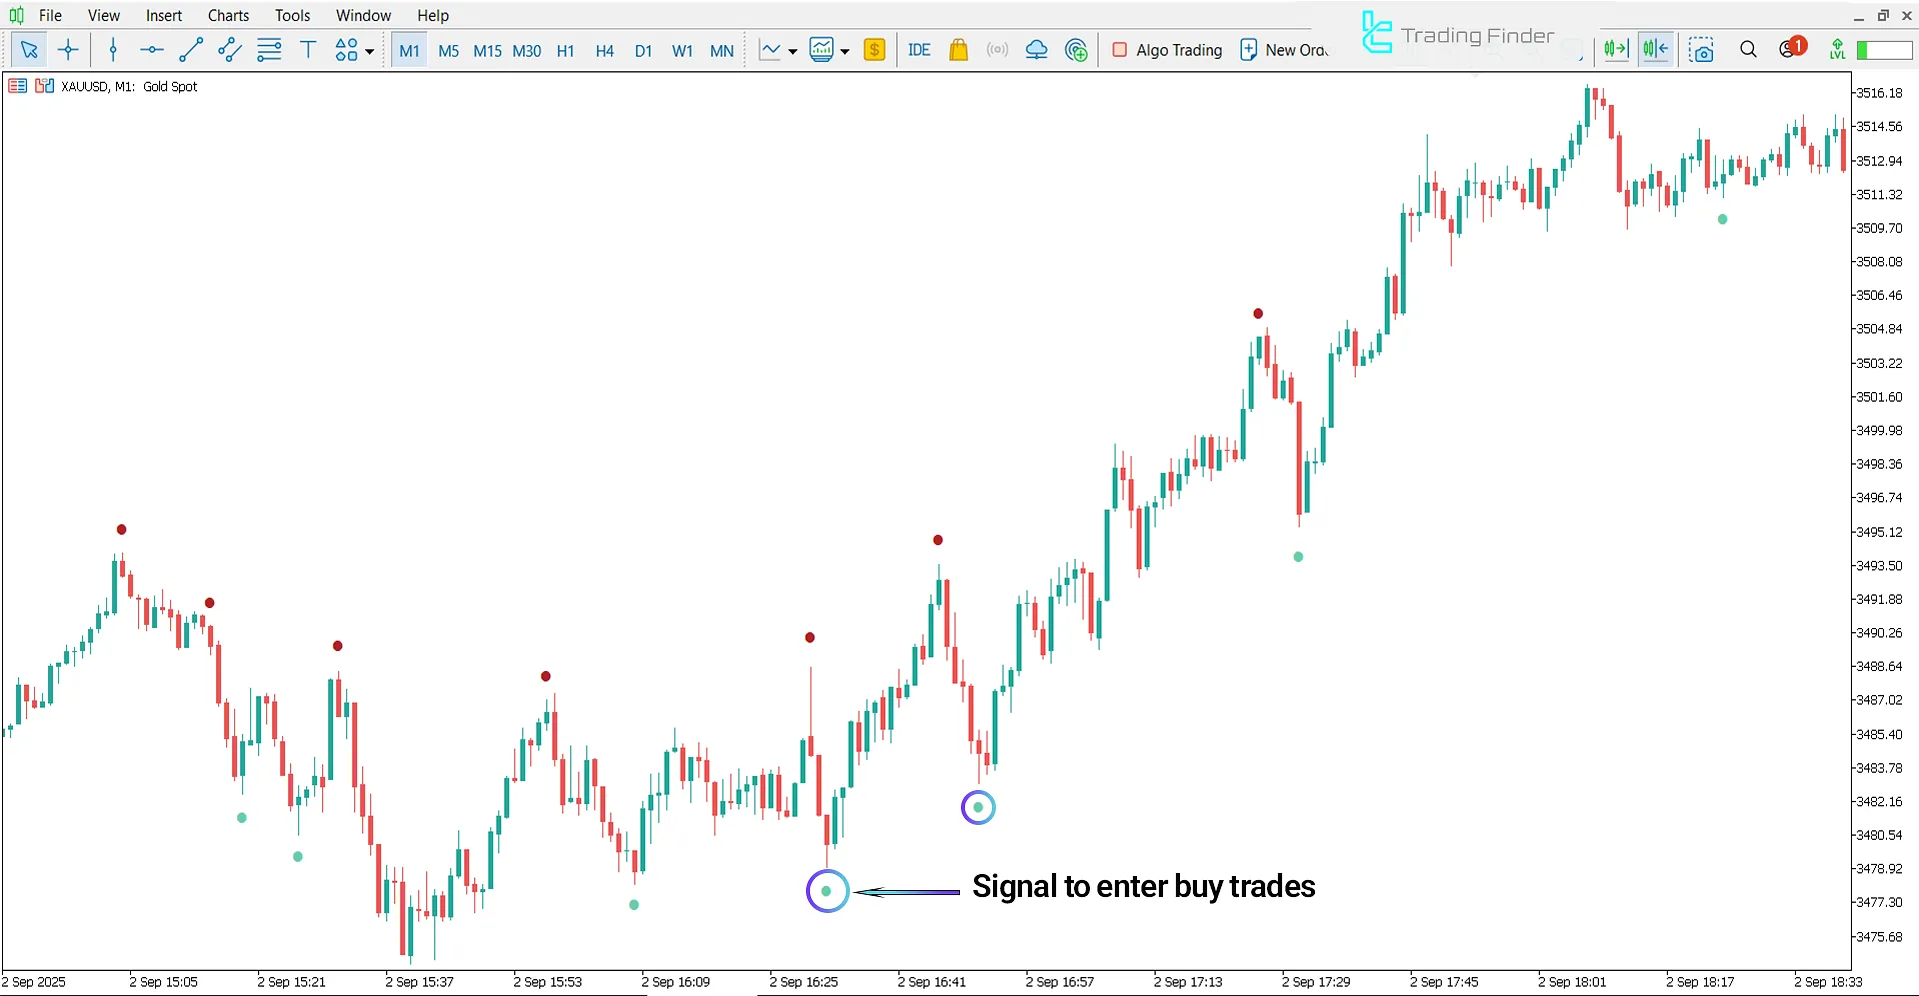
The chart below shows the global gold index (XAU/USD) in a 1-minute timeframe.
When green dots appear below the candles, the market enters an oversold phase. This condition indicates weakening selling pressure and a higher probability of bullish reversal, providing favorable conditions for entering buy trades.

Indicator in Downtrend
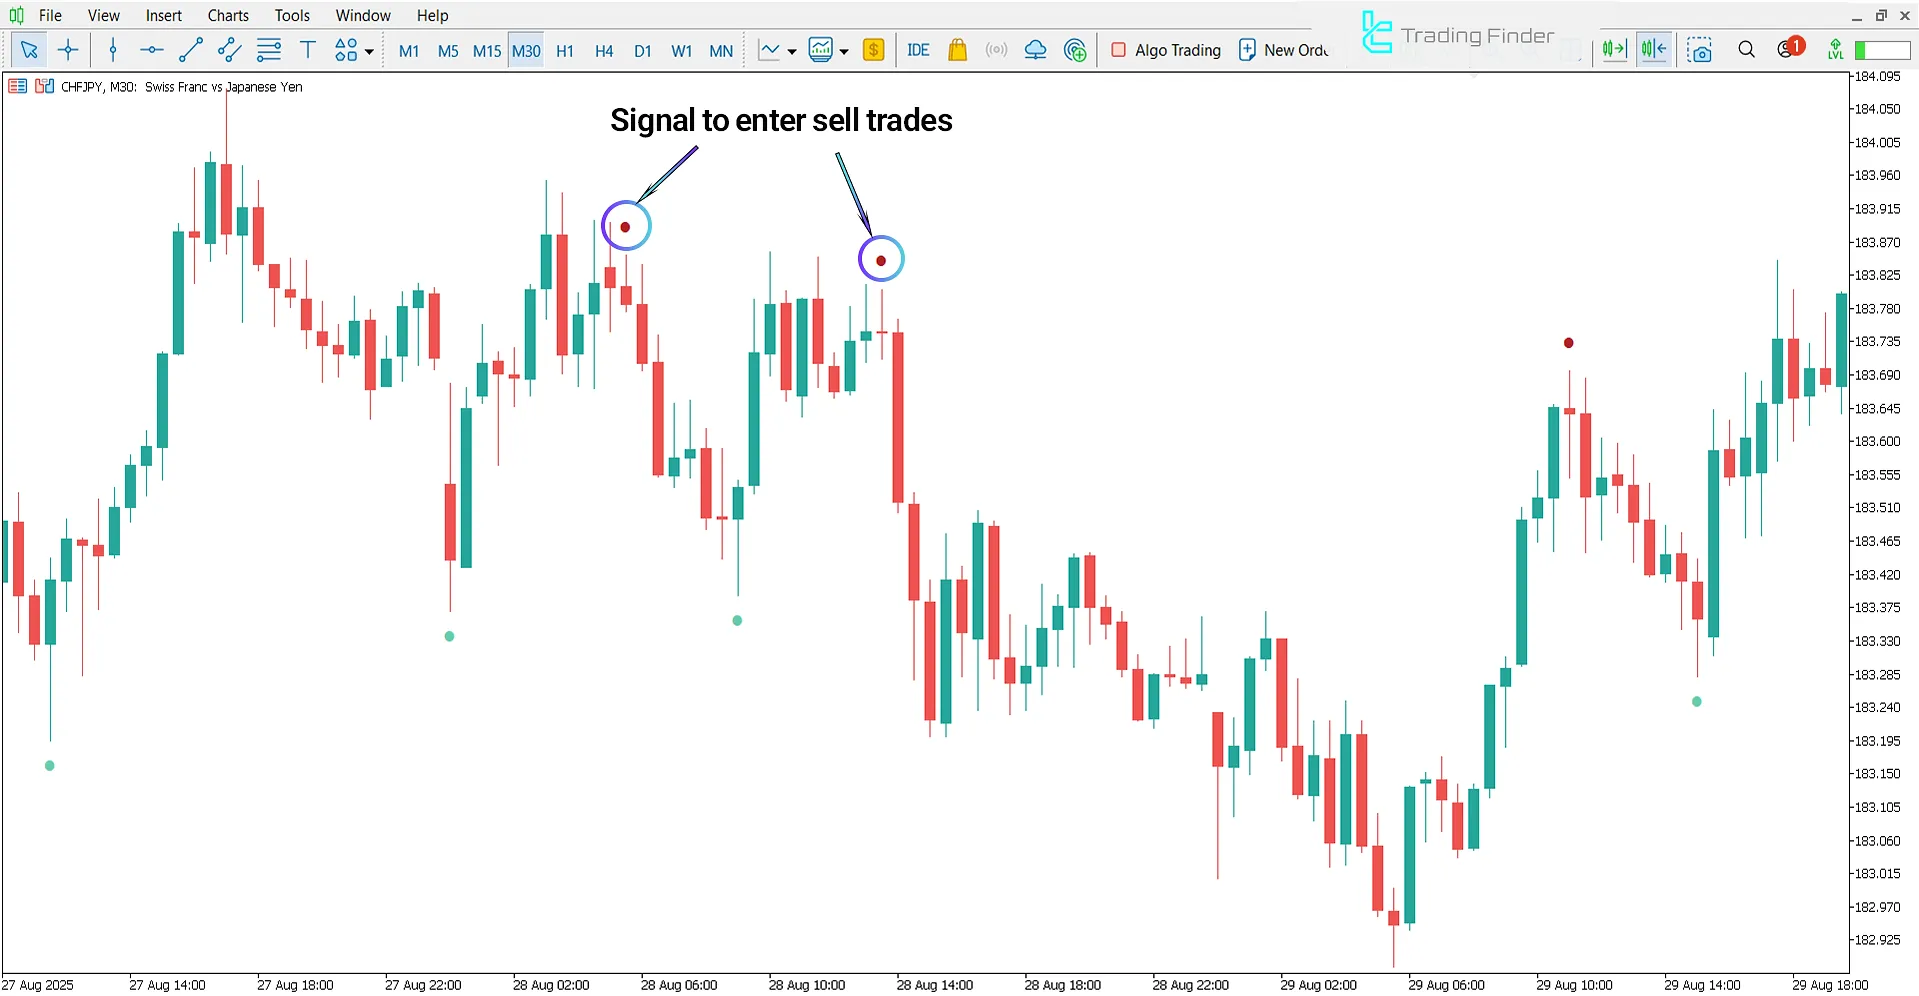
The chart below shows the Swiss Franc against the Japanese Yen in a 30-minute timeframe.
When the Wave Dots Indicator displays red dots above the candles, the market enters an overbought zone, signaling weakening bullish momentum. This condition can be considered a warning for the end of the bullish phase and the start of a corrective or bearish move.

Wave Dots Indicator Settings
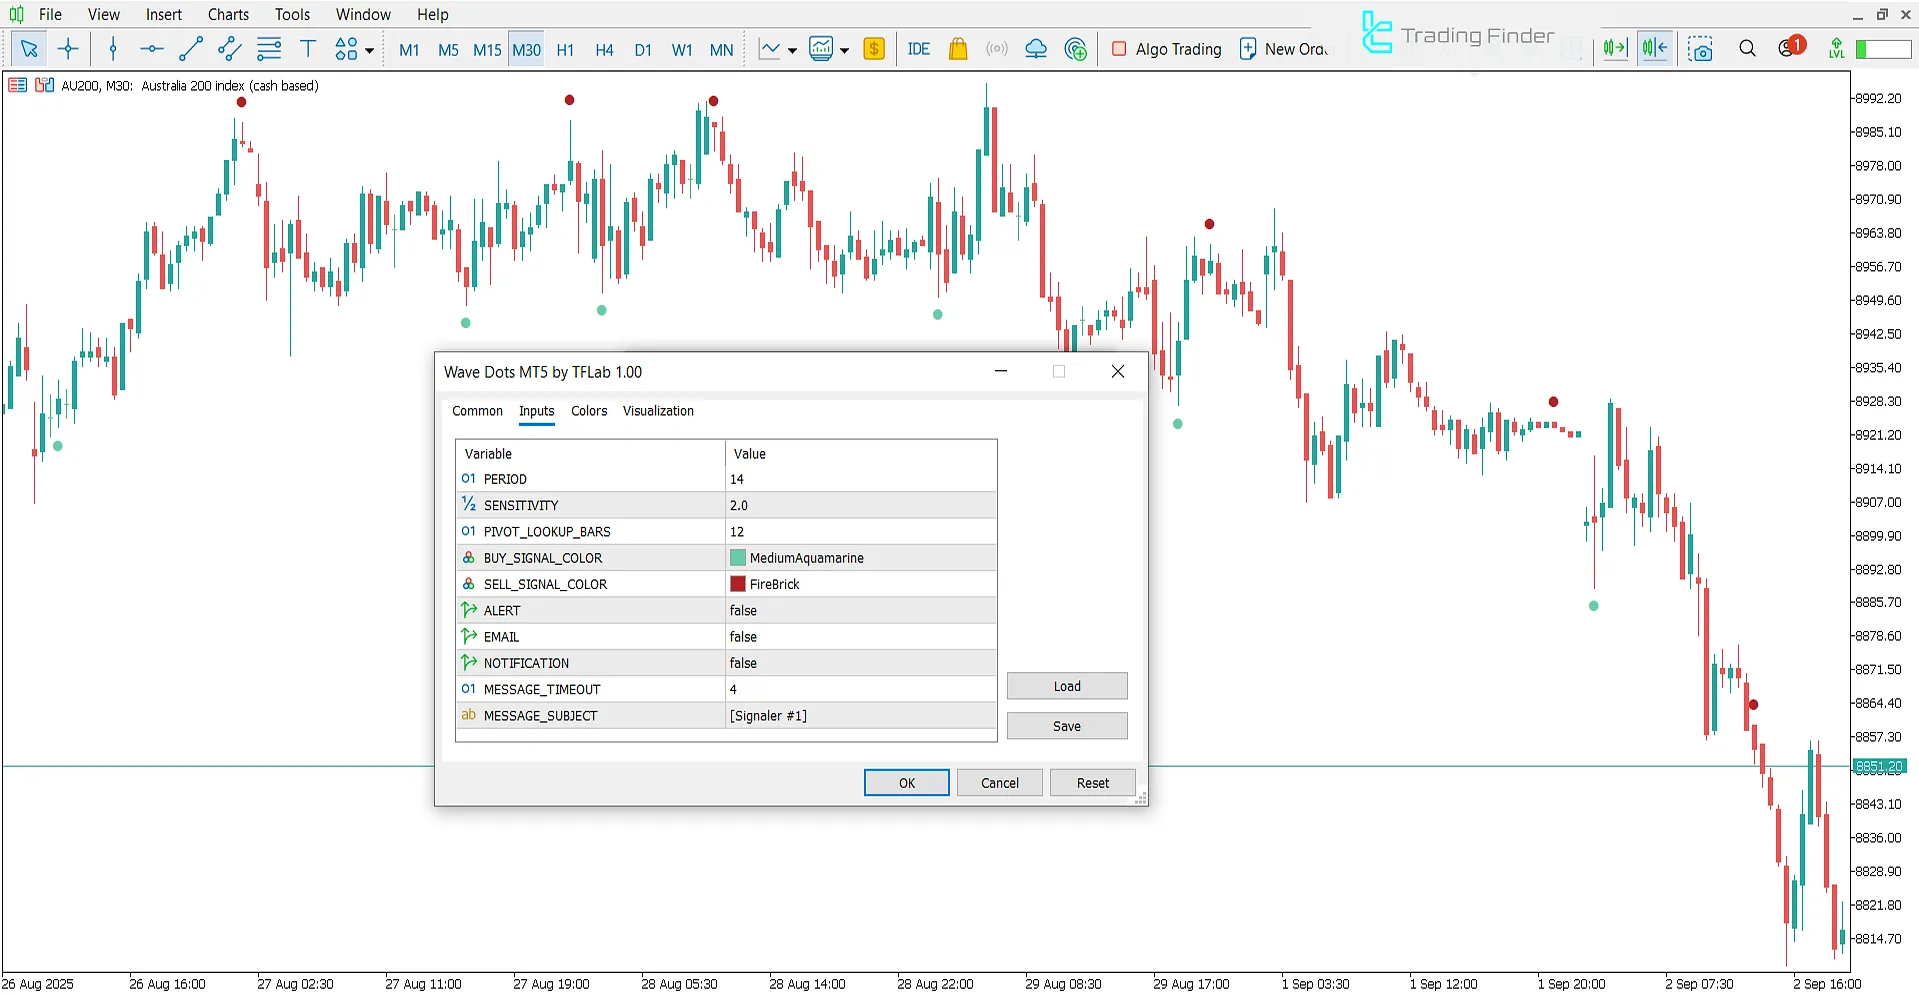
The image below shows the settings panel of the Wave Dots Indicator in the MetaTrader 5 platform:

- PERIOD: Time period
- SENSITIVITY: Sensitivity level
- PIVOT_LOOKUP_BARS: Number of candles checked for pivot detection
- BUY_SIGNAL_COLOR: Show buy signal color
- SELL_SIGNAL_COLOR: Shoow sell signal color
- ALERT: Display alert
- EMAIL: Send email
- NOTIFICATION: Mobile notification
- MESSAGE_TIMEOUT: Display message timeout
- MESSAGE_SUBJECT: Display message subject
Conclusion
The Wave Dots Indicator in technical analysis functions as a specialized tool for identifying market reversal points.
By plotting green dots in oversold zones and red dots in overbought zones, this indicator highlights potential trend reversal opportunities.
Wave Dots Indicator for MT5 PDF
Wave Dots Indicator for MT5 PDF
Click to download Wave Dots Indicator for MT5 PDFWhat is the use of the Wave Dots Indicator?
This indicator plots colored dots on the chart to mark overbought and oversold zones and shows the probability of market trend reversals.
What do green dots mean in the Wave Dots Indicator?
In this trading tool, green dots below the candles indicate oversold conditions along with the probability of a bullish price reversal.


