


![Williams %R Indicator for MT5 Download - Free - [TradingFinder]](https://cdn.tradingfinder.com/image/147382/13-47-en-williams-r-mt5-1.webp)
![Williams %R Indicator for MT5 Download - Free - [TradingFinder] 1](https://cdn.tradingfinder.com/image/147384/13-47-en-williams-r-mt5-2.webp)
![Williams %R Indicator for MT5 Download - Free - [TradingFinder] 2](https://cdn.tradingfinder.com/image/147383/13-47-en-williams-r-mt5-3.webp)
![Williams %R Indicator for MT5 Download - Free - [TradingFinder] 3](https://cdn.tradingfinder.com/image/147381/13-47-en-williams-r-mt5-4.webp)
The Williams %R Oscillator, available on MetaTrader 5, was developed by Larry Williams to measure Overbought and Oversold conditions in the market. This volatility indicator uses two dashed lines and operates on a scale from 0 to -100, identifying the price's position relative to these zones.
Indicator Specifications
Indicator Categories: | Oscillators MT5 Indicators Volatility MT5 Indicators Currency Strength MT5 Indicators |
Platforms: | MetaTrader 5 Indicators |
Trading Skills: | Intermediate |
Indicator Types: | Reversal MT5 Indicators |
Timeframe: | Multi-Timeframe MT5 Indicators |
Trading Style: | Intraday MT5 Indicators |
Trading Instruments: | Forex MT5 Indicators Crypto MT5 Indicators Stock MT5 Indicators Commodity MT5 Indicators Indices MT5 Indicators Share Stock MT5 Indicators |
Overview of the Indicator
The main oscillator line (blue line) oscillation reflects the market conditions for overbought and oversold. The dashed lines indicate:
- Upper Dashed Line: Ranges from 0 to -20, marking the Overbought zone
- Lower Dashed Line: Ranges from -80 to -100, marking the Oversold zone
Price movements within these zones signal potential reversals in the opposite direction.
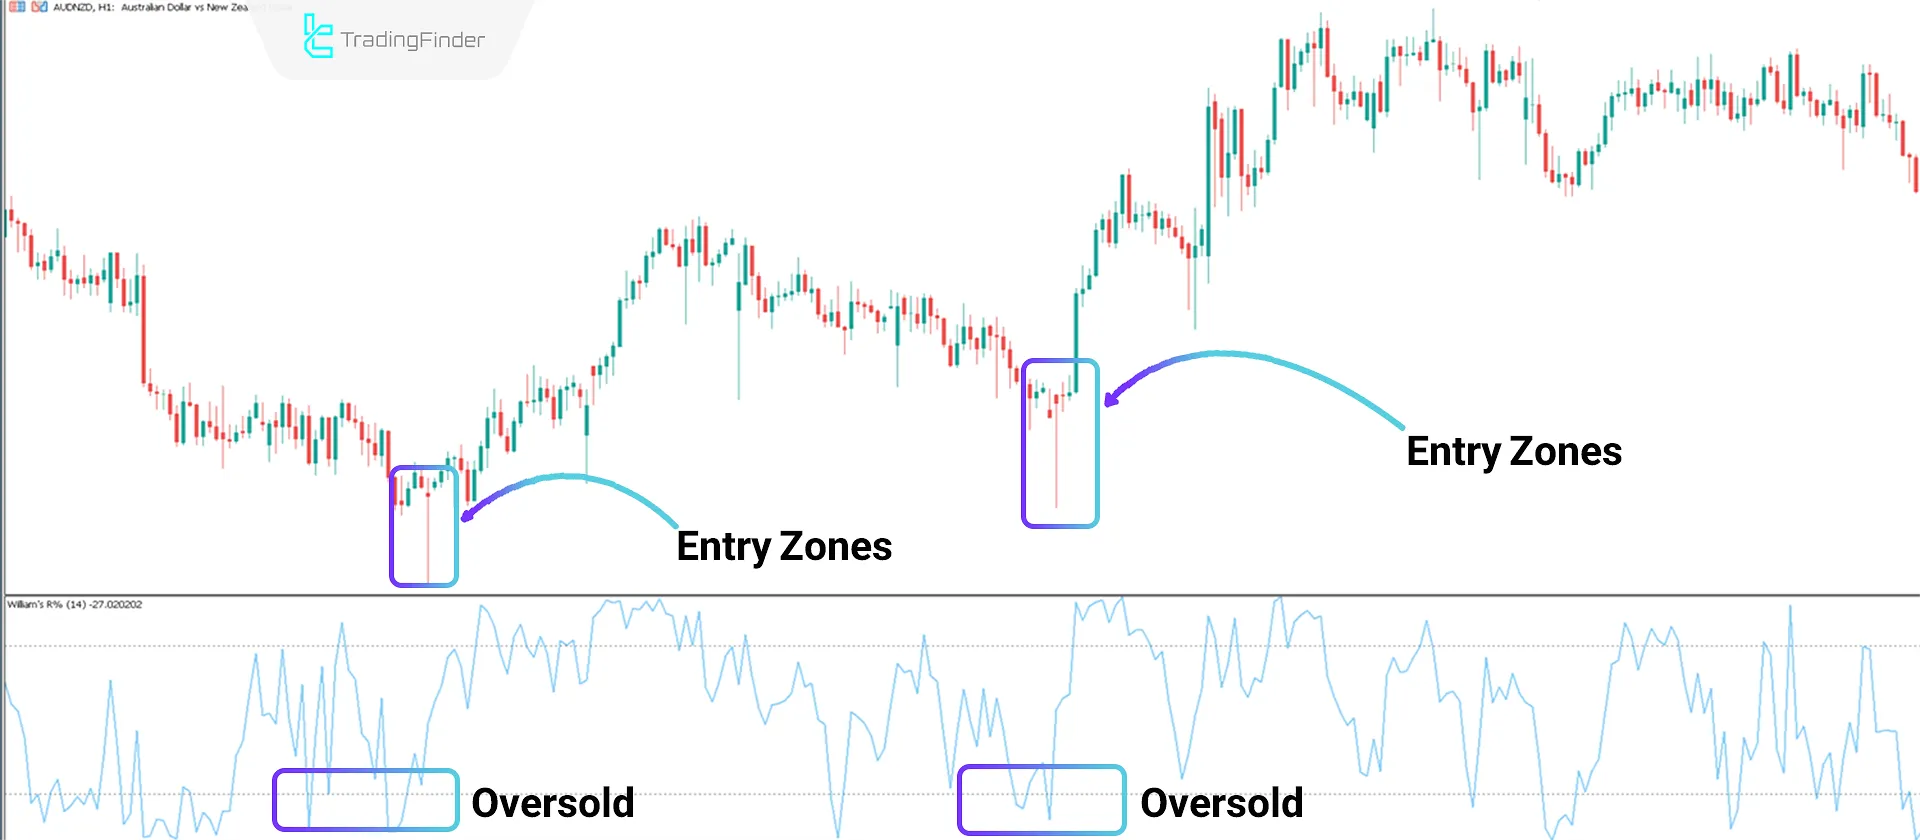
Performance in a Bullish Trend
Analyzing the AUD/NZD currency pair's 1-hour price chart demonstrates the indicator's performance in a bullish trend.
The -80 to -100 range highlights Oversold zones. During such conditions, a trend reversal in the opposite direction is expected.
Performance in a Bearish Trend
The 4-hour Bitcoin price chart (BTC) demonstrates the indicator's performance in bearish trend conditions.
The 0 to -20 range highlights Overbought zones. In these conditions, a trend reversal in the opposite direction is expected.
Indicator Settings
- Chart Theme: Indicator theme;
- Period: The number of periods used to calculate the oscillator line is set to 14.
Conclusion
The Williams %R Indicator is a practical tool for identifying Overbought and Oversold zones.
The regions drawn by this trading tool represent potential trend reversal areas. Traders can use the oscillations of the main oscillator line within the dashed lines as signals for entering trades.
Williams R MT5 PDF
Williams R MT5 PDF
Click to download Williams R MT5 PDFDoes this indicator work for long-term timeframes?
Yes, this multi-timeframe indicator can be applied across all time intervals.
How can reversal zones be identified using this indicator?
Traders can identify potential trend reversal areas by observing the oscillations of the main indicator line within the Overbought and Oversold zones.


