![Yefekt Oscillator for MT5 Download – Free – [TradingFinder]](https://cdn.tradingfinder.com/image/644138/13-242-en-yefekt-mt5-01.webp)
![Yefekt Oscillator for MT5 Download – Free – [TradingFinder] 0](https://cdn.tradingfinder.com/image/644138/13-242-en-yefekt-mt5-01.webp)
![Yefekt Oscillator for MT5 Download – Free – [TradingFinder] 1](https://cdn.tradingfinder.com/image/644140/13-242-en-yefekt-mt5-02.webp)
![Yefekt Oscillator for MT5 Download – Free – [TradingFinder] 2](https://cdn.tradingfinder.com/image/644137/13-242-en-yefekt-mt5-03.webp)
The Yefekt Indicator is used in technical analysis as a tool for identifying the current price trend condition. This indicator visually represents bullish or bearish market sentiment through colored bars.
Its foundation is based on price action, and the histograms are drawn according to defined boundaries; where the +0.5 level is considered the bullish zone and the –0.5 level represents the bearish zone.
Yefekt Oscillator Specification Table
The specifications of the Yefekt Indicator are presented in the table below:
Indicator Categories: | Price Action MT5 Indicators Signal & Forecast MT5 Indicators Trading Assist MT5 Indicators |
Platforms: | MetaTrader 5 Indicators |
Trading Skills: | Elementary |
Indicator Types: | Reversal MT5 Indicators |
Timeframe: | Multi-Timeframe MT5 Indicators |
Trading Style: | Swing Trading MT5 Indicators Scalper MT5 Indicators Day Trading MT5 Indicators |
Trading Instruments: | Forex MT5 Indicators Crypto MT5 Indicators Stock MT5 Indicators Commodity MT5 Indicators Indices MT5 Indicators Share Stock MT5 Indicators |
Yefekt Indicator at a Glance
The Yefekt Oscillator determines the market direction by using histograms formed in the positive and negative areas.
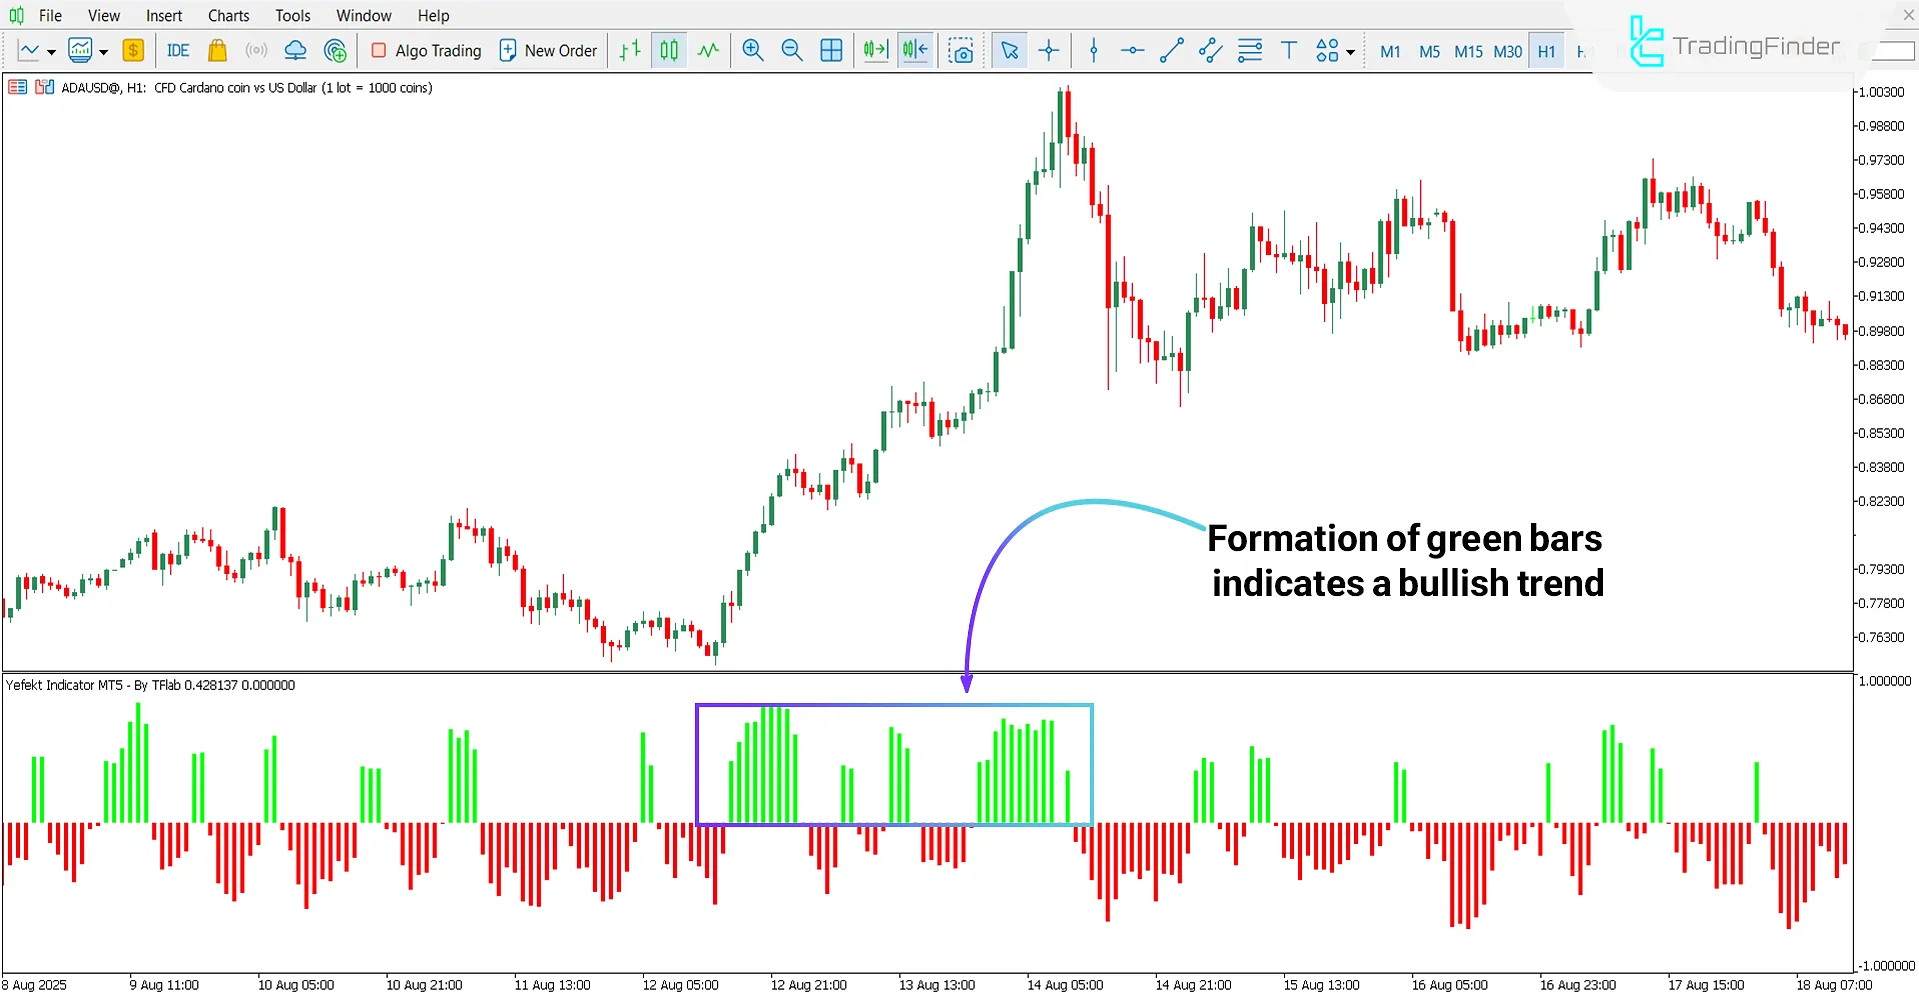
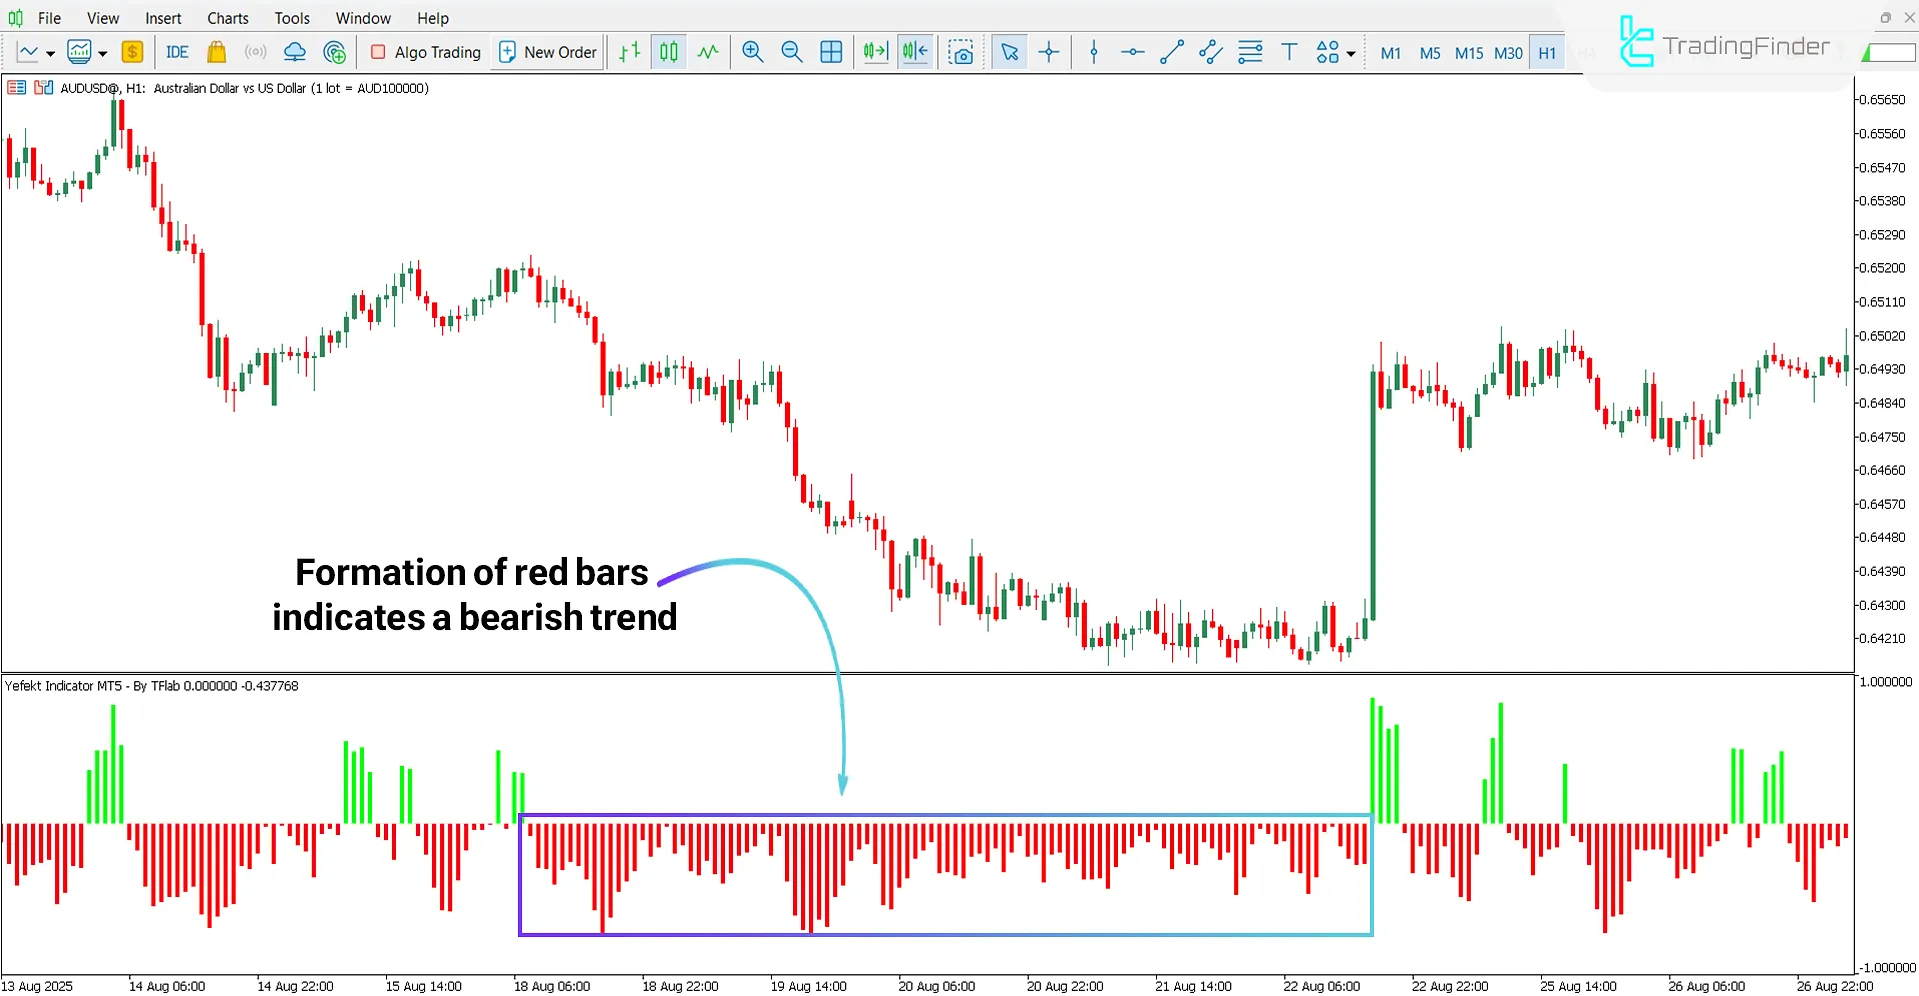
Bars positioned in the positive zone are shown in green and indicate a bullish trend, while bars in the negative zone appear red, revealing a bearish trend.
Bullish Trend Conditions
According to the 1-hour Cardano (ADA) cryptocurrency chart, the appearance of green bars in the positive zone signifies an upward market movement.
The continuous formation of tall green bars reflects strong buying pressure and indicates the persistence of the bullish trend within the given timeframe.

Bearish Trend Conditions
Based on the 1-hour AUD/USD chart, the indicator reveals the downward trend by displaying red bars.
Longer red bars represent increased selling pressure, and their repeated formation demonstrates the stability and continuation of the bearish movement.

Conclusion
The Yefekt Oscillator is designed to identify potential price reversal points and displays bullish or bearish market conditions through green and red bars.
In this tool, the +0.5 and –0.5 levels act as the main boundaries for potential price direction changes.
The histograms are plotted based on price action, and the accuracy of the signals is considerably higher in trending markets.
Yefekt Oscillator for MT5 PDF
Yefekt Oscillator for MT5 PDF
Click to download Yefekt Oscillator for MT5 PDFHow does this oscillator display the trend?
The Yefekt Indicator visualizes price trend changes using oscillator bars.
Is this tool effective in ranging markets?
No, the Yefekt Oscillator provides more reliable signals in trending market conditions.


