![ZigZag Indicator for MetaTrader 5 - Download - Free - [TF Lab]](https://cdn.tradingfinder.com/image/107568/10-34-en-zigzag-mt5-1.webp)
![ZigZag Indicator for MetaTrader 5 - Download - Free - [TF Lab] 0](https://cdn.tradingfinder.com/image/107568/10-34-en-zigzag-mt5-1.webp)
![ZigZag Indicator for MetaTrader 5 - Download - Free - [TF Lab] 1](https://cdn.tradingfinder.com/image/41606/10-34-en-zigzag-mt5-02.avif)
![ZigZag Indicator for MetaTrader 5 - Download - Free - [TF Lab] 2](https://cdn.tradingfinder.com/image/41608/10-34-en-zigzag-mt5-03.avif)
![ZigZag Indicator for MetaTrader 5 - Download - Free - [TF Lab] 3](https://cdn.tradingfinder.com/image/41614/10-34-en-zigzag-mt5-05.avif)
The ZigZag Indicator is one of the indicators in MetaTrader 5 that is useful for identifying the troughs and peaks of a chart. This indicator determines and marks the pivot points in price, known as Pivot Highs and Lows (HH-HL-LH-LL), on the chart.
In any price chart, peaks and troughs are formed consecutively, and correctly understanding them helps to determine the direction of the primary (Trend) or short-term market trend.
Major Pivot Highs and Lows indicate key turning points and the primary market trend, while Minor Pivot Highs and Lows show minor turning points and short-term market trends.
Indicator Table
Indicator Categories: | Pivot Points & Fractals MT5 Indicators Support & Resistance MT5 Indicators Levels MT5 Indicators |
Platforms: | MetaTrader 5 Indicators |
Trading Skills: | Elementary |
Indicator Types: | Lagging MT5 Indicators Reversal MT5 Indicators |
Timeframe: | Multi-Timeframe MT5 Indicators |
Trading Style: | Swing Trading MT5 Indicators Scalper MT5 Indicators Day Trading MT5 Indicators Fast Scalper MT5 Indicators |
Trading Instruments: | Forex MT5 Indicators Crypto MT5 Indicators Stock MT5 Indicators Commodity MT5 Indicators Indices MT5 Indicators Share Stock MT5 Indicators |
Major Pivots (Key Turning Points)
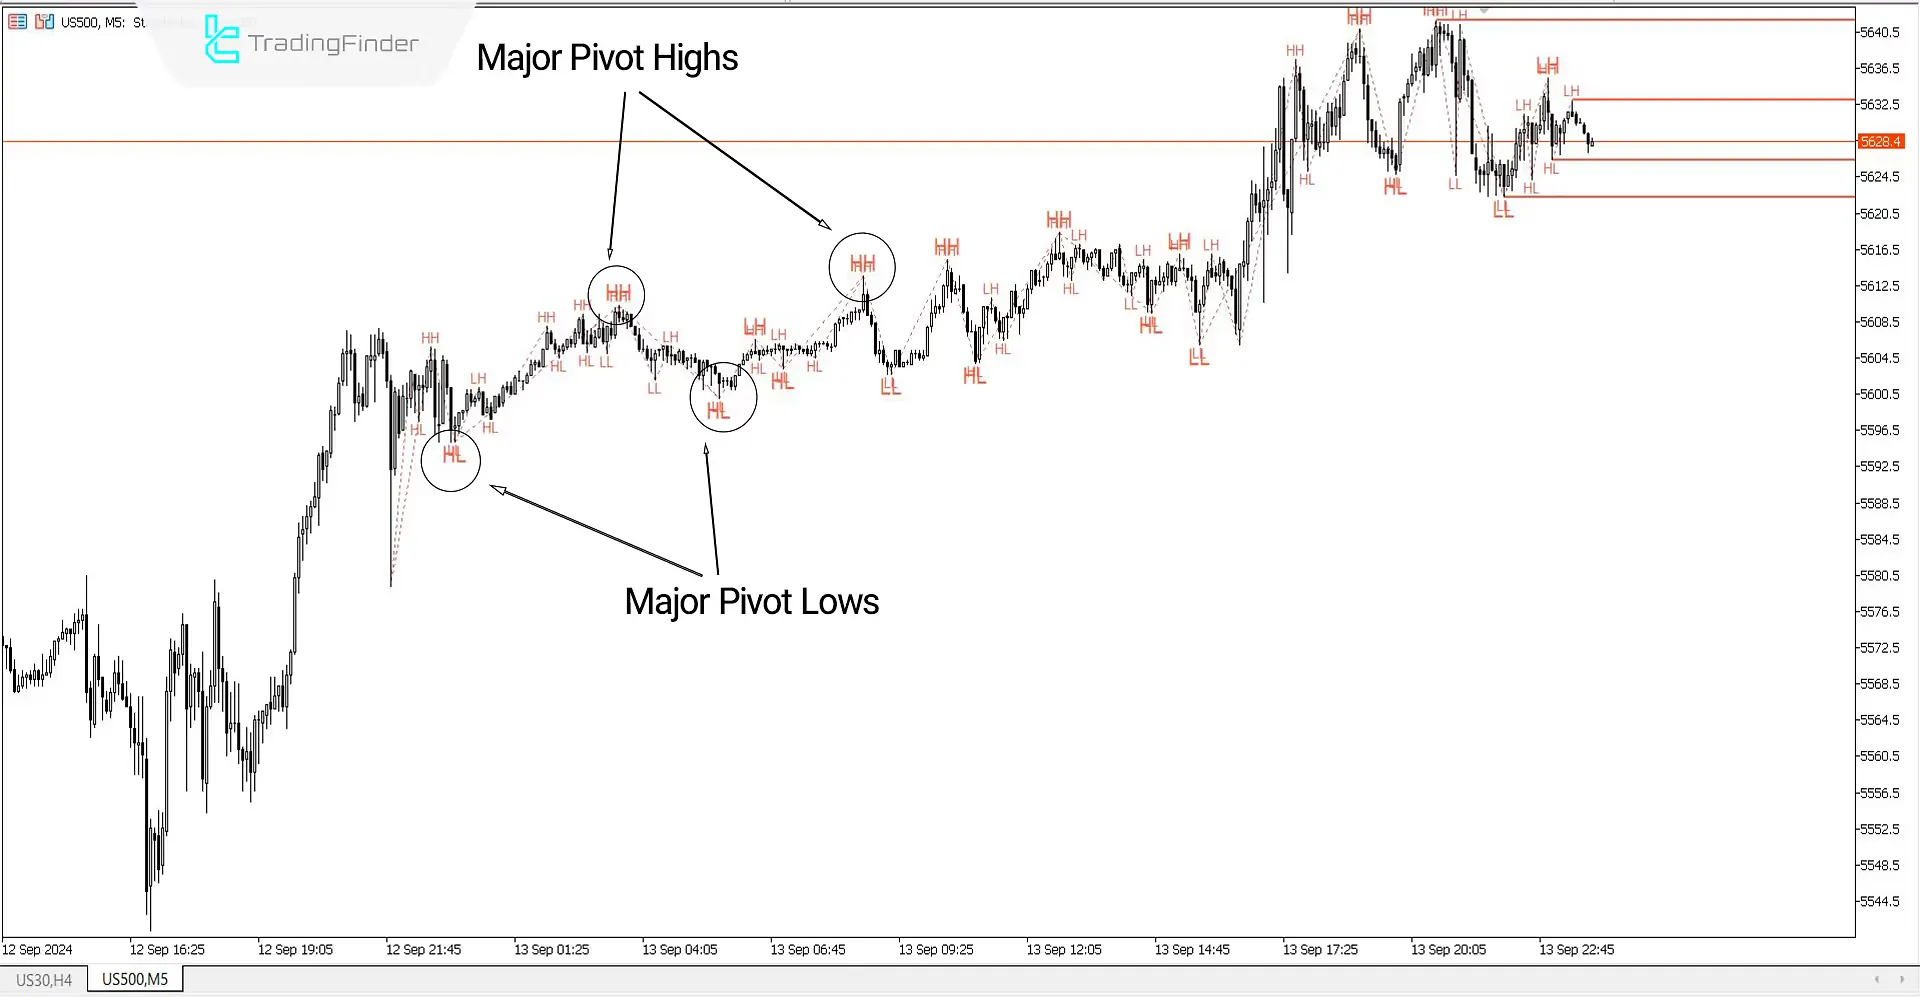
The image below shows the S&P 500 index chart with the symbol (US500) in the 5-minute time frame. As shown in the picture, in an uptrend, the indicator displays Major Pivot Lows (critical and significant troughs) with (HL) and in a larger size.
It also shows Major Pivot Highs (critical and prominent peaks) with (HH) and in a larger size.

Minor Pivots (Minor Turning Points)
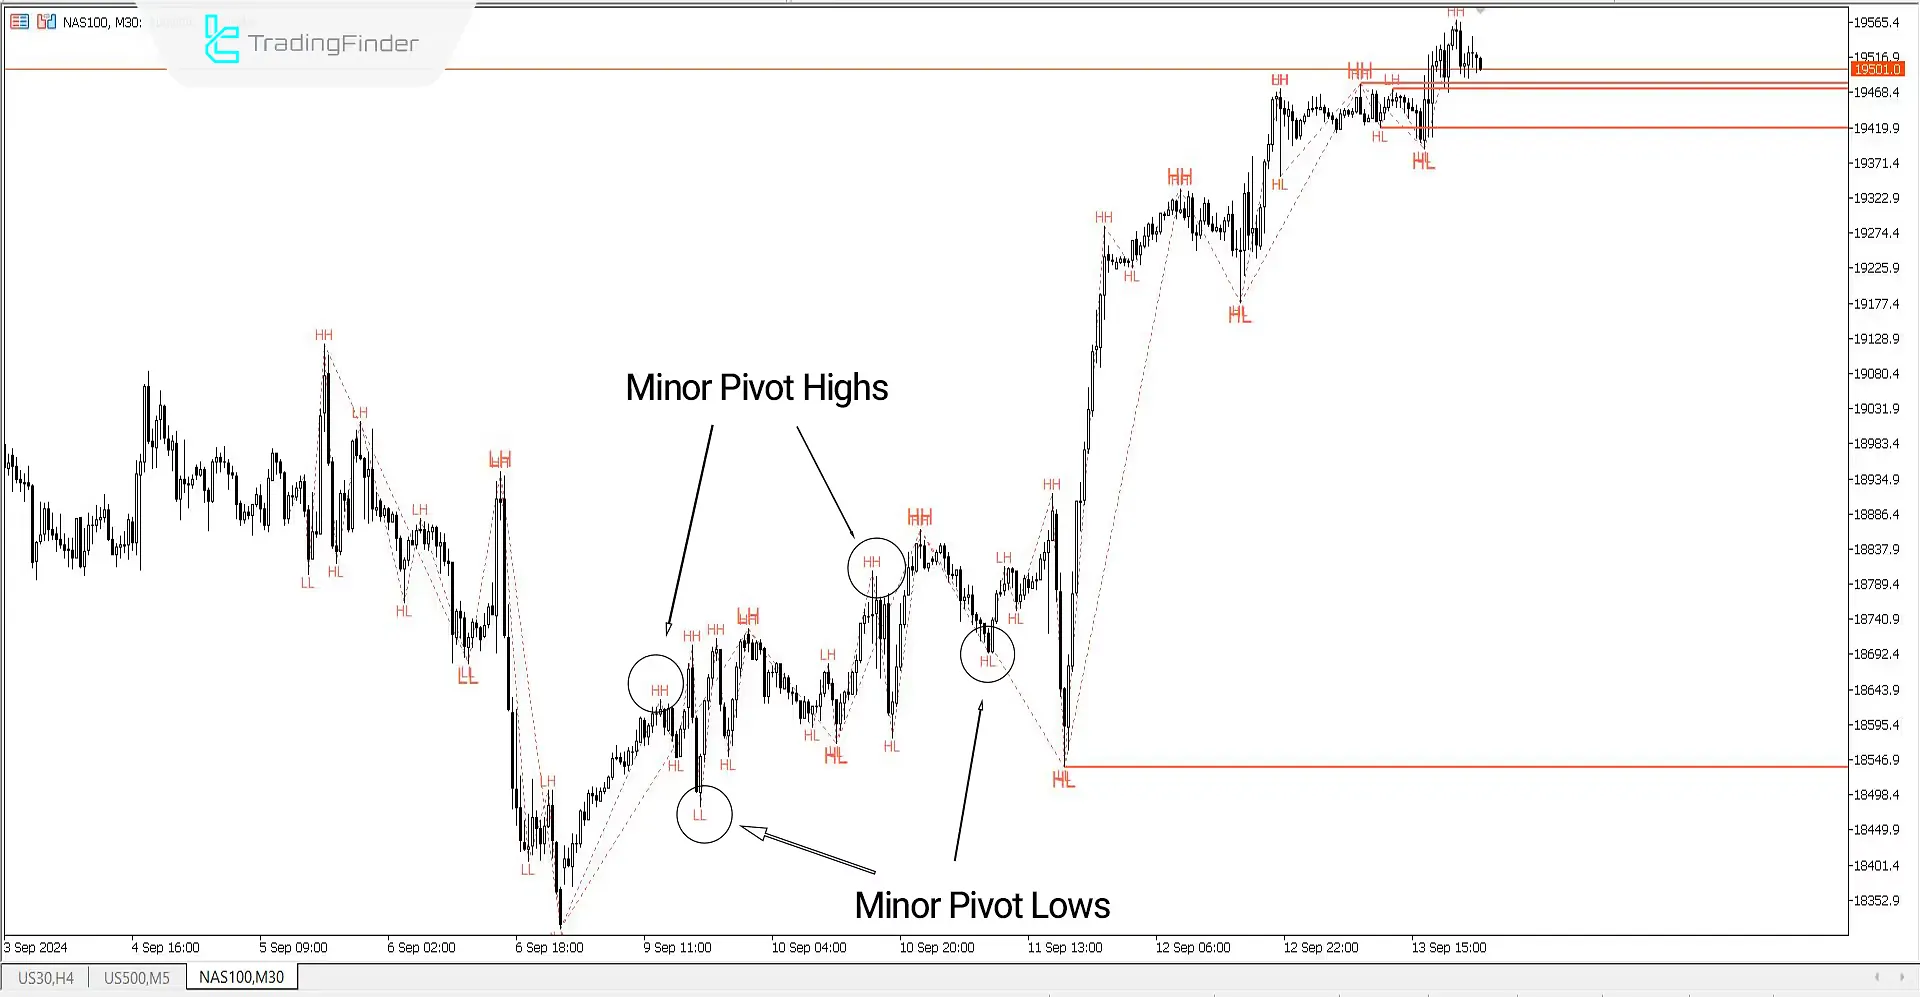
The image below shows the NASDAQ index chart with the symbol (NAS100) in the 30-minute. As shown in the picture, the indicator shows Minor Pivot Lows (minor troughs) with (HL-LL) in a smaller size.
It also indicates Minor Pivot Highs (minor peaks) with (HH-LH) in a smaller size. In this way, all small and minor turns between two major pivots can be identified.

Support and Resistance Levels
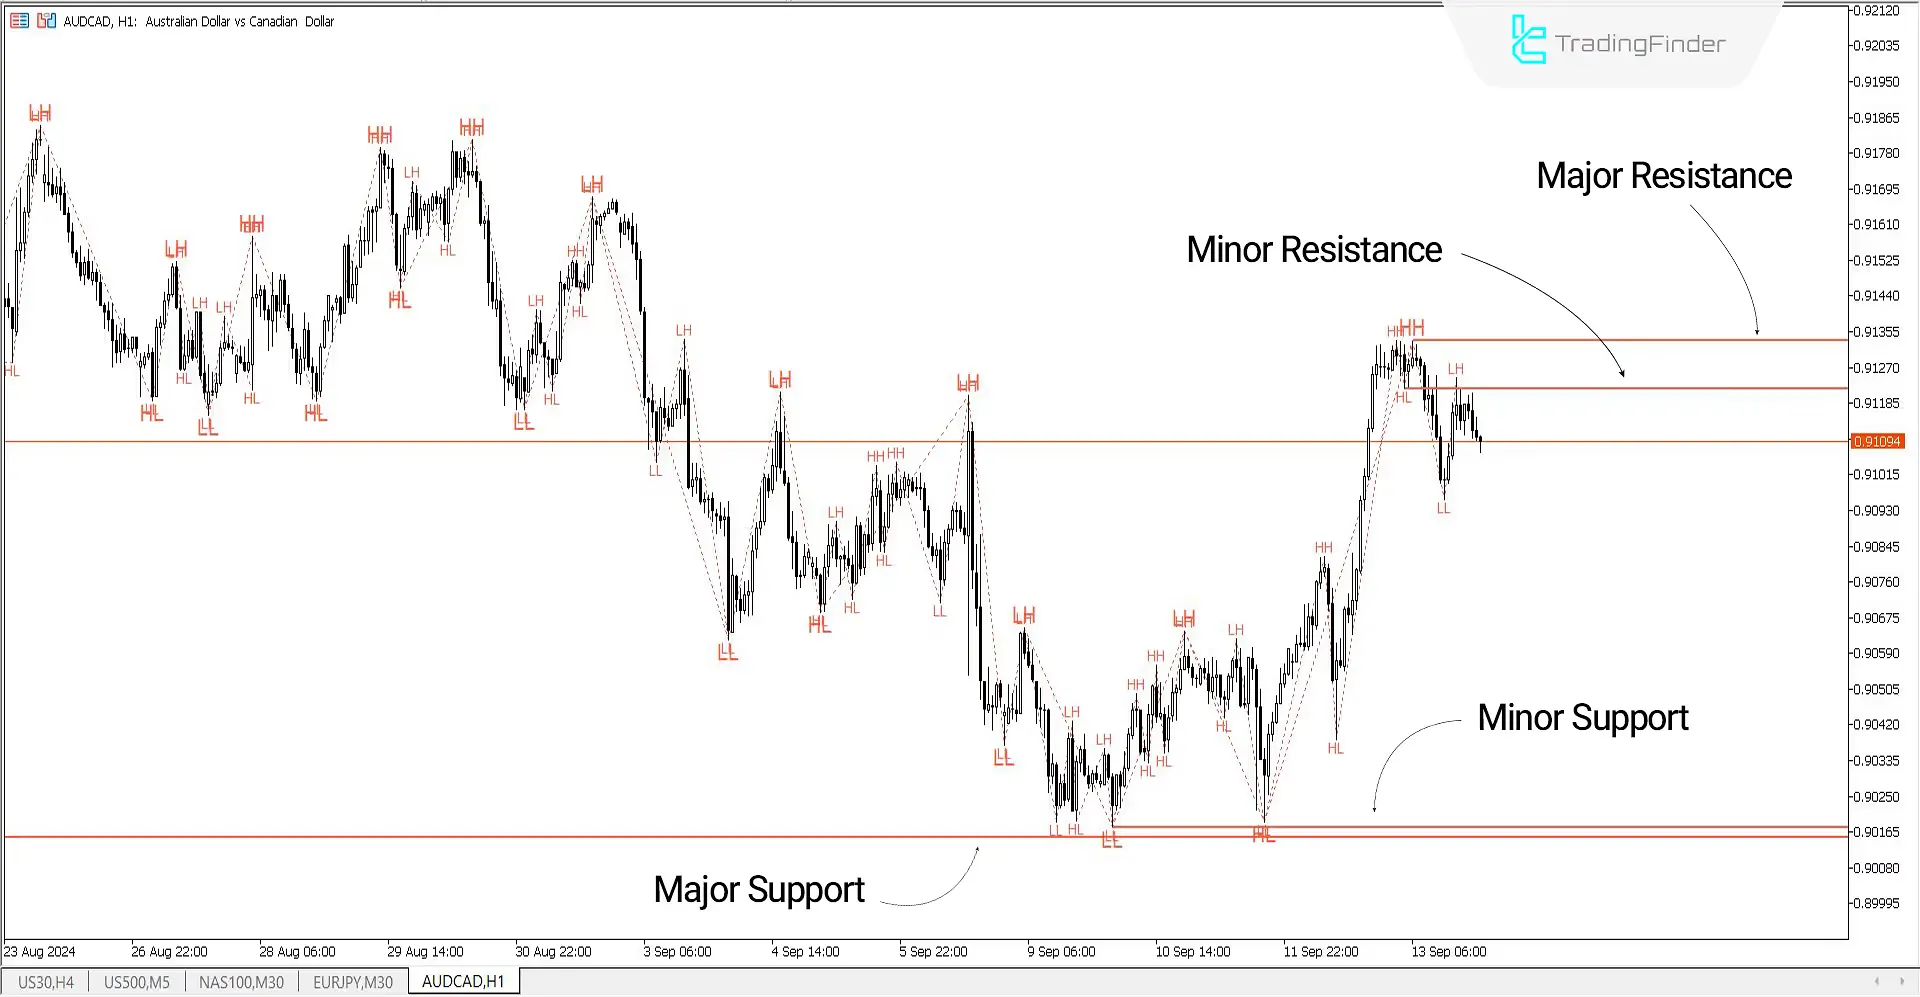
The image below shows the chart of the AUD/CAD currency pair with the symbol (AUDCAD) in the 1-hour time frame. The ZigZag indicator, based on the latest Major Pivot Highs and Lows (large), identifies the primary support and resistance levels.
It also draws short-term and minor support and resistance levels using the latest Minor Pivots, and traders can use them alongside their trading strategy.

Indicator Settings

Display Setting
- Theme: Customize the background settings as desired
ZigZag Setting
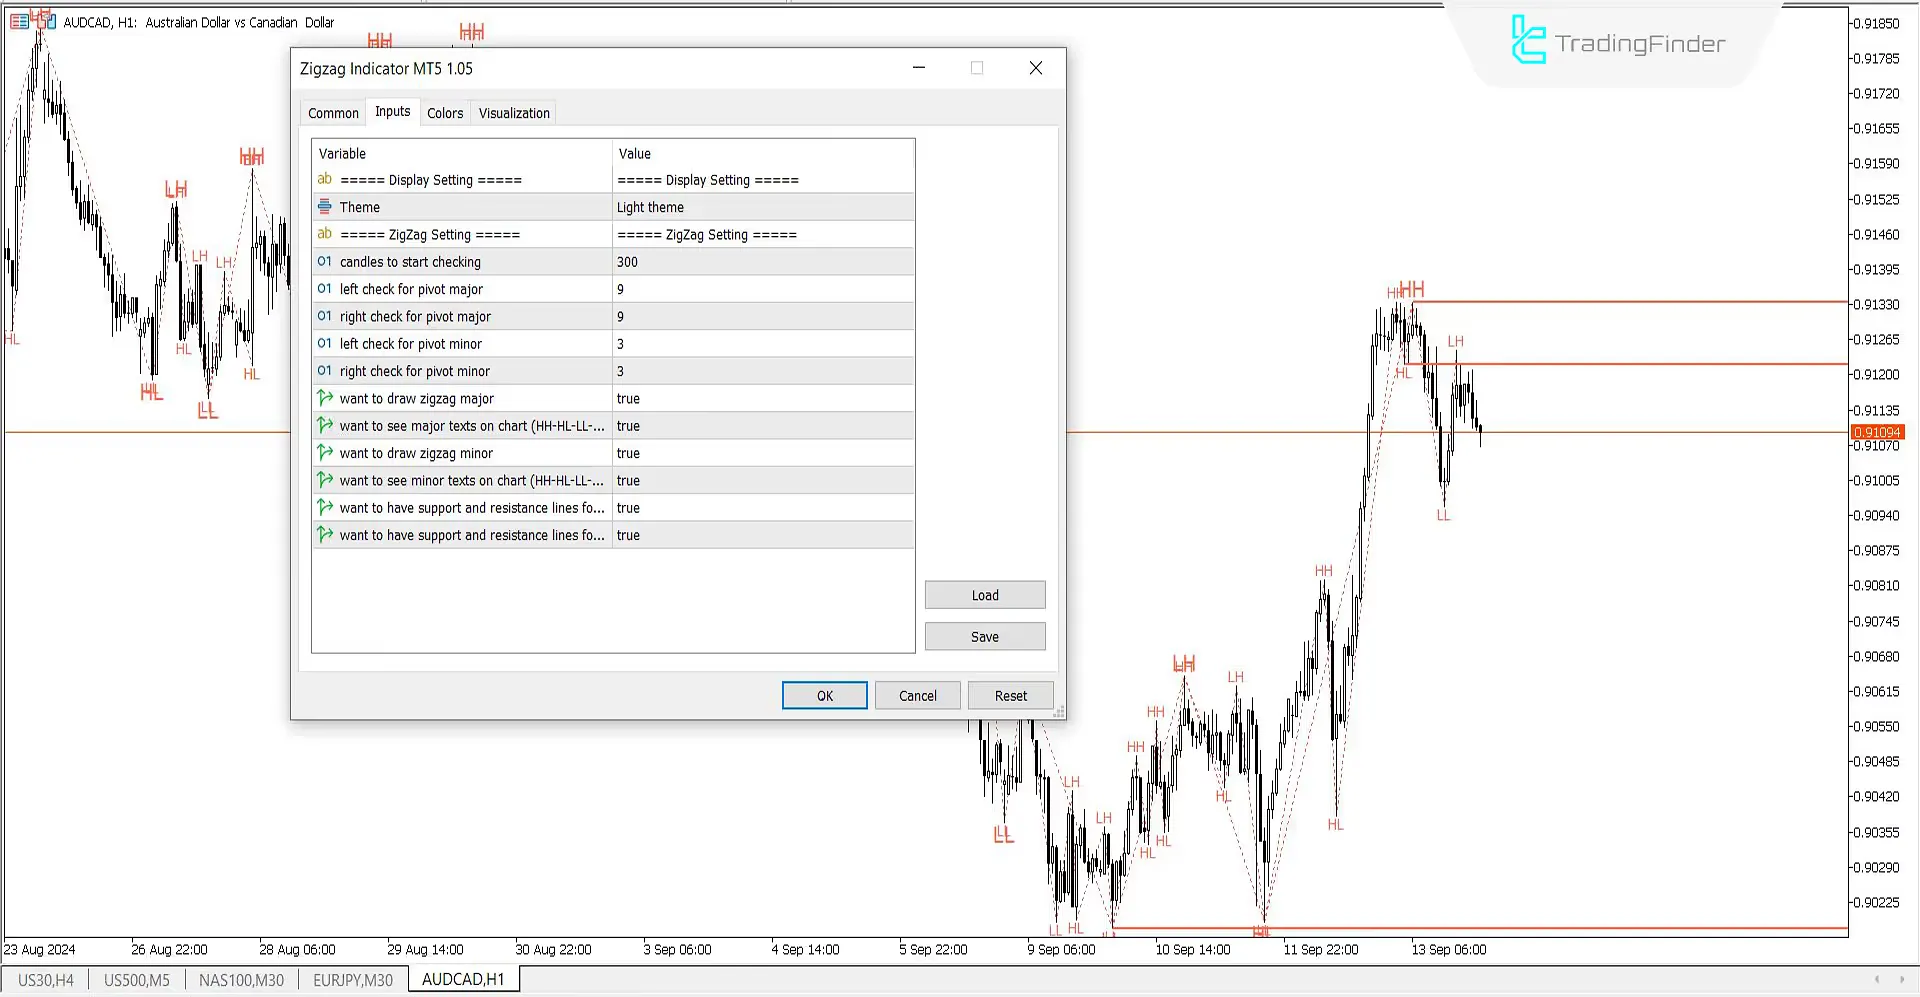
- Candles to start checking: The number of candles for indicator calculations is set to 300;
- Left check for pivot major: Checking major pivots to the left of the chart is set to 9;
- Right check for pivot major: Checking major pivots to the right of the chart is set to 9;
- Left check for pivot minor: Checking minor pivots to the left of the chart is set to 3;
- Right check for pivot minor: Checking minor pivots to the right of the chart is set to 3;
- Want to draw zigzag major: The true option shows major zigzag lines;
- Want to see major texts on chart (HH-HL-LL-LH): The true option shows major labels;
- Want to draw zigzag minor: The true option shows minor zigzag lines;
- Want to see minor texts on chart (HH-HL-LL-LH): The true option shows minor labels;
- Want to have support and resistance lines for major trend: The true option shows major support and resistance lines;
- Want to have support and resistance lines for minor trend: The true option shows minor support and resistance lines.
Note: The false option can be used to remove or hide any of the pivots and minor support and resistance levels.
Conclusion
This MT5 Support and Resistance indicator is very useful for identifying trend reversal points and chart price rotations. It helps traders identify pivot highs and lows on the chart without the need to inspect it manually, allowing them to implement their trading strategy based on them.
ZigZag MT5 PDF
ZigZag MT5 PDF
Click to download ZigZag MT5 PDFSo, what exactly is the ZigZag Indicator used for?
This indicator can automatically identify all Major and Minor Highs and Lows on the chart without the trader's need to inspect them manually, which can help determine trend direction and technical analysis patterns.
Can the ZigZag Indicator be used alongside various strategies?
Yes, this indicator can be used alongside other analytical tools and strategies.
This is by far the best indicator for me to identify market structure, everything is starting to fall into place because of this indicator. Thank you very much to the creators of this indicator. I have been struggling to understand market structure but now everything is clear. This is a great addition to my algorithm.


