


![Zone Indicator for MetaTrader 5 Download - Free - [Trading Finder]](https://cdn.tradingfinder.com/image/108360/11-31-en-zone-mt5.webp)
![Zone Indicator for MetaTrader 5 Download - Free - [Trading Finder] 1](https://cdn.tradingfinder.com/image/38541/11-31-en-zone-mt5-02.avif)
![Zone Indicator for MetaTrader 5 Download - Free - [Trading Finder] 2](https://cdn.tradingfinder.com/image/38542/11-31-en-zone-mt5-03.avif)
![Zone Indicator for MetaTrader 5 Download - Free - [Trading Finder] 3](https://cdn.tradingfinder.com/image/38543/11-31-en-zone-mt5-04.avif)
The Zone Indicator is a range detection tool in MetaTrader 5 indicator, providing the most straightforward way for traders to identify Support and Resistance levels. This tool is helpful for many trading styles and strategies, such as Price Action, where Support and Resistance levels play a crucial role.
The Zone Indicator displays support zones with green boxes and resistance zones with red boxes on the price chart, making it easy to observe price actions at these levels.
Zone Indicator Table
Indicator Categories: | Price Action MT5 Indicators Support & Resistance MT5 Indicators Levels MT5 Indicators |
Platforms: | MetaTrader 5 Indicators |
Trading Skills: | Elementary |
Indicator Types: | Breakout MT5 Indicators Reversal MT5 Indicators |
Timeframe: | Multi-Timeframe MT5 Indicators |
Trading Style: | Swing Trading MT5 Indicators Scalper MT5 Indicators Day Trading MT5 Indicators Fast Scalper MT5 Indicators |
Trading Instruments: | Forex MT5 Indicators Crypto MT5 Indicators Stock MT5 Indicators Commodity MT5 Indicators Indices MT5 Indicators Forward MT5 Indicators Share Stock MT5 Indicators |
Buy Conditions with the Indicator (Support Level)
The chart of the AUD/USD currency pair in the 30-minute timeframe is shown below. On August 6th, after a price retracement, this MT5 Support and Resistance Indicator is a price reaches the green box (Support) and reacts upwardly. Bullish Divergences can also confirm when the price reaches these levels.
Sell Conditions with the Indicator (Resistance Level)
The image below shows the Brent Crude Oil (BRN) chart in the 1-hour timeframe. On July 31st, after a price retracement, the price reaches the red box (Resistance) and reacts downward. Bearish Divergences can also be used for further confirmation when the price reaches these levels.
Zone Indicator Settings
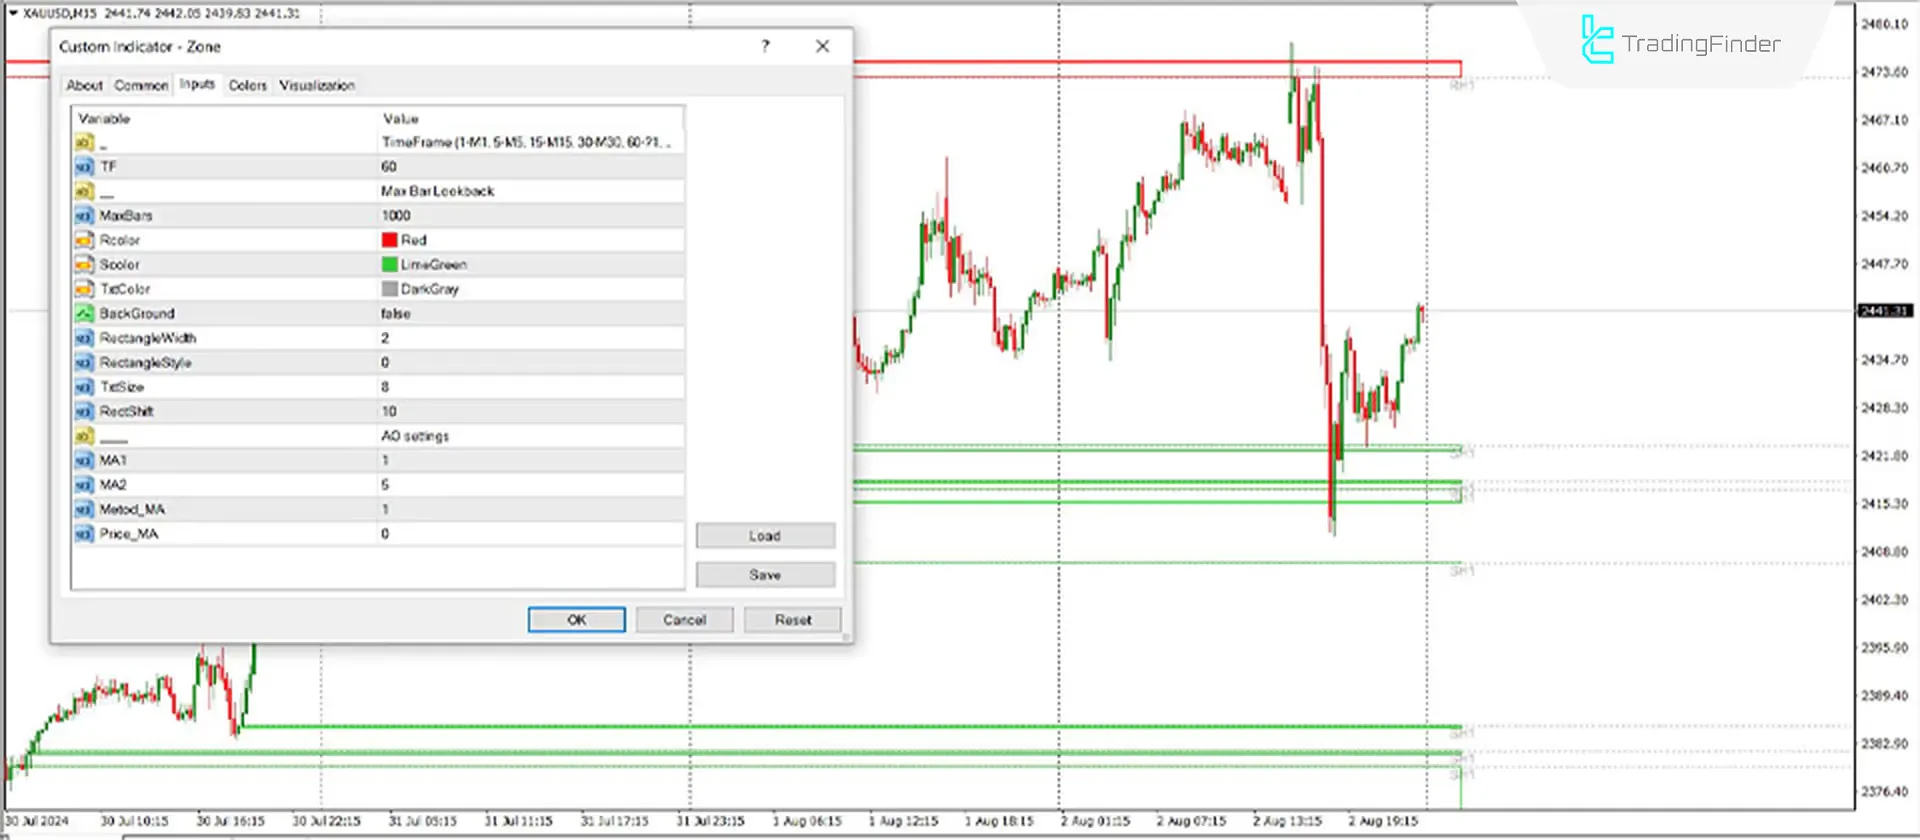
- TF: The default timeframe is 60 (1 hour) or current.
- MaxBars: Maximum number of bars for calculation is set to 1000.
- Rcolor: The color of the resistance box is red.
- Color: The color of the support box is green.
- TxtColor: The text color is set to gray.
- Background: Set to false for hollow boxes.
- RectangleWidth: The width of the boxes is set to 2.
- RectangleStyle: The box line style is set to 0.
- TxtSize: Text size is set to 8.
- RectShift: The box shift size to the right of the chart is set to 10.
- AO settings: Oscillator settings
- MA1: The first moving average is set to 1.
- MA2: The second moving average is set to 5.
- The Metod_MA: Moving average method is Exponential.
- Price_MA: Calculations are based on the closing price (Close).
Summary
The Zone Indicator is one of the most straightforward tools for identifying reversal points. By combining these levels with other technical analysis tools such as divergences, time analysis, and volume, traders can distinguish between valid and invalid levels.
Zone MT5 PDF
Zone MT5 PDF
Click to download Zone MT5 PDFCan the Zone Indicator be applied to any asset?
Yes, all financial market assets have Support and Resistance levels, and this indicator applies to all of them.
Are the boxes drawn by the Zone Indicator tradable?
Yes, but other analytical tools are also recommended to identify valid zones.


