![ZZI Oscillator for MT5 Download – [TradingFinder]](https://cdn.tradingfinder.com/image/642819/13-237-en-zzi-mt5-01.webp)
![ZZI Oscillator for MT5 Download – [TradingFinder] 0](https://cdn.tradingfinder.com/image/642819/13-237-en-zzi-mt5-01.webp)
![ZZI Oscillator for MT5 Download – [TradingFinder] 1](https://cdn.tradingfinder.com/image/642821/13-237-en-zzi-mt5-02.webp)
![ZZI Oscillator for MT5 Download – [TradingFinder] 2](https://cdn.tradingfinder.com/image/642820/13-237-en-zzi-mt5-03.webp)
![ZZI Oscillator for MT5 Download – [TradingFinder] 3](https://cdn.tradingfinder.com/image/642818/13-237-en-zzi-mt5-04.webp)
The ZZI Indicator is a practical tool in MetaTrader 5 that identifies and displays buy and sell trading opportunities. This indicator plots an oscillating line below the main chart and, by comparing its position with predefined threshold levels, determines whether the market is in an overbought or oversold condition.
With this capability, traders can identify potential price reversal zones and better determine optimal entry and exit points for trades.
ZZI Oscillator Specifications Table
The table below presents the specifications of the ZZI Indicator:
Indicator Categories: | Oscillators MT5 Indicators Signal & Forecast MT5 Indicators |
Platforms: | MetaTrader 5 Indicators |
Trading Skills: | Elementary |
Indicator Types: | Overbought & Oversold MT5 Indicators Reversal MT5 Indicators |
Timeframe: | Multi-Timeframe MT5 Indicators |
Trading Style: | Swing Trading MT5 Indicators Scalper MT5 Indicators Day Trading MT5 Indicators |
Trading Instruments: | Forex MT5 Indicators Crypto MT5 Indicators Stock MT5 Indicators Commodity MT5 Indicators Indices MT5 Indicators Share Stock MT5 Indicators |
ZZI Indicator at a Glance
The ZZI Oscillator appears as a signal line in a separate window below the main chart and functions based on specific threshold levels.
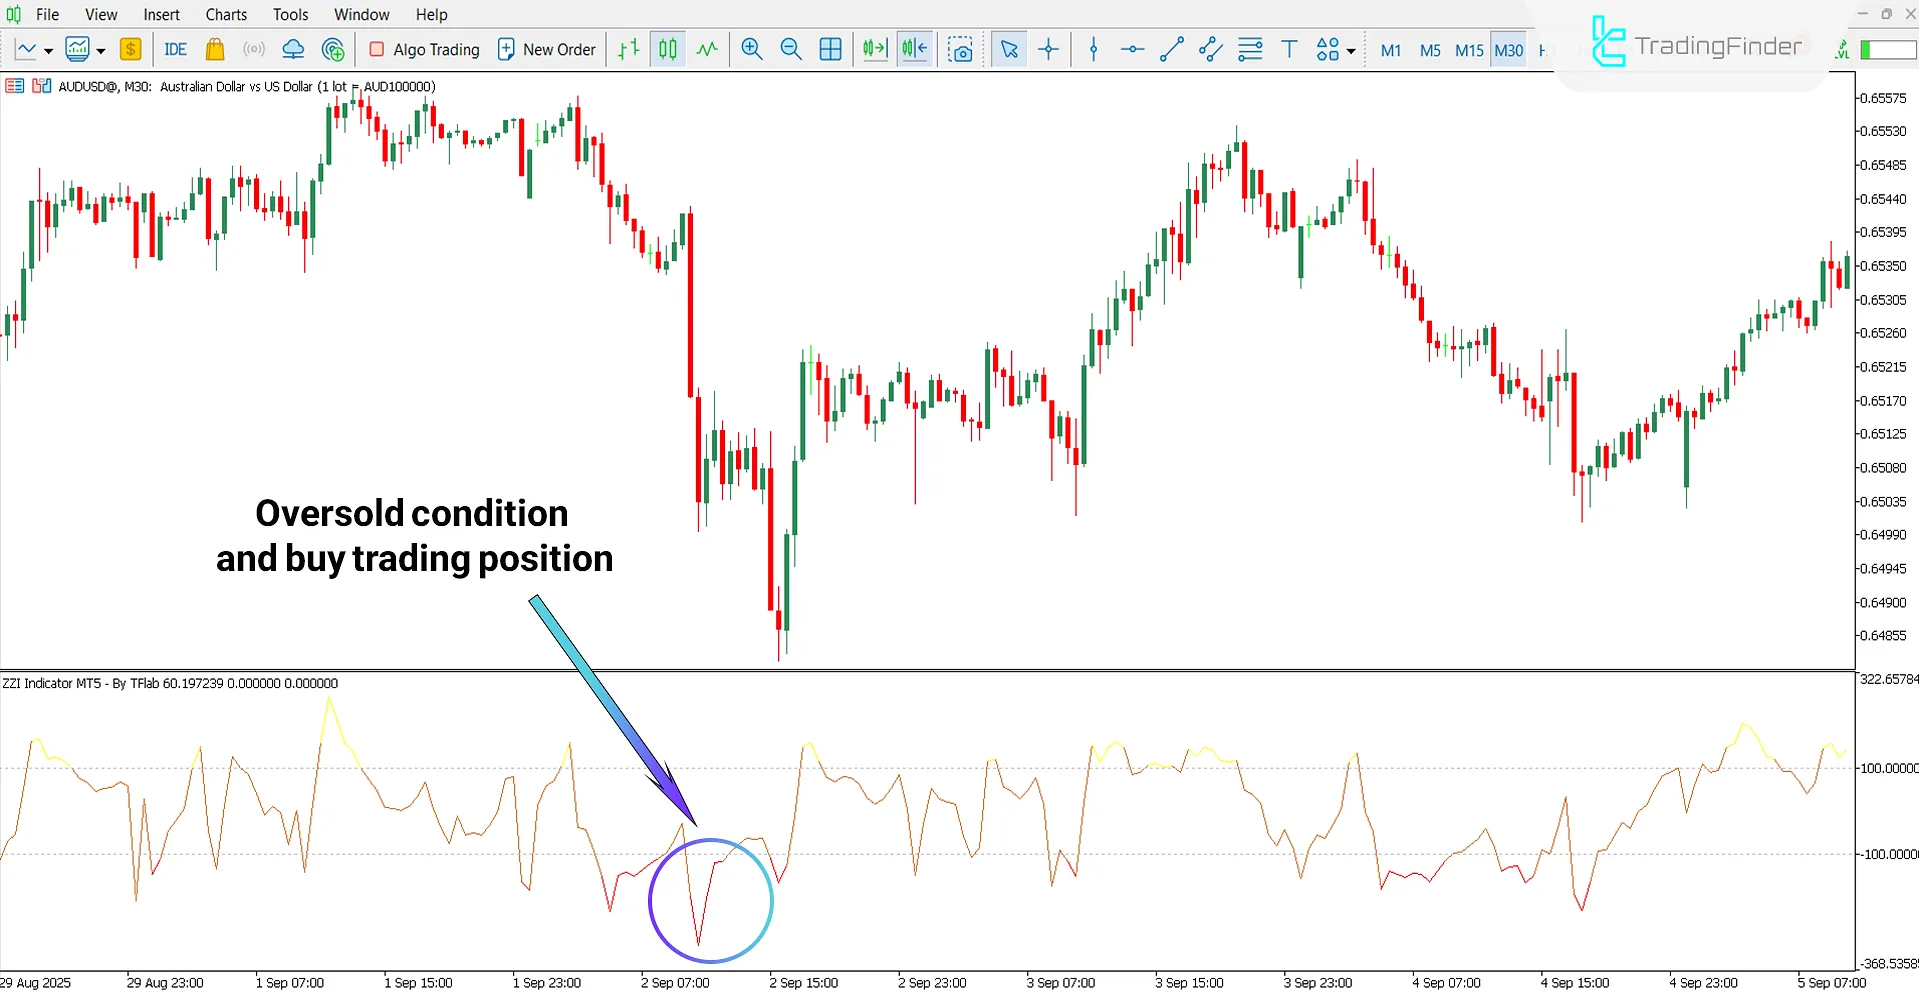
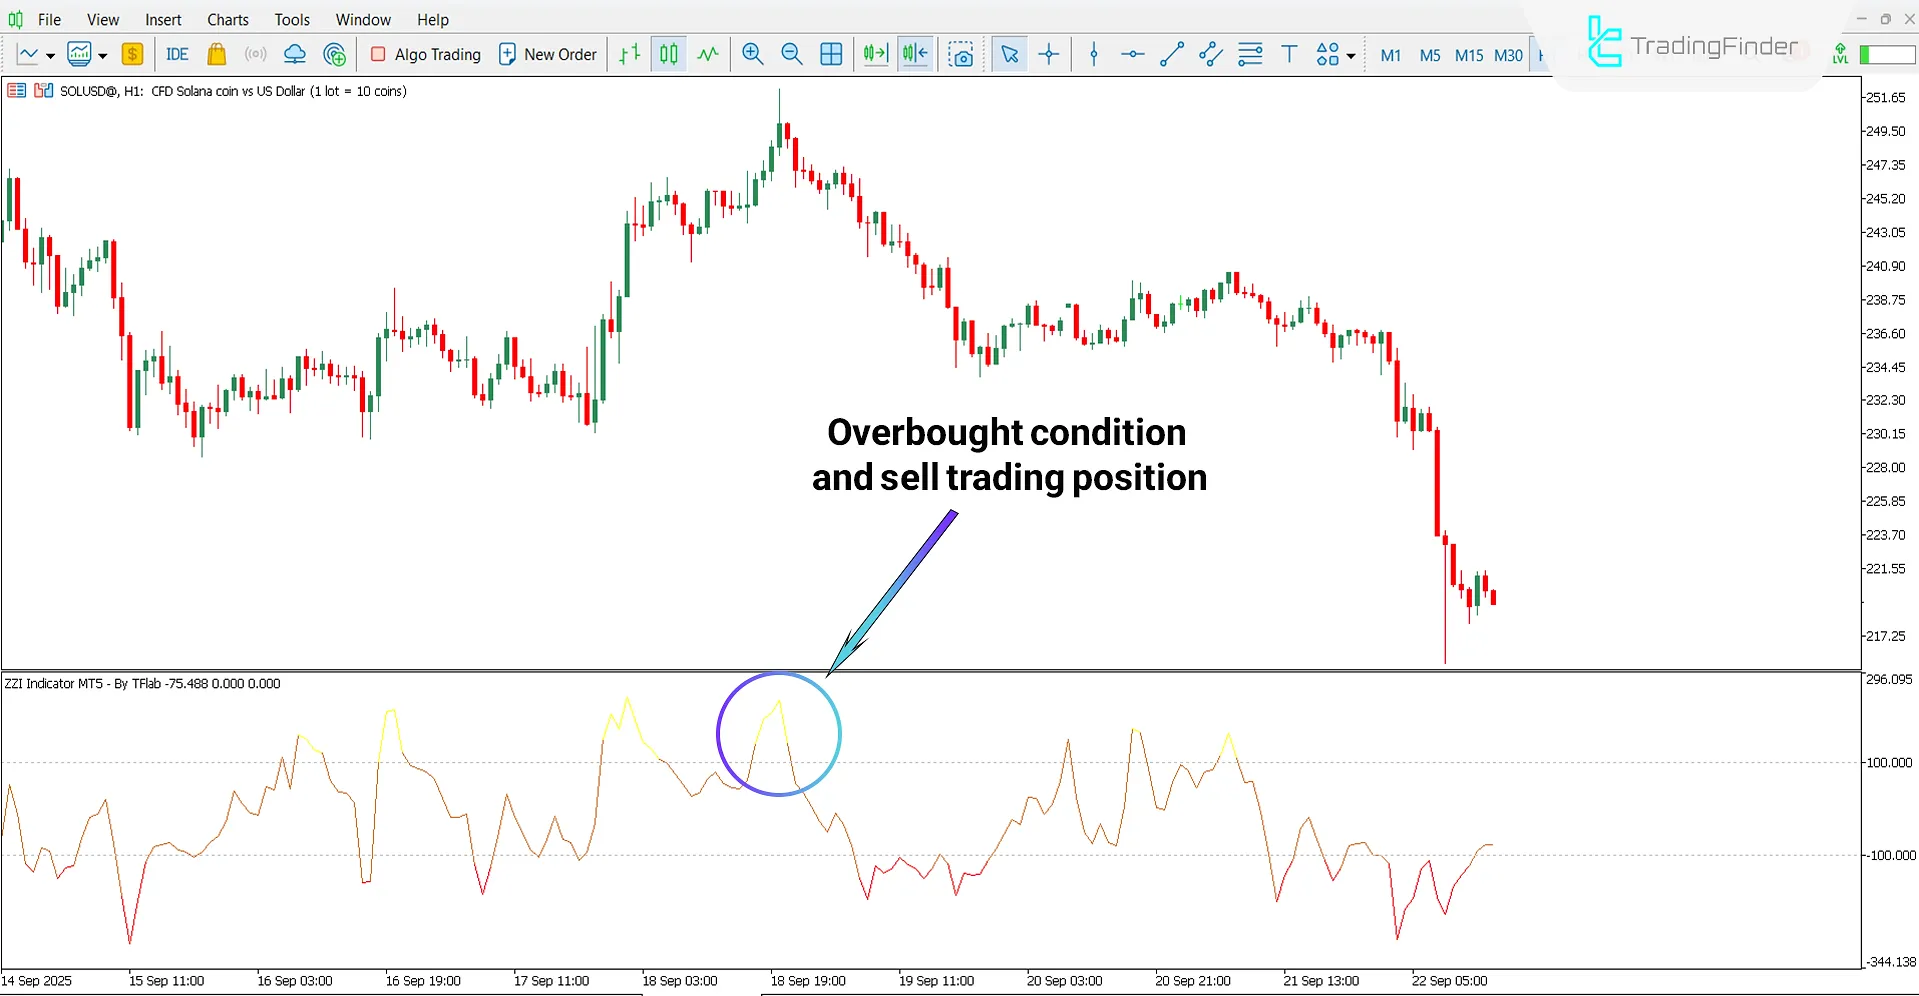
When the line enters the overbought zone, it turns yellow, while in the oversold zone, it changes to red.
Bullish Trend Condition
According to the AUD/USD chart on the 30-minute timeframe, the area suitable for buy positions is shown in red.
In such cases, this color change can be interpreted as an alert for a potential buy signal.

Bearish Trend Condition
Based on the Solana (SOL) cryptocurrency chart on the 1-hour timeframe, the oscillator line turns yellow at specific values.
This color change indicates that the market has entered an overbought condition, which can be interpreted as a sell signal.

ZZI Oscillator Settings
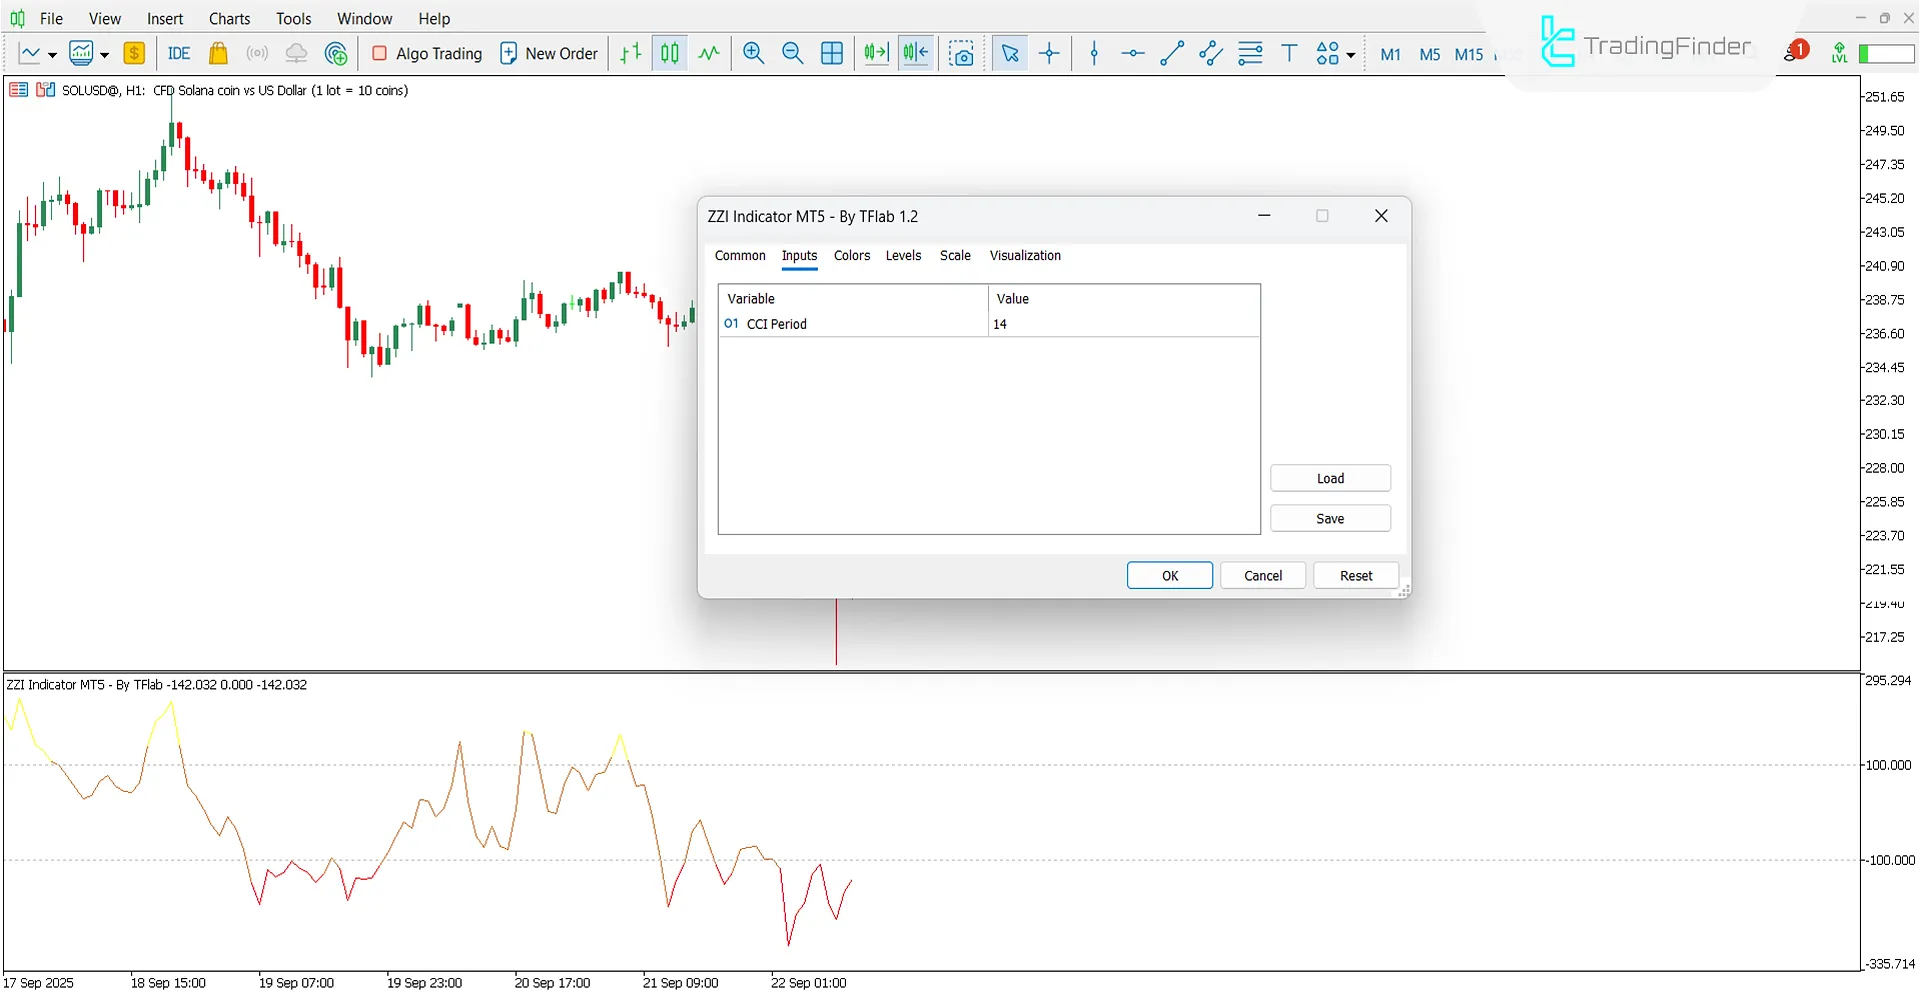
The settings of the ZZI Indicator are as follows:

- CCI Period: Calculation period of the CCI indicator
Conclusion
The ZZI Oscillator is an updated version of the CCI (Commodity Channel Index) indicator, which clearly displays overbought and oversold zones through changes in the color of its signal line.
When the oscillator line rises above +100, it indicates a sell signal, while dropping below –100 indicates a buy signal.
ZZI Oscillator for MT5 PDF
ZZI Oscillator for MT5 PDF
Click to download ZZI Oscillator for MT5 PDFHow does this indicator display trading signals?
The ZZI Indicator displays signals by changing the oscillator line color to yellow and red.
Is this tool suitable for beginners?
Yes, the ZZI Oscillator is suitable for beginners because it visually highlights overbought and oversold zones and provides clear trading signals.


