


TradingView
MetaTrader4
MetaTrader5
The Binary Options 1 Minute Signals Indicator is designed based on Smart Money concepts to analyze price behavior from the perspective of liquidity flow and institutional order execution.
This trading tool examines price action around key liquidity zones and identifies the moment when the market completes the liquidity grab process and enters the reaction phase.
In addition, the indicator focuses on the confluence of liquidity sweep, false breakout, Fair Value Gap, and Order Block; specific zones where institutional trader activity forms and the true direction of price movement becomes clear.
Binary Options 1 Minute Signals Indicator Specifications Table
The table below presents the features and capabilities of the Binary Options 1 Minute Signals Indicator:
Indicator Categories: | ICT Tradingview Indicators Smart Money Tradingview Indicators Signal & Forecast Tradingview Indicators |
Platforms: | Trading View Indicators |
Trading Skills: | Intermediate |
Indicator Types: | Reversal Tradingview Indicators Breakout Tradingview Indicators |
Timeframe: | Multi-Timeframe Tradingview Indicators |
Trading Style: | Intraday Tradingview Indicators |
Trading Instruments: | TradingView Indicators in the Forex Market Cryptocurrency Tradingview Indicators Stock Tradingview Indicators Commodity Tradingview Indicators Indices Tradingview Indicators Share Stocks Tradingview Indicators |
Binary Options 1 Minute Signals Indicator at a Glance
The operational logic of the Binary Options 1 Minute Signals Indicator is based on mapping market structure through precise identification of swing highs and swing lows, highlighting the primary liquidity concentration zones.
When price approaches these areas, the tool purposefully analyzes candlestick behavior to detect signs of liquidity sweep and the beginning of imbalance in price flow.
Temporary breaks of key levels, stop loss activation, and rapid price returns to the prior range are interpreted as signals of a market phase shift.
Following this stage, the indicator evaluates price reactions near a Fair Value Gap or Order Block and examines the formation of new institutional order flow within the market structure.
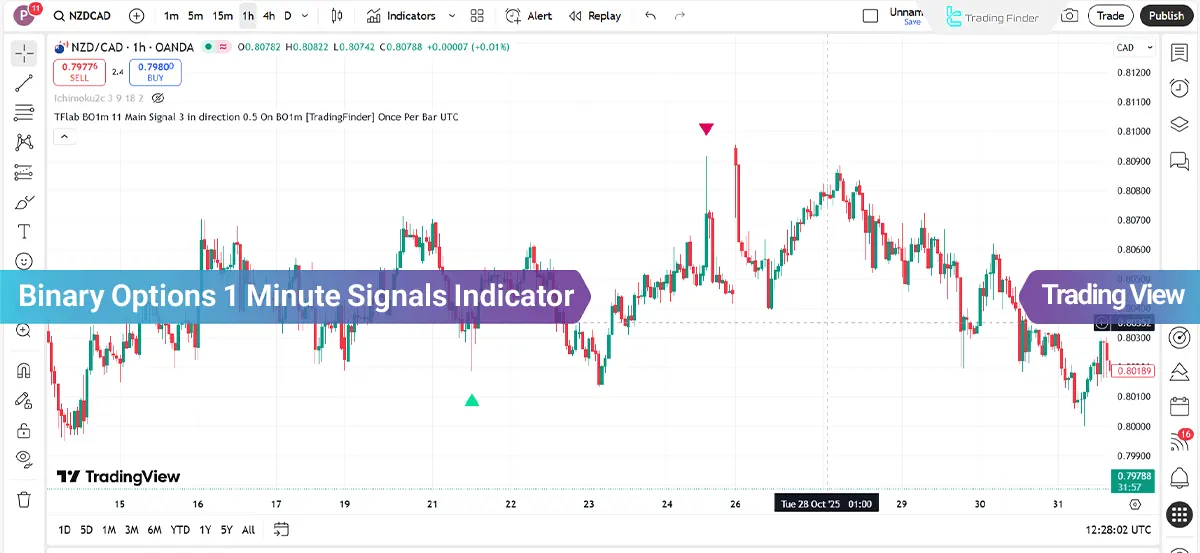
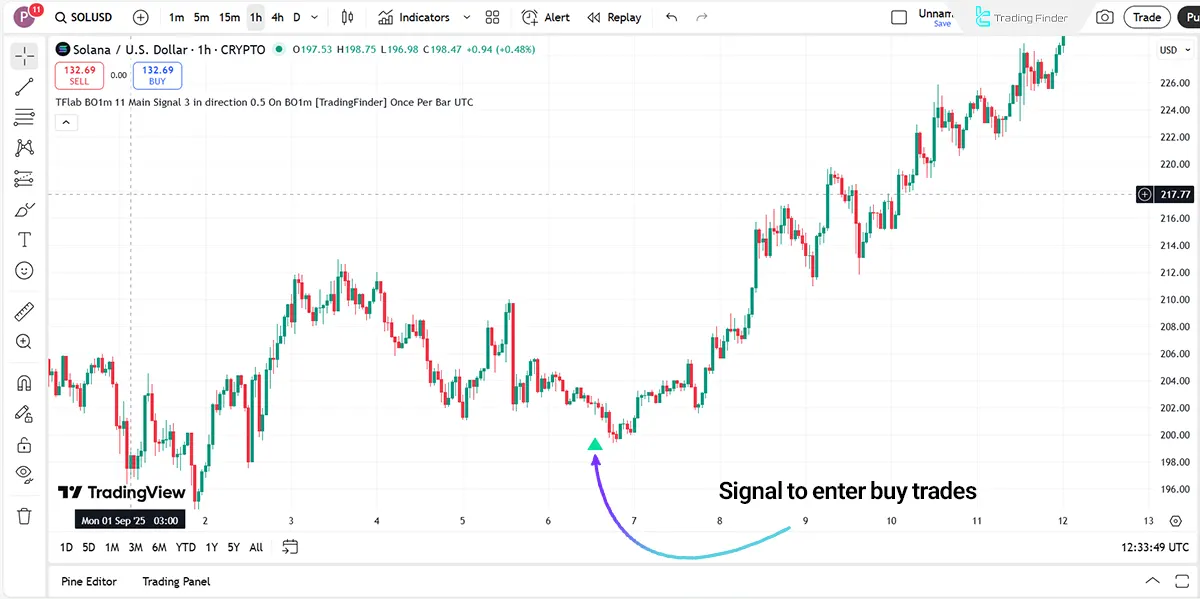
Indicator Performance in an Uptrend
In a bullish scenario, after a downward move, the market enters the sell side liquidity zone below previous swing lows and completes the liquidity sweep process.
Price temporarily penetrates key levels, triggers sellers’ stop losses, and then quickly returns to the prior range, which is interpreted as a false breakout.
In this zone, the indicator analyzes price reaction to a bullish Order Block or bullish Fair Value Gap.
With the close of a bullish confirmation candle, the shift in order flow from selling pressure to institutional accumulation is identified, and a buy signal is issued for entering long positions.
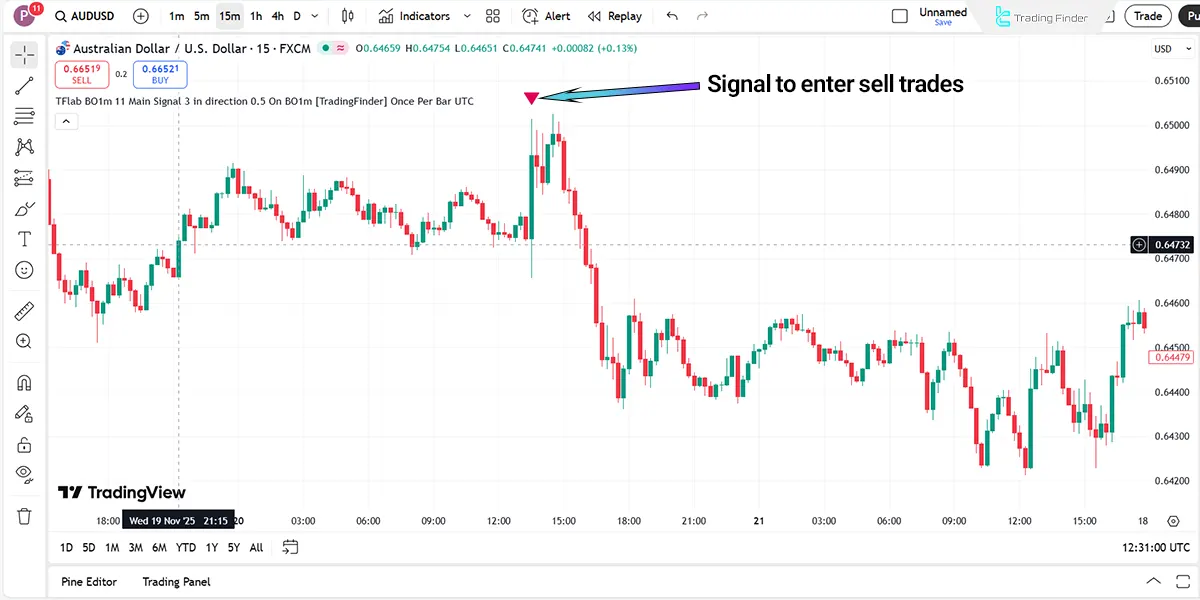
Indicator Performance in a Downtrend
In a bearish scenario, after an upward move, the market enters the buy side liquidity zone above previous swing highs and completes the liquidity sweep phase.
Price temporarily breaks above liquidity levels, activates buyers’ stop losses, absorbs accumulated liquidity, and then rapidly returns below the breached level, forming a false breakout structure.
Under these conditions, the indicator analyzes price reactions near a bearish Order Block or bearish Fair Value Gap.
With the close of a bearish confirmation candle, the shift in order flow from buying to institutional selling is confirmed within the market structure, and a sell signal appears at a point where the market shows strong readiness for a rapid bearish reaction.
Binary Options 1 Minute Signals Indicator Settings
The image below displays the details of the Binary Options 1 Minute Signals Indicator settings:
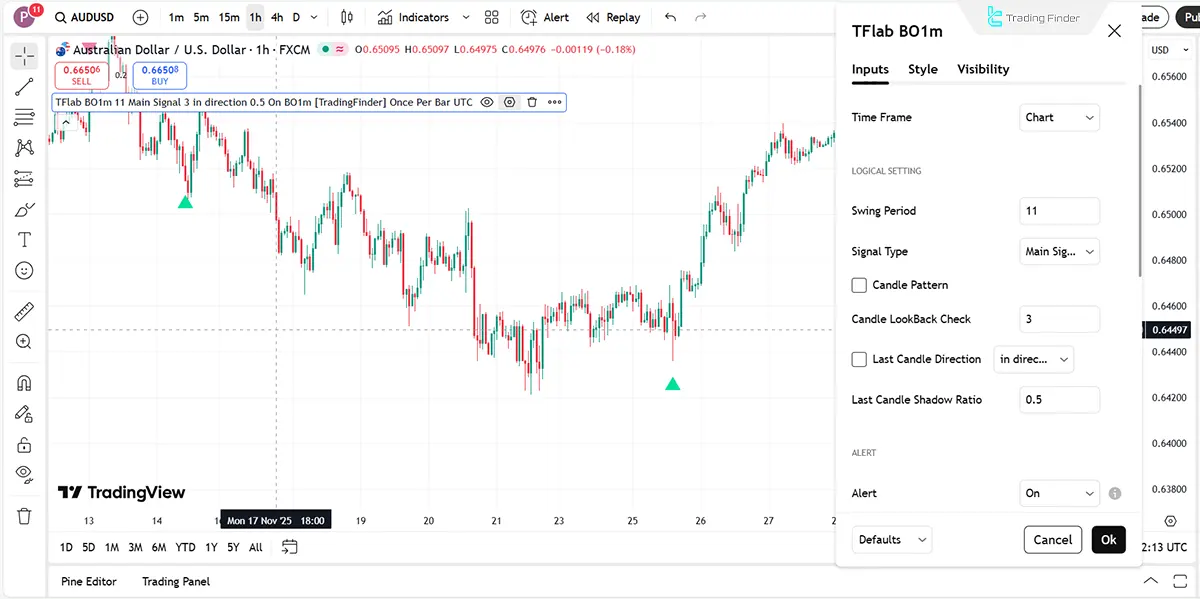
- Time Frame: Analysis timeframe
LOGICAL SETTING
- Swing Period: Display of swing period
- Signal Type: Signal type
- Candle Pattern: Candlestick pattern activation
- Candle LookBack Check: Candlestick lookback validation
- Last Candle Direction: Last candle direction check
- Last Candle Shadow Ratio: Ratio of shadow to body of the last candle
Alert
- Alert: Signal alert
Conclusion
The Binary Options 1 Minute Signals Indicator analyzes market movement logic based on liquidity behavior and institutional order flow. This tool identifies moments when the market has completed the liquidity grab phase and entered the price reaction stage.
By combining liquidity sweep, false breakout, Fair Value Gap, and Order Block, the indicator creates a structured framework for understanding and interpreting price movements
The signals generated by this indicator are formed based on the alignment of market structure, liquidity positioning, and candlestick confirmation, maintaining distance from reactions to random price fluctuations.
Binary Options 1 Minute Signals Indicator PDF
Binary Options 1 Minute Signals Indicator PDF
Click to download Binary Options 1 Minute Signals Indicator PDFWhat is the main application of the Binary Options 1 Minute Signals Indicator on TradingView?
This indicator is designed to identify the end of the liquidity grab phase and the beginning of price reaction, highlighting precise entries on lower timeframes, especially the 1 minute timeframe, in alignment with Smart Money flow.
What is the role of liquidity sweep in signal generation?
Liquidity sweep is identified as a critical stage in market phase transitions, and the indicator issues signals only after this process has been fully completed.


