


TradingView
MetaTrader4
MetaTrader5
The Dark Cloud Pattern Indicator is an analytical tool in TradingView indicators, designed to identify reversal candlestick patterns.
This tool helps detect trend reversal points, automatically highlighting two essential patterns: "Dark Cloud Cover" and "Piercing Line" on the chart while providing detailed information on potential price reversal zones.
The Dark Cloud Cover pattern is a bearish reversal pattern that appears at the end of an uptrend. Conversely, the Piercing Line pattern is a bullish reversal pattern that forms at the bottom of a downtrend.
Dark Cloud Pattern Indicator Specifications
The table below summarizes the key features of the Dark Cloud Candlestick Pattern Indicator:
Indicator Categories: | Signal & Forecast Tradingview Indicators Trading Assist Tradingview Indicators Chart & Classic Tradingview indicators |
Platforms: | Trading View Indicators |
Trading Skills: | Intermediate |
Indicator Types: | Reversal Tradingview Indicators |
Timeframe: | Multi-Timeframe Tradingview Indicators |
Trading Style: | Day Trading Tradingview Indicators |
Trading Instruments: | TradingView Indicators in the Forex Market Cryptocurrency Tradingview Indicators Stock Tradingview Indicators Forward Tradingview Indicators Share Stocks Tradingview Indicators |
Indicator Overview
The Dark Cloud Reversal Indicator displays entry signals in two ways:
- Ared circle indicates a strong bearish reversal signal. If the pattern loses strength, the signal is replaced with a black arrow
- The entry signal is marked with a green circle in a strong bullish reversal pattern. If the pattern is weak, the signal is represented by a blue arrow
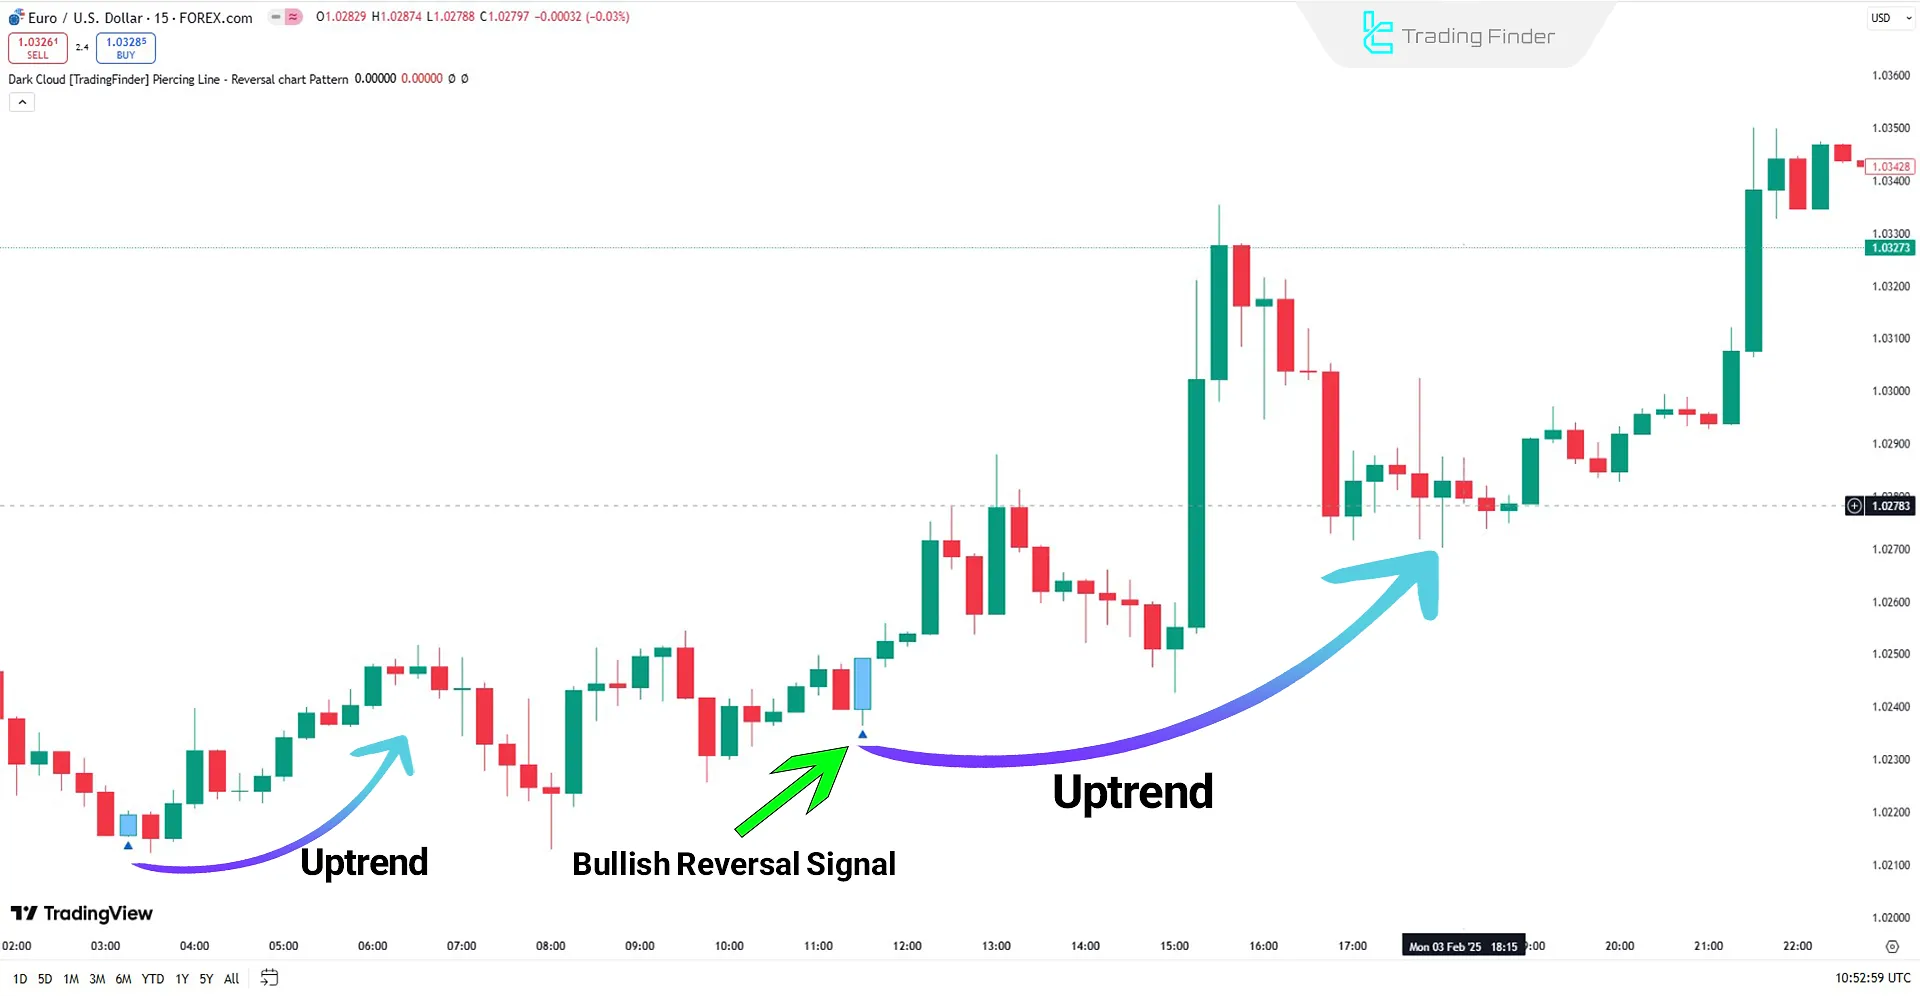
Indicator in an Uptrend
The indicator evaluates candlestick structures when the price approaches key support levels or previous market lows.
If a bullish candlestick with a larger body covers more than 50% of the previous candlestick, a bullish entry signal is triggered.
A green circle appears on the chart if the Piercing Line pattern is confirmed as a valid reversal pattern. If the pattern is weaker, the entry signal is shown with a blue arrow.
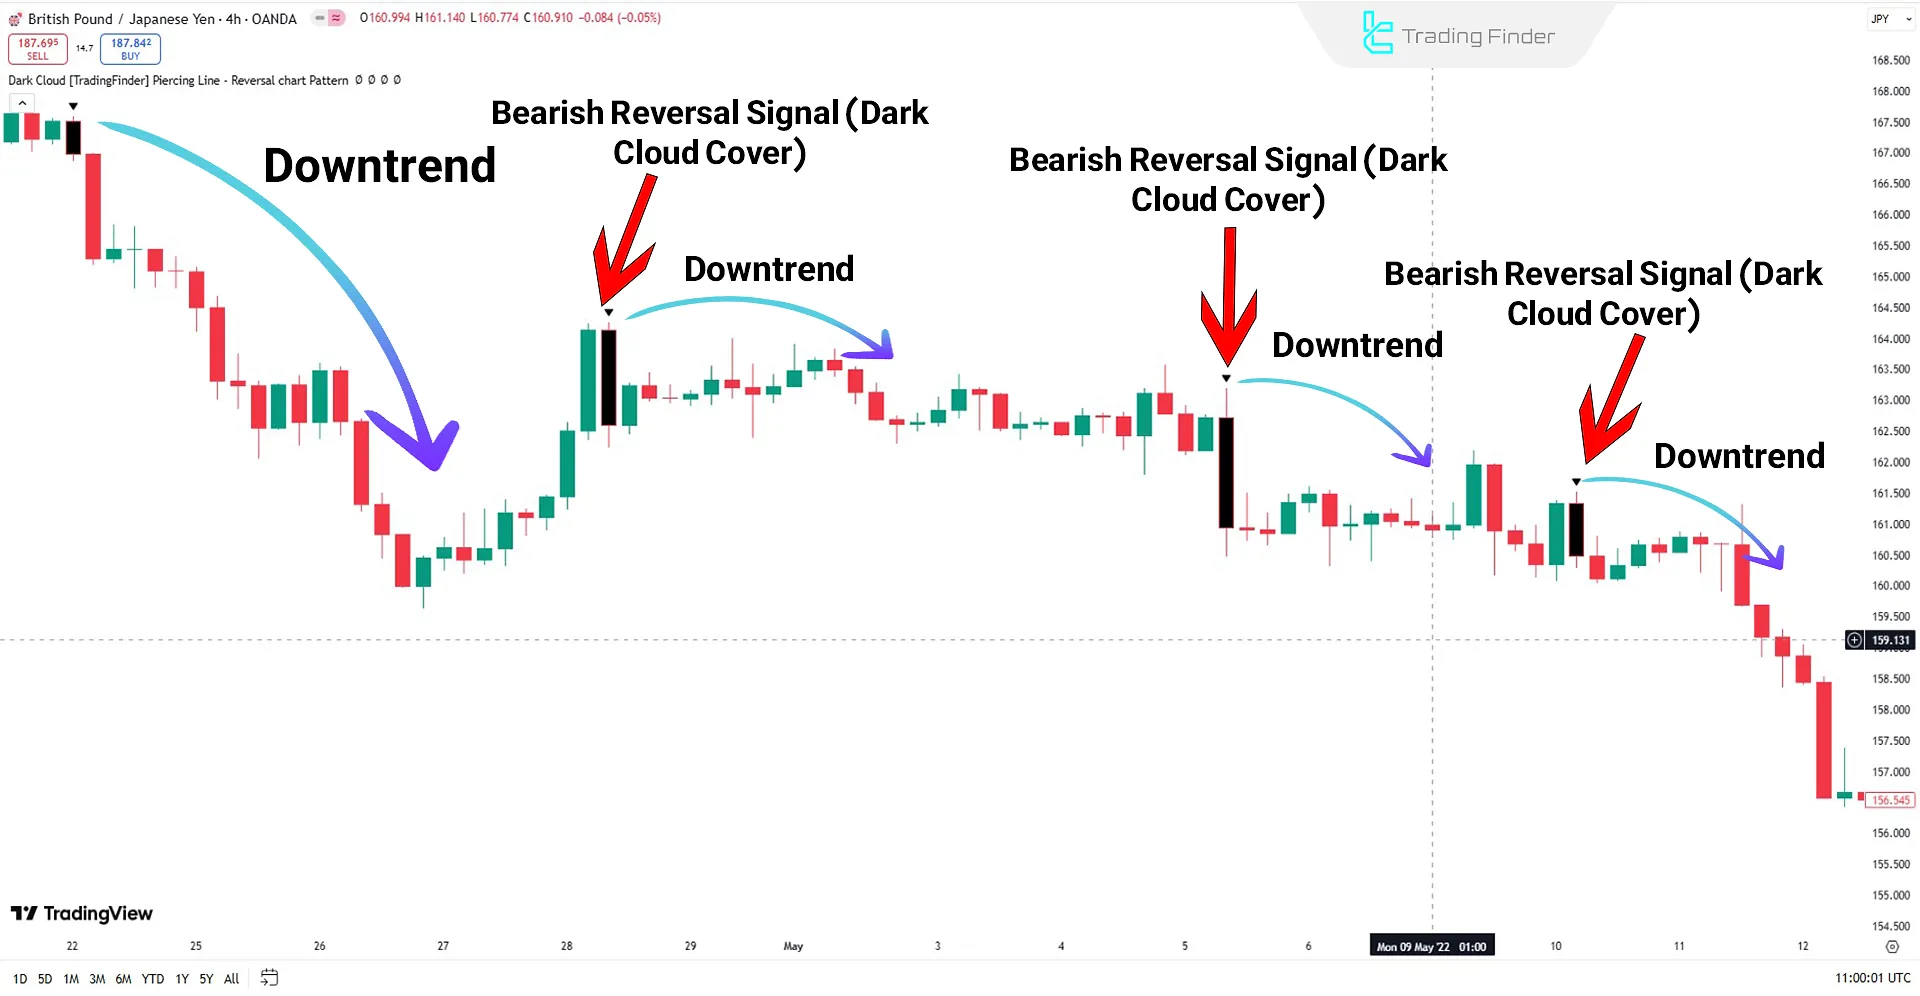
Indicator
in a Downtrend
When the price reaches key resistance levels or previous market highs, it signals a weakening uptrend, and the indicator can generate a sell signal.
As the price nears these levels, the indicator examines candlestick structures and evaluates potential trend reversals.
A sell entry signal is triggered if a strong, bearish candlestick follows a bullish candle covering more than 50% of its body.
A red circle appears on the chart if the Dark Cloud Cover pattern is confirmed as a strong reversal signal. If the pattern is less reliable, the indicator displays a bearish entry signal using a black arrow.
Dark Cloud Pattern Indicator Settings
The settings panel for the Dark Cloud Reversal Indicator is displayed in the image below:
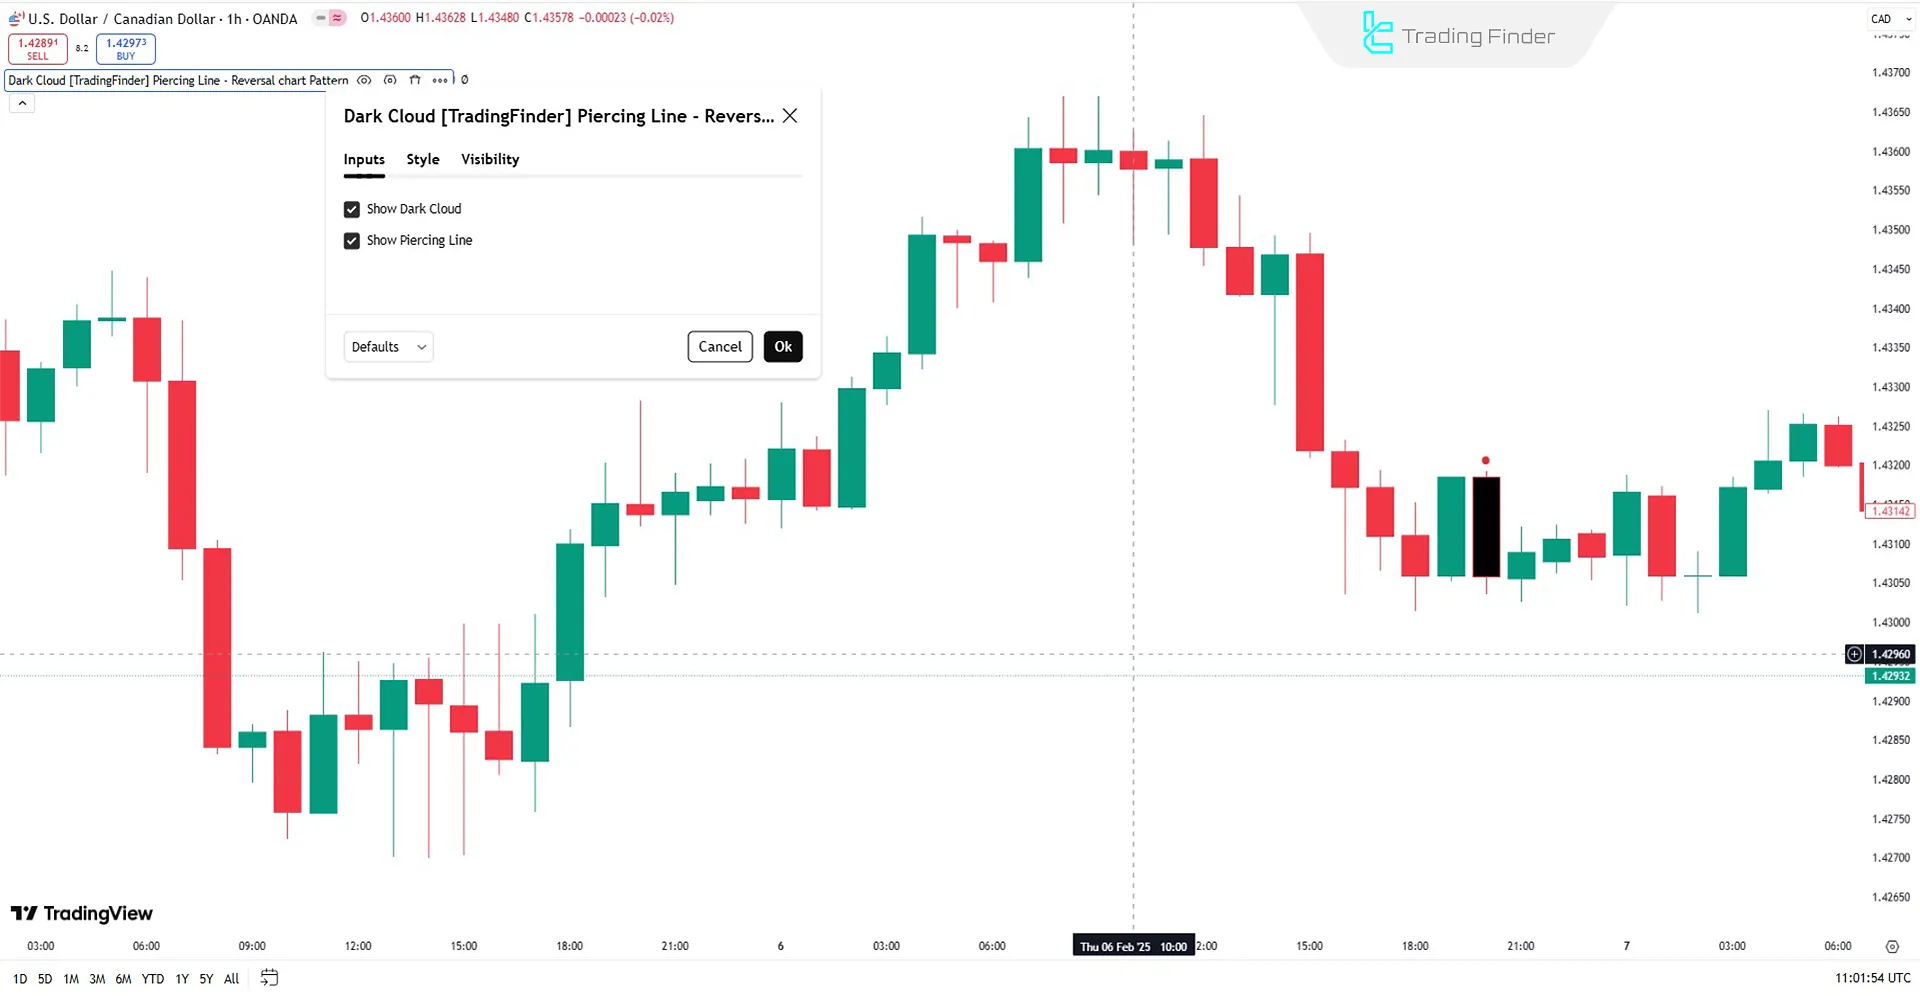
- Show Dark Cloud: Display the Dark Cloud Cover bearish reversal pattern
- Show Piercing Line: Display the Piercing Line bullish reversal pattern
Conclusion
The Dark Cloud Pattern Indicator effectively identifies entry points in bullish and bearish trends by detecting candlestick reversal patterns.
This signal and forecast Tradingview indicator assists in predicting potential trend changes.
Dark Cloud Pattern TradingView PDF
Dark Cloud Pattern TradingView PDF
Click to download Dark Cloud Pattern TradingView PDFWhat is the Dark Cloud Pattern Indicator, and what is its purpose?
The Dark Cloud Pattern Indicator is a technical analysis tool in TradingView designed to automatically identify candlestick reversal patterns.
Can this indicator be used in all timeframes?
Yes, the Dark Cloud Pattern Indicator works across all timeframes, from 1-minute to daily charts. However, its best performance is observed in medium- and long-term timeframes (M15, H1, H4, Daily).


