TradingView
MetaTrader4
MetaTrader5
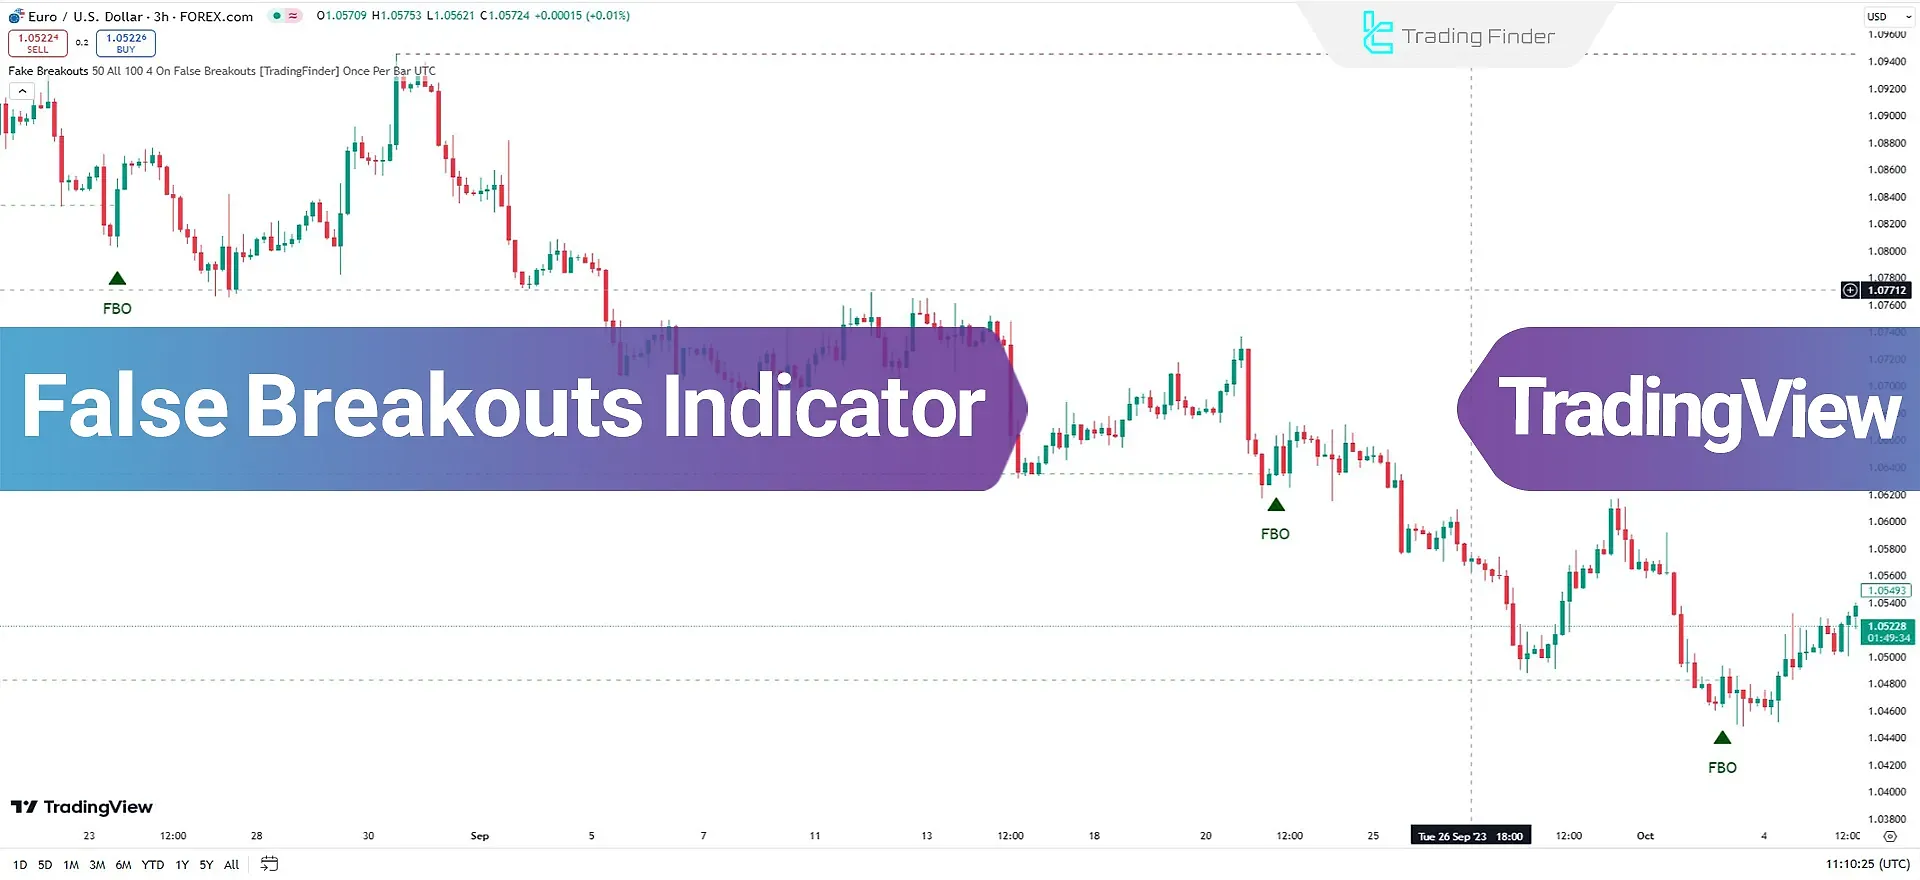
The False Breakouts Indicator in TradingView Indicators is a precise technical analysis tool that identifies false breakouts and Swing Failure Patterns (SFP).
This indicator accurately pinpoints areas where the price surpasses key support or resistance levels butquickly retraces back into the range.

This behavior often indicates a market trend reversal. It can be used to identify reversal points and counter-trend moves.
False Breakouts Indicator Table Specifications
This table provides a concise description of the indicator's details.
Indicator Categories: | ICT Tradingview Indicators Support & Resistance Tradingview Indicators Signal & Forecast Tradingview Indicators |
Platforms: | Trading View Indicators |
Trading Skills: | Advanced |
Indicator Types: | Reversal Tradingview Indicators Breakout Tradingview Indicators |
Timeframe: | Multi-Timeframe Tradingview Indicators |
Trading Style: | Day Trading Tradingview Indicators |
Trading Instruments: | TradingView Indicators in the Forex Market Cryptocurrency Tradingview Indicators Stock Tradingview Indicators |
Indicator Overview
A false breakout refers to a scenario where the price fails to maintain a breakout and quickly returns to its previous range.
This usually happens when inexperienced traders, under psychological pressure or in a rush to enter the market, open positions. This triggers stop losses and attracts liquidity.
Indicator in an Uptrend
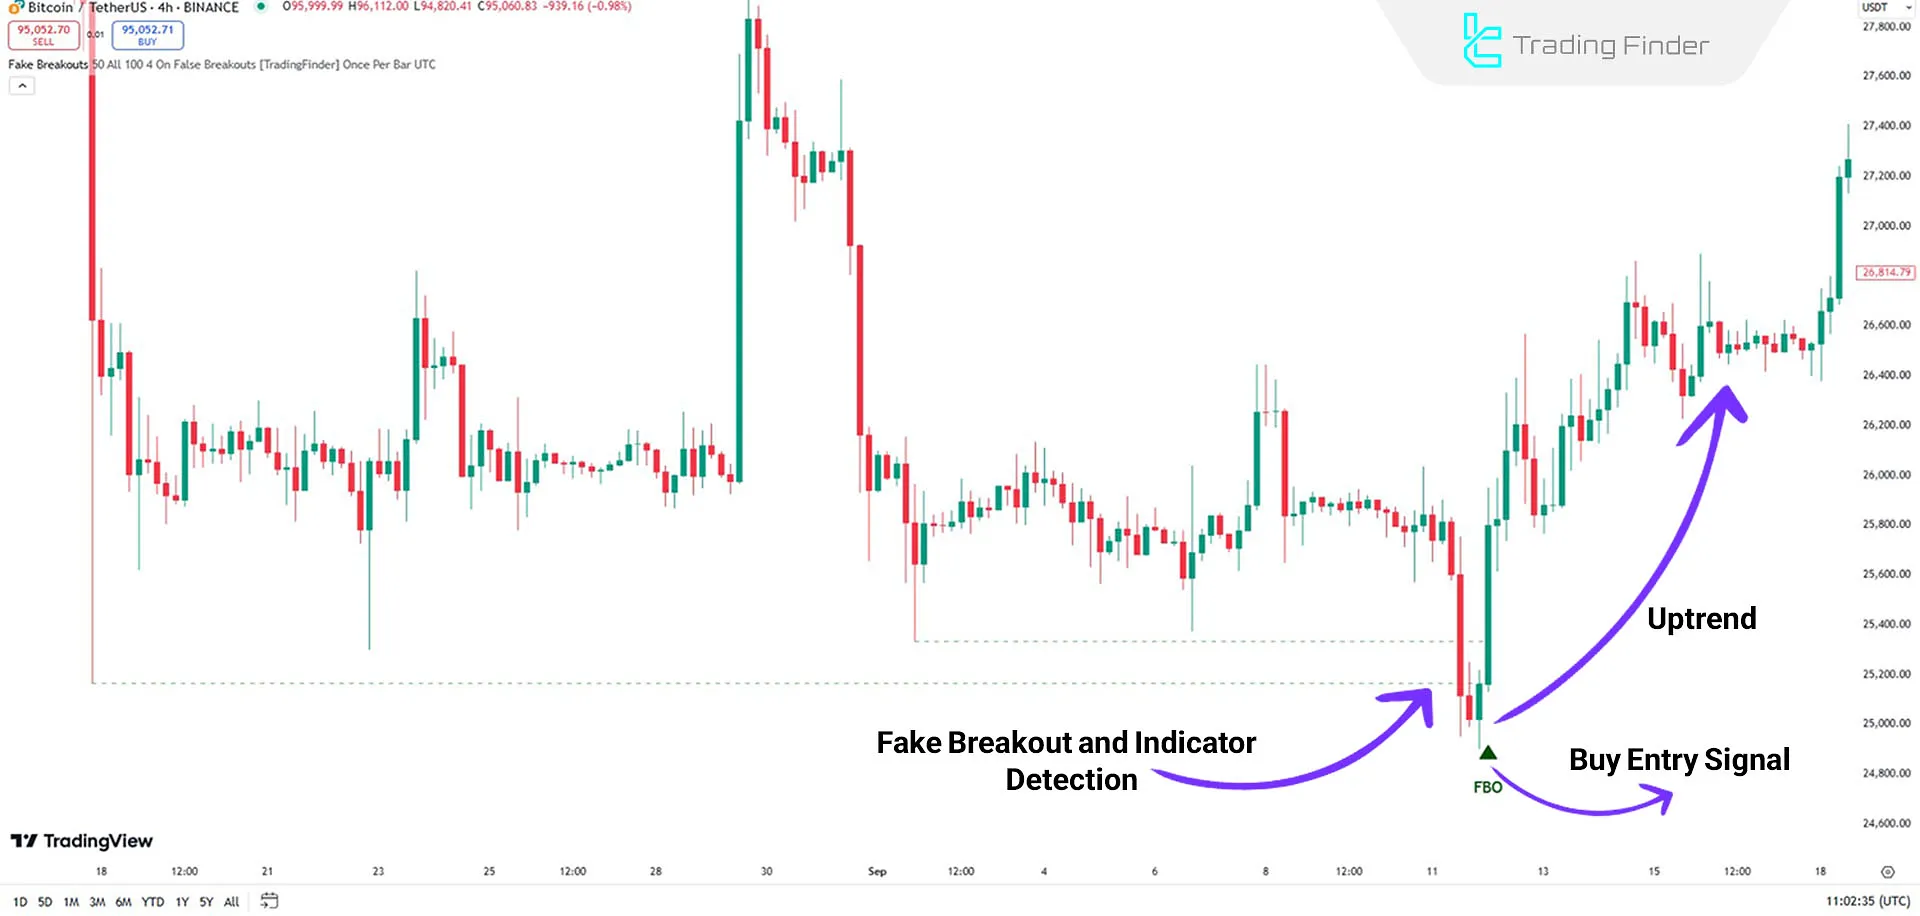
As shown in the chart, Bitcoin (BTC) in the 4-hour timeframe demonstrates a scenario where the price temporarily breaches a resistance level but quickly returns to its previous range.
This behavior indicates a false breakout, typically occurring after stops are triggered and liquidity sweep is absorbed. In such cases, the indicator issues a Buy Entry Signal with a green arrow.

Indicator in a Downtrend
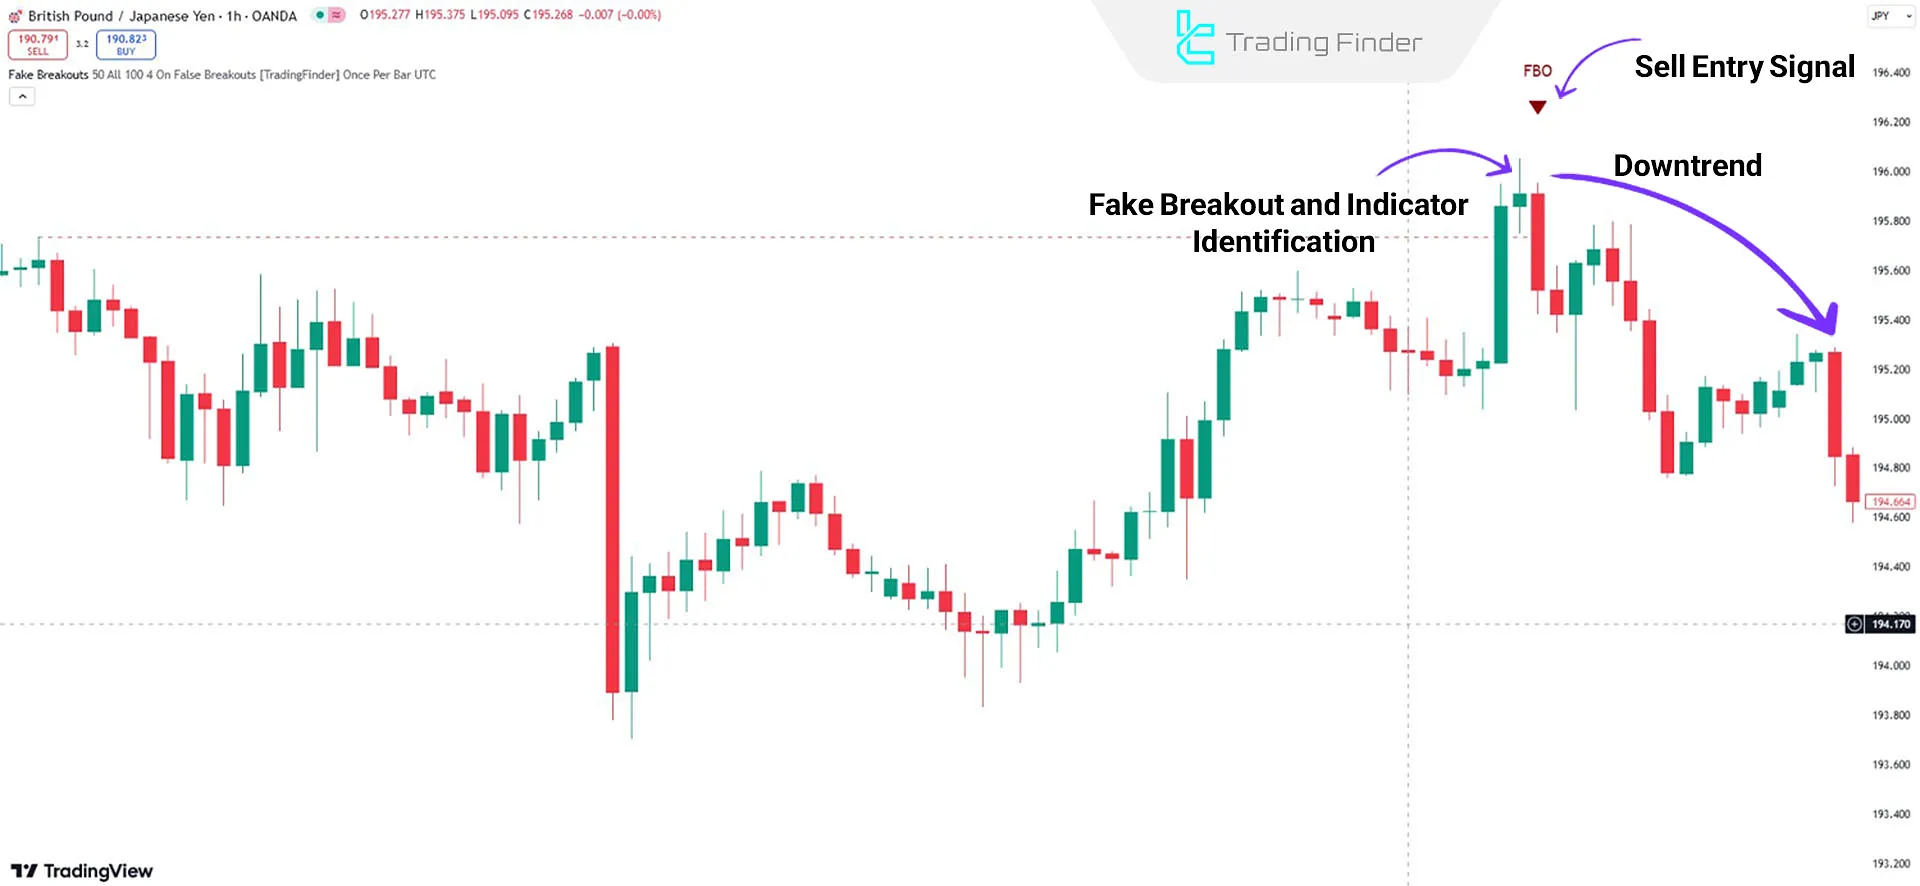
In the 1-hour price chart for GBP/JPY, the price temporarily breaches a support level but quickly retraces back into its prior range.
This movement indicates a false breakout, and the indicator displays a Sell Entry Signal with a red arrow.

Indicator Settings
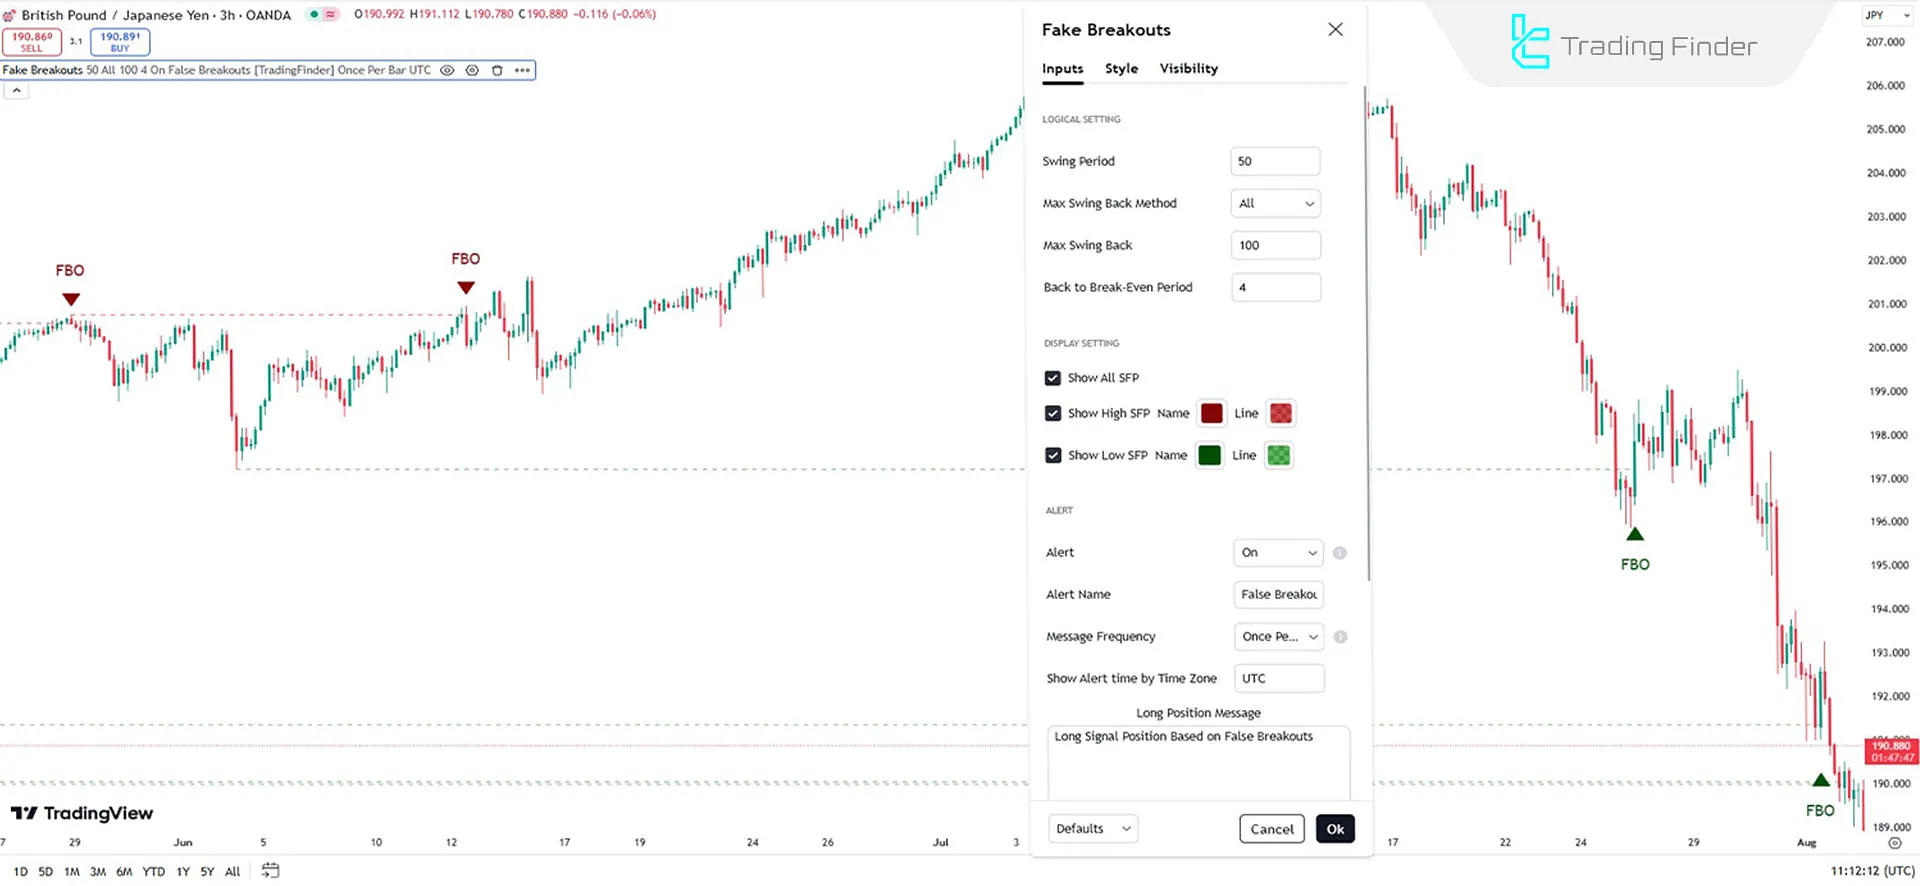
The complete settings of the Fake Breakout Indicator are shown in the image below. The settings of this indicator include [Logical Setting, Display Setting, and Alert]:

Logical Setting
- Swing Period: The period for calculating swings (default: 50)
- Max Swing Back Method: Identifies the maximum swing back
- Max Swing Back: The maximum swing back value
- Back to Breakeven Period: The return to range period (default: 4)
Display Setting
- Show All SFP: Option to display all false breakouts
- Show High SFP: Displays breakout above the high level in red
- Show Low SFP: Option to display breakout below the low level in green
Alert
- Alert: Sends alerts when patterns are detected
- Alert Name: Custom name for alerts
- Message Frequency: Customizes the alert message content
- Show Alert Time by Time Zone: Displays alert times according to the selected time zone
Conclusion
False breakouts are a key concept in technical analysis, offering powerful tools to identify sudden price changes and leverage them in trading.
Understanding this phenomenon and applying its indicator can help traders achieve better performance in financial markets and avoid potential losses.
False Breakouts TradingView PDF
False Breakouts TradingView PDF
Click to download False Breakouts TradingView PDFWhat is the False Breakouts Indicator?
The False Breakouts Indicator identifies areas where the price temporarily exceeds a specific support or resistance level before quickly returning to its previous range.
Is this indicator suitable for beginners?
No, the False Breakouts Indicator is designed for advanced traders as it requires a deep understanding of technical analysis and pattern recognition.


