


TradingView
MetaTrader4
MetaTrader5
The 2022 Model ICT Entry Strategy Indicator is an advanced trading strategy based on the ICT style, developed with a focus on liquidity analysis and price imbalance.
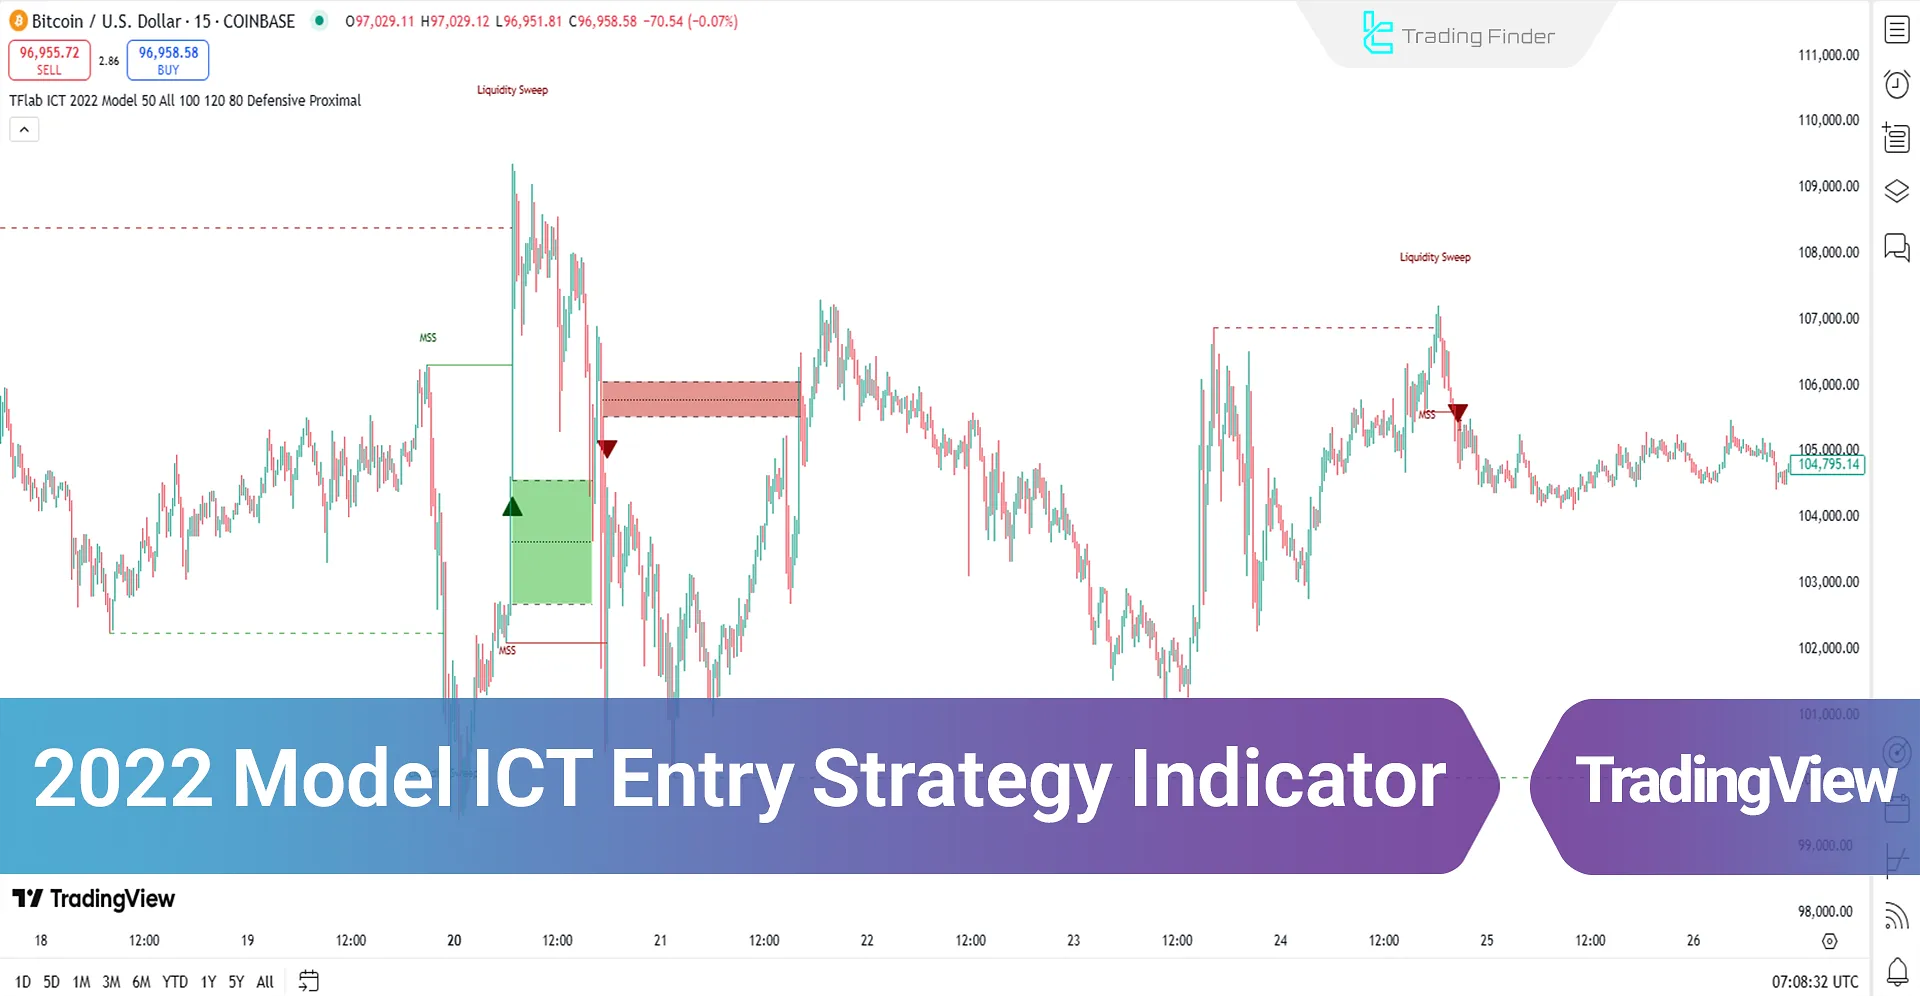
This model includes Fair Value Gap (FVG), Liquidity Draw, and Market Structure Shift (MSS), where time and price are two key components in trade decision-making.
2022 Model ICT Entry Strategy Indicator Specifications Table
The general specifications and features of the 2022 Model ICT Entry Strategy Indicator are displayed in the table below:
Indicator Categories: | ICT Tradingview Indicators Smart Money Tradingview Indicators Liquidity Tradingview Indicators |
Platforms: | Trading View Indicators |
Trading Skills: | Advanced |
Indicator Types: | Reversal Tradingview Indicators |
Timeframe: | Multi-Timeframe Tradingview Indicators |
Trading Style: | Intraday Tradingview Indicators |
Trading Instruments: | TradingView Indicators in the Forex Market Cryptocurrency Tradingview Indicators Stock Tradingview Indicators Commodity Tradingview Indicators Indices Tradingview Indicators Forward Tradingview Indicators Share Stocks Tradingview Indicators |
Indicator Overview
The ICT model strategy is designed for intraday trading. It identifies the swing lows and swing highs of major trading sessions such as London and New York.
The identified levels are recognized as Liquidity Zones and change color based on market trends: Red for a downtrend and Green for an uptrend.
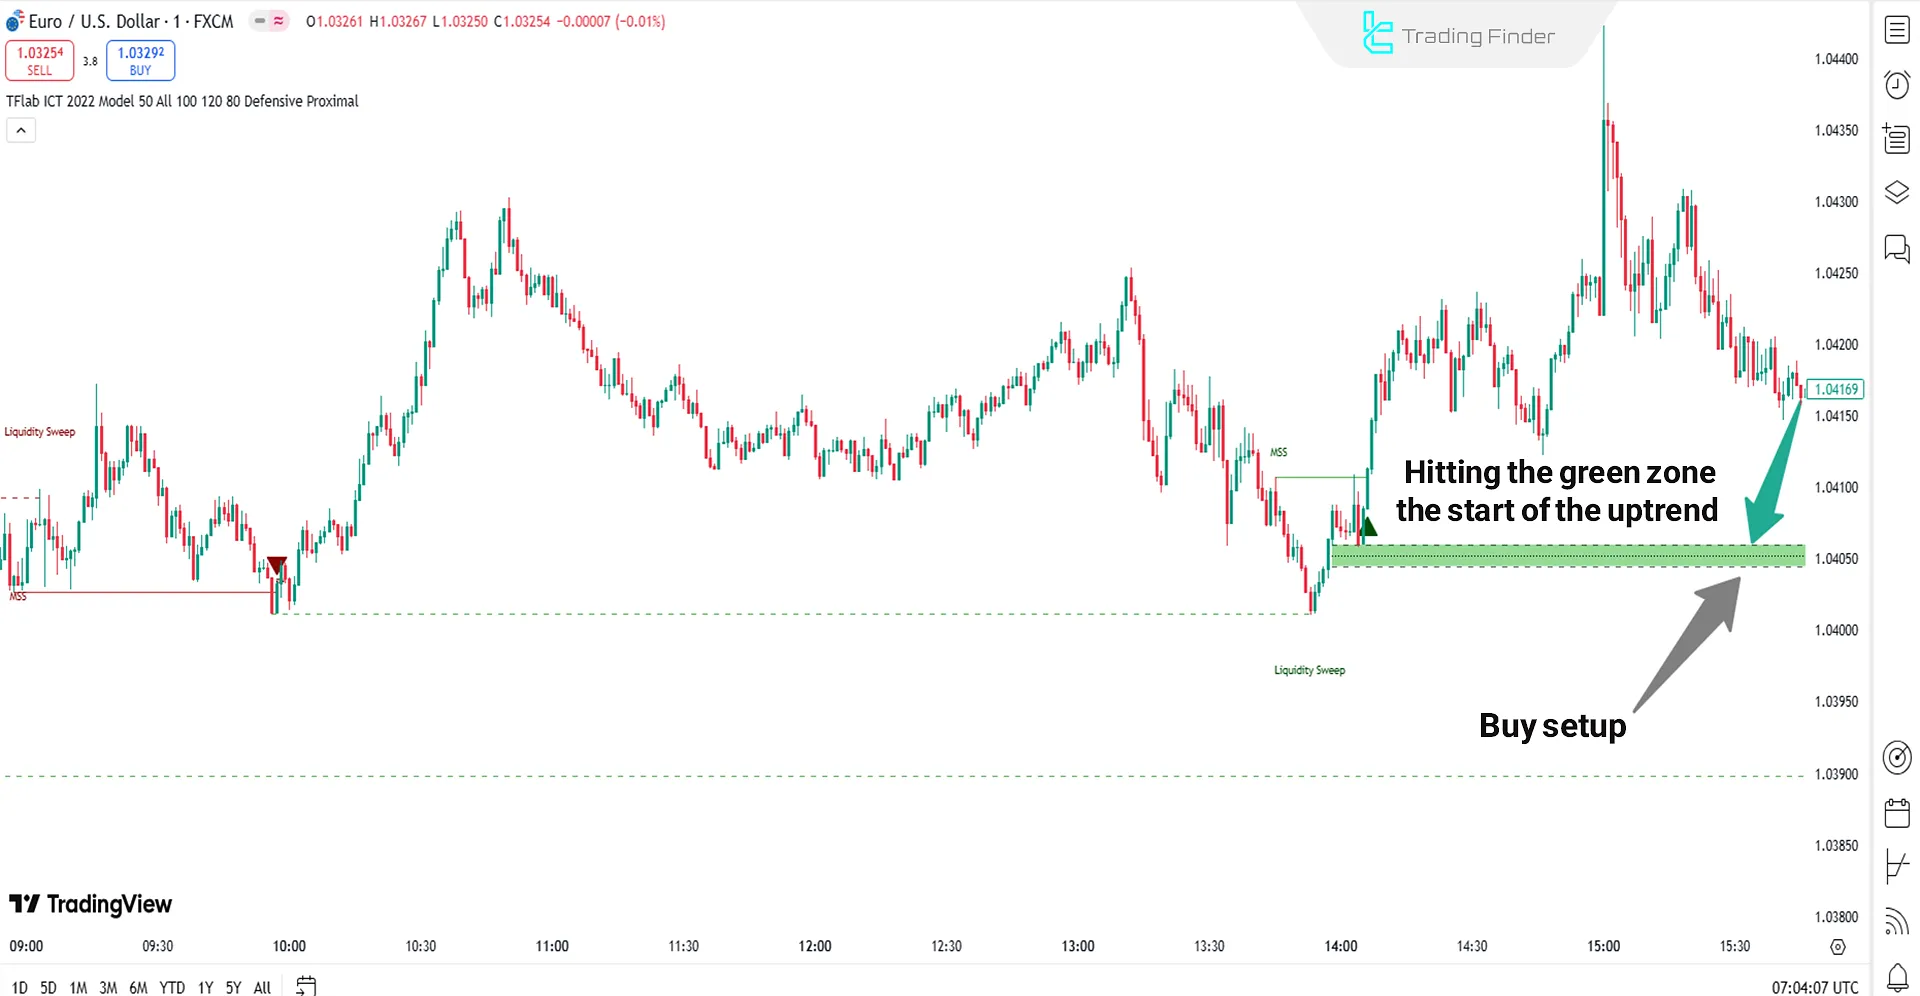
Uptrend Scenario
In the bullish scenario of the EUR/USD currency pair based on the 2022 Model ICT Entry Strategy Indicator, key liquidity levels, such as the previous day’s high and low or critical session levels, are first identified.
During this process, the price initially moves toward these levels while collecting liquidity (Liquidity Sweep), and then an uptrend begins following a market structure shift (MSS) and a price correction (Green Zone).
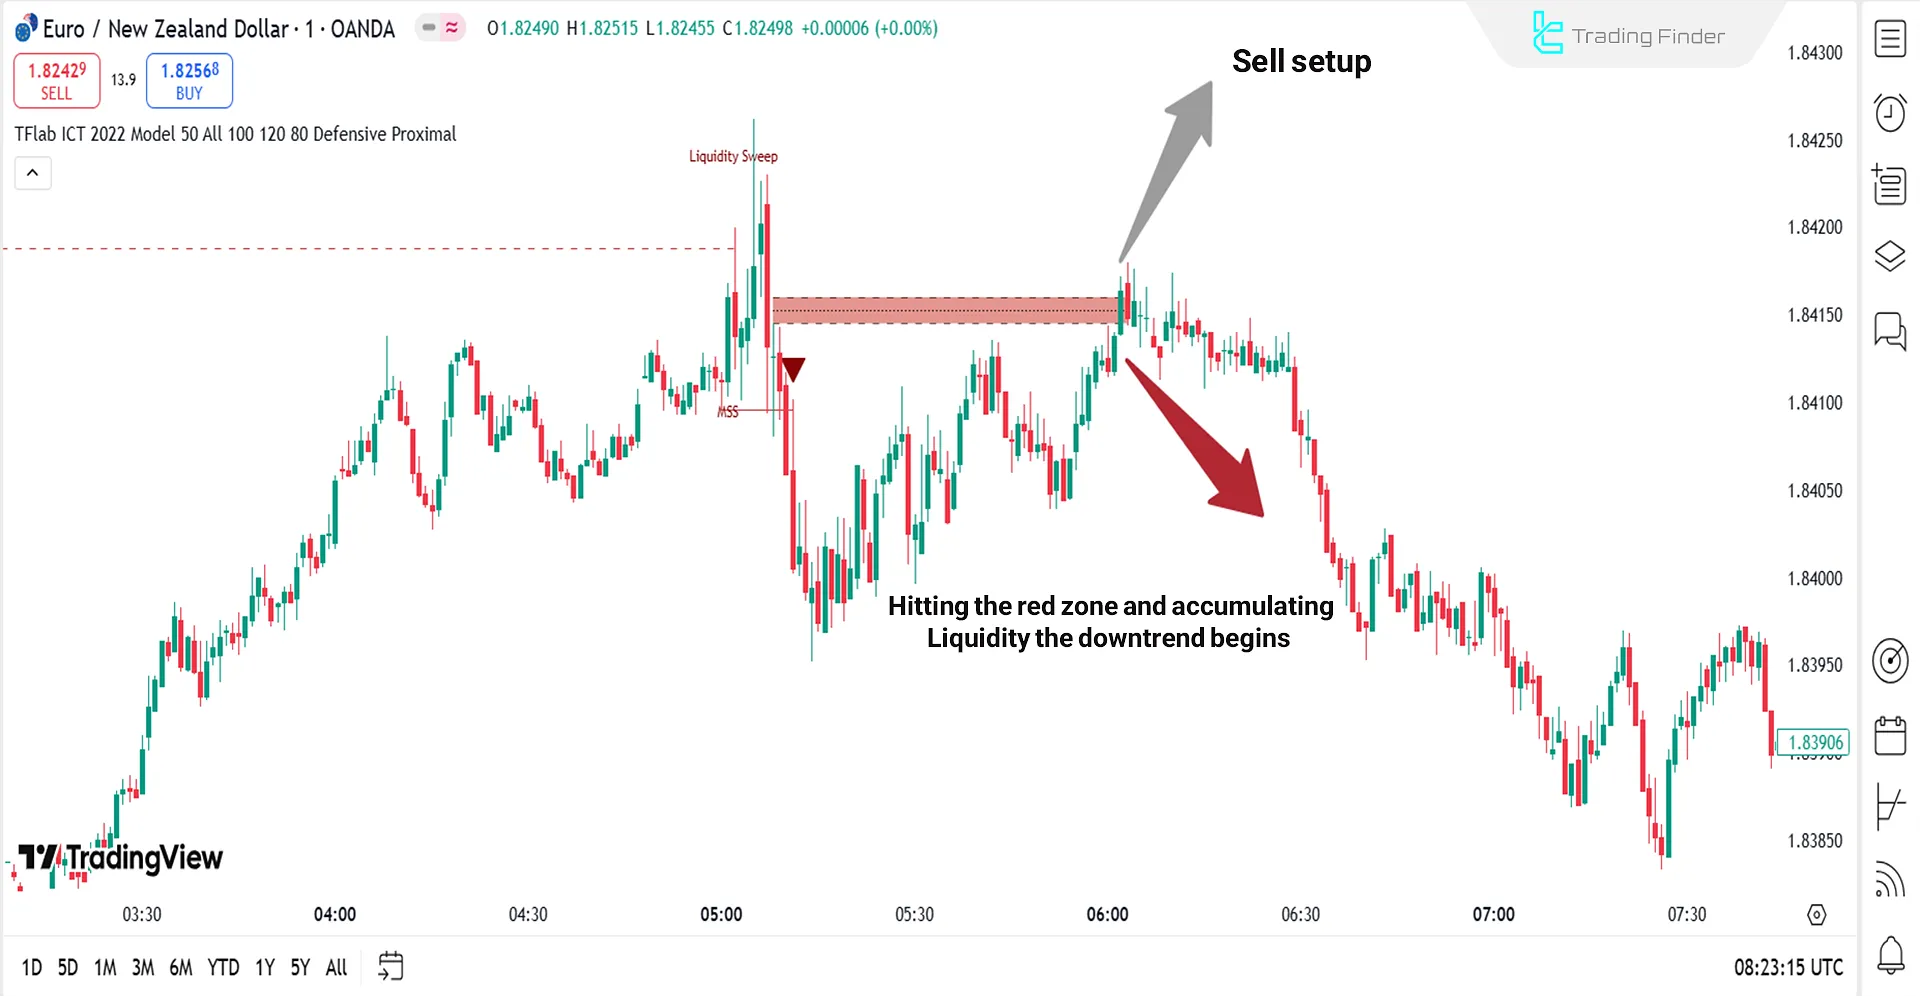
Downtrend Scenario
In theEUR/NZD price chart in the one minute timeframe, the price initially collects liquidity at the high level (Liquidity High) and then begins a downtrend with an MSS.
After this shift, the price returns to Premium Zones and Fair Value Gap (FVG). At this point, a Sell trade is executed.
Indicator Settings
The settings panel for the 2022 Model ICT Entry Strategy Indicator is outlined below:
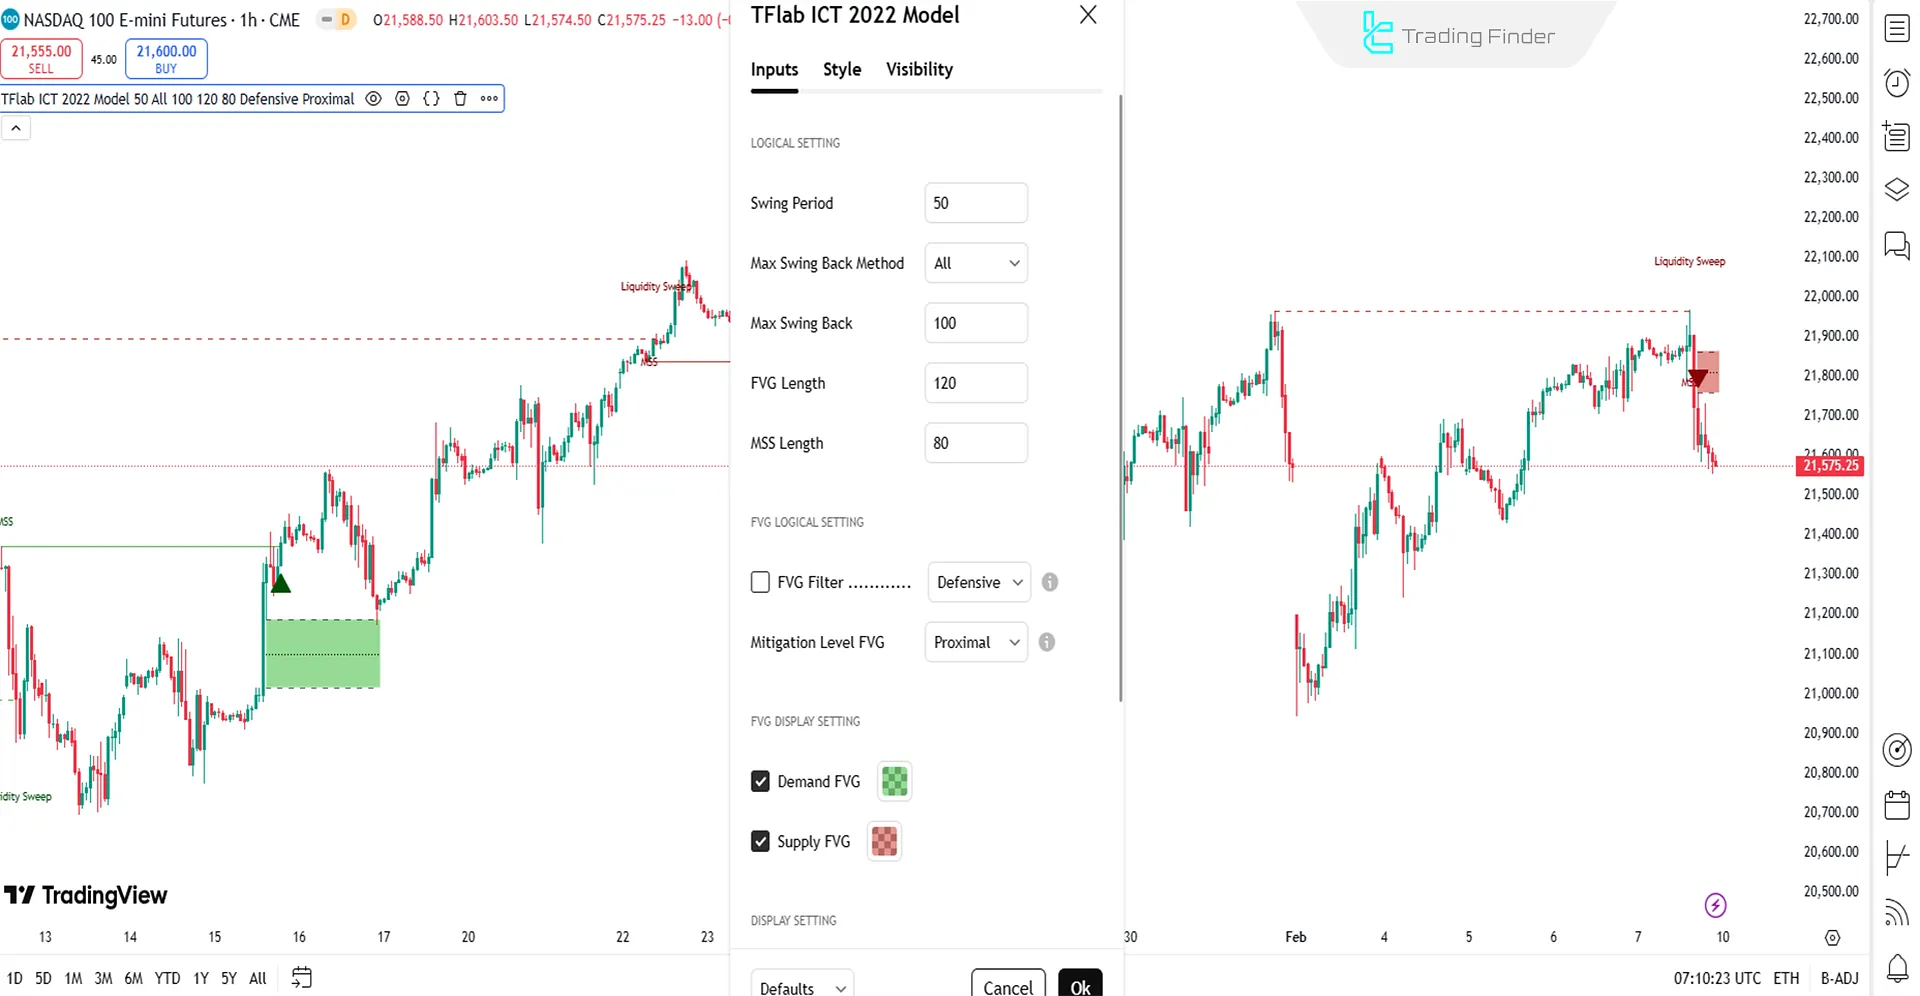
LOGICAL SETTING
- Swing Period: Defines the swing period
- Max Swing Back Method: Determines the max swing back method
- Max Swing Back: Sets the maximum swing back
- FVG Length: Specifies the Fair Value Gap length
- MSS Length: Defines the Market Structure Shift length
FVG LOGICAL SETTING
- FVG Filter: Applies a filter for FVG
- Mitigation Level FVG: Sets the mitigation level for FVG
Conclusion
The 2022 Model ICT Entry Strategy Indicator is a TradingView liquidity indicator built on price imbalance that utilizes concepts such as FVG, Liquidity Sweep, and MSS to identify structural market changes.
2022 Model ICT Entry TradingView PDF
2022 Model ICT Entry TradingView PDF
Click to download 2022 Model ICT Entry TradingView PDFIs the 2022 Model ICT Entry Strategy Indicator only applicable to the Forex market?
No, it applies to all financial markets, including cryptocurrencies, stocks, commodities, and Forex.
Which timeframe is the 2022 Model ICT Entry Strategy Indicator applicable to?
Which timeframe is the 2022 Model ICT Entry Strategy Indicator applicable to?


