


TradingView
MetaTrader4
MetaTrader5
On September 1, 2025, the latest version of this indicator was released. To obtain a free license, click on Online Support and connect with us via Telegram or WhatsApp through the section “Connect with an Expert
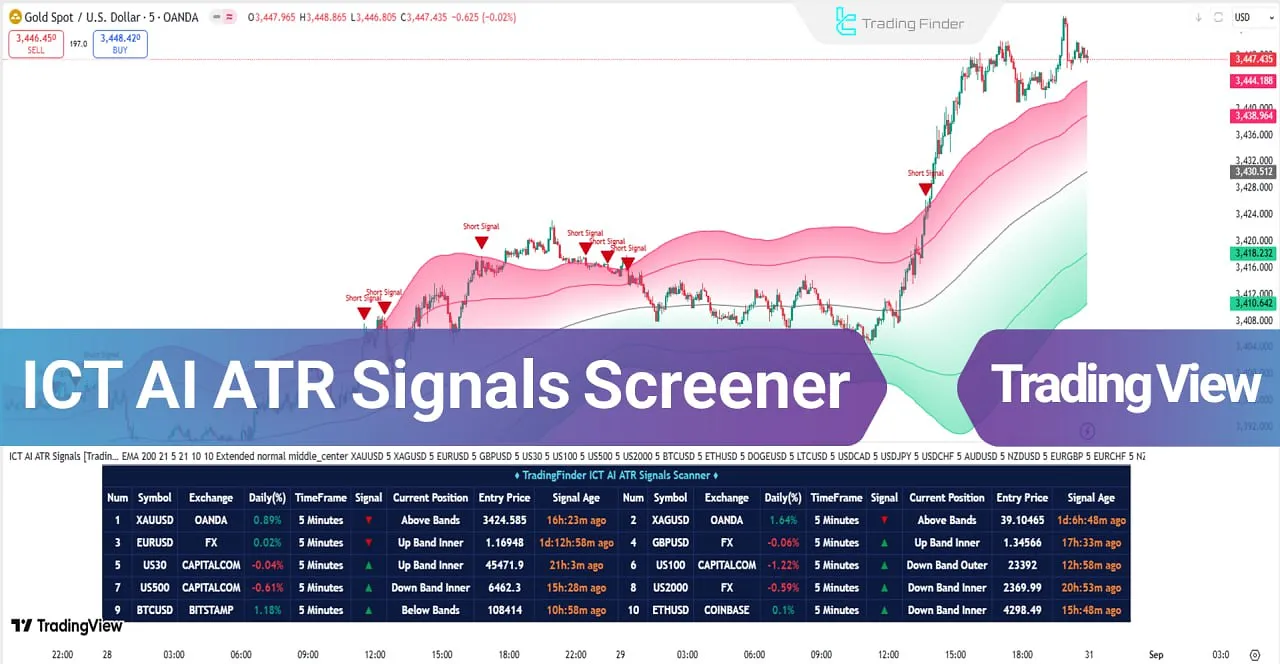
The ICT AI ATR Signals Screener is a combined, intelligent technical analysis tool that simultaneously examines the two main dimensions of the market trend and volatility.
Using a moving average, this indicator enables quick detection of the prevailing trend (bullish or bearish); and by employing ATR, it measures actual market volatility and, through plotting dynamic bands, identifies the role of dynamic supports and resistances.
It also issues valid buy and sell signals based on price behavior relative to these bands, and with the help of an analytical dashboard makes it possible to review 10 symbols from the market at the same time.
ICT AI ATR Signals Specifications Table
The table below presents the features and capabilities of the ICT AI ATR Signals tool:
Indicator Categories: | ICT Tradingview Indicators Smart Money Tradingview Indicators Liquidity Tradingview Indicators |
Platforms: | Trading View Indicators |
Trading Skills: | Advanced |
Indicator Types: | Reversal Tradingview Indicators Breakout Tradingview Indicators |
Timeframe: | Multi-Timeframe Tradingview Indicators |
Trading Style: | Intraday Tradingview Indicators |
Trading Instruments: | TradingView Indicators in the Forex Market Cryptocurrency Tradingview Indicators Stock Tradingview Indicators Commodity Tradingview Indicators Indices Tradingview Indicators Share Stocks Tradingview Indicators |
ICT AI ATR Signals at a Glance
The ICT AI ATR Signals is designed by combining two essential components, each complementing the other.
This design enables the trader to identify both the market’s direction and the degree of volatility and the true price range at the same time, as follows:
- Trend Filter: Using a Moving Average (MA), the market’s main path is separated from noise and minor fluctuations, displaying the primary trend;
- Volatility Gauge: With ATR, dynamic bands are drawn that, in addition to showing the level of volatility, act as dynamic support and resistance levels and pinpoint key areas of price reaction or breakout.
Note: The combination of these two parts turns the screener into a multi-layered, practical tool that can be used for trend analysis, risk management, and identifying important price zones.
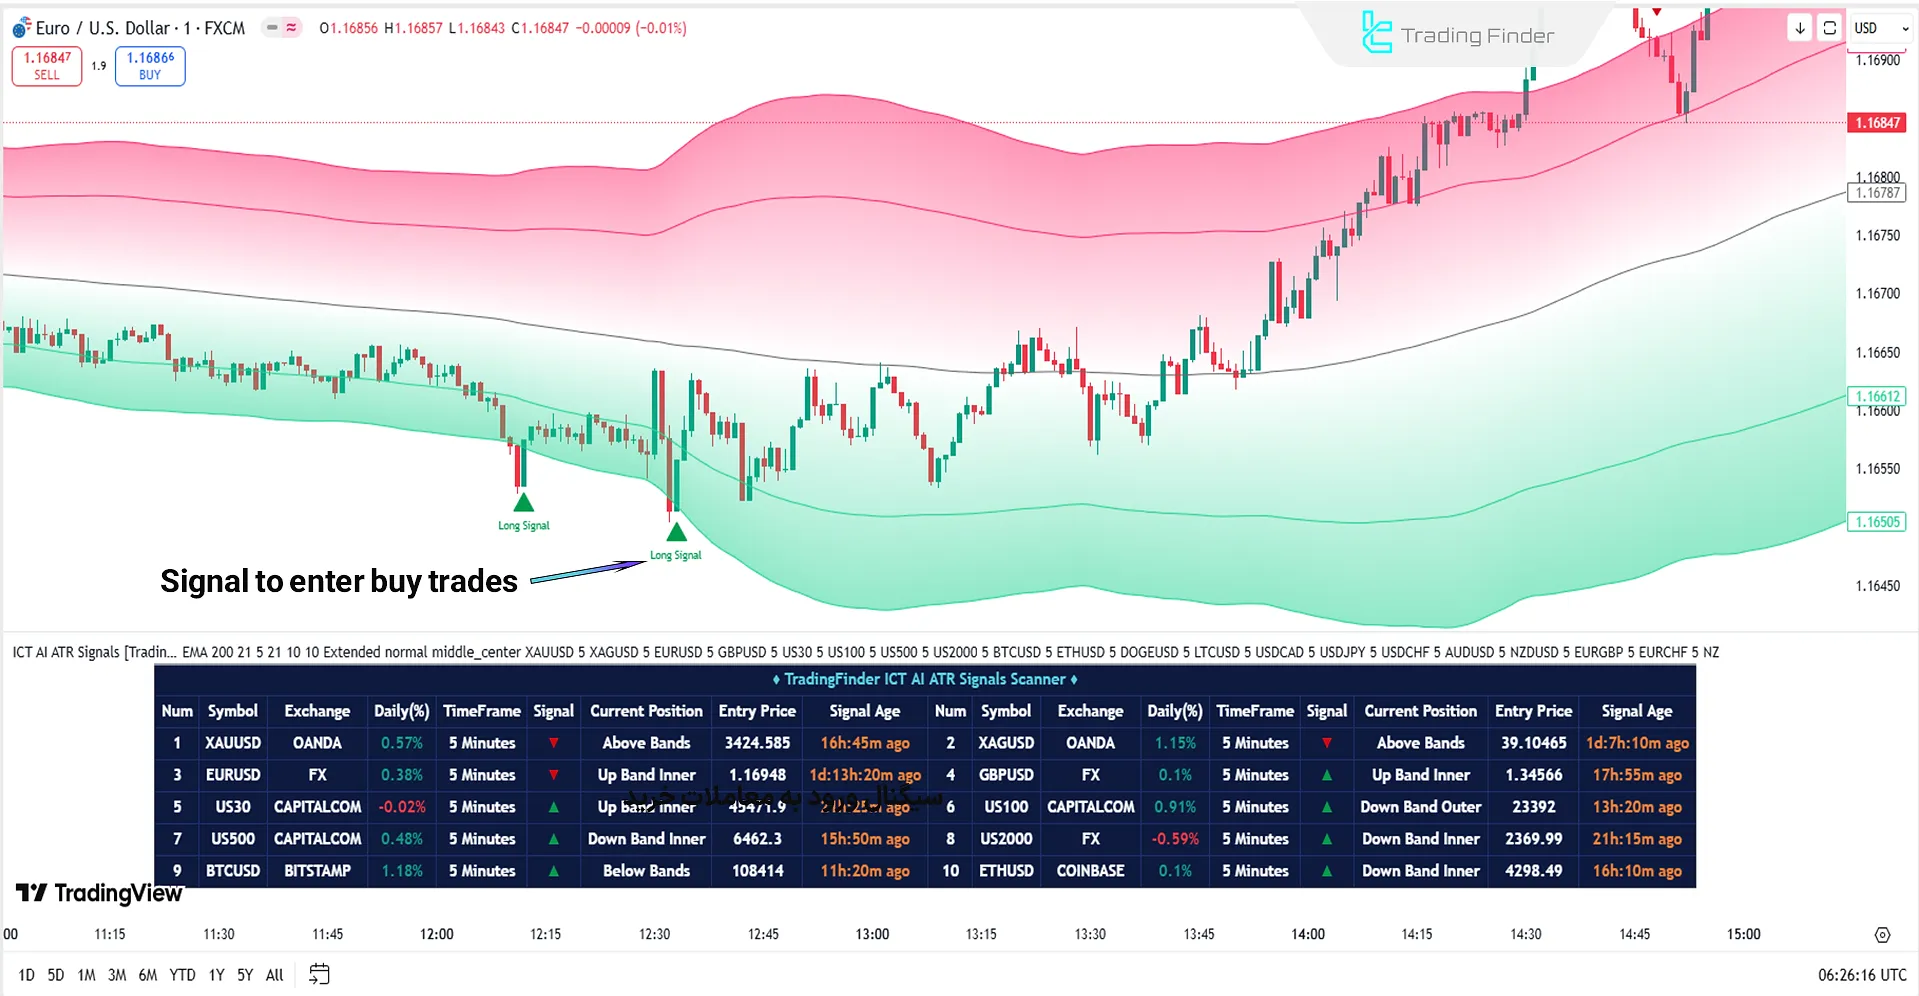
Screener Performance in an Uptrend
In the bullish scenario, when the price is above the Moving Average (MA) midline, the prevailing trend turns bullish. When the upper ATR band is broken and the price closes afterward, a buy signal is issued.
Furthermore, holding above the midline indicates strengthening of the ongoing uptrend. Meanwhile, the lower ATR band acts as a dynamic support, and a touch of price to it can be considered a renewed opportunity to enter long trades.
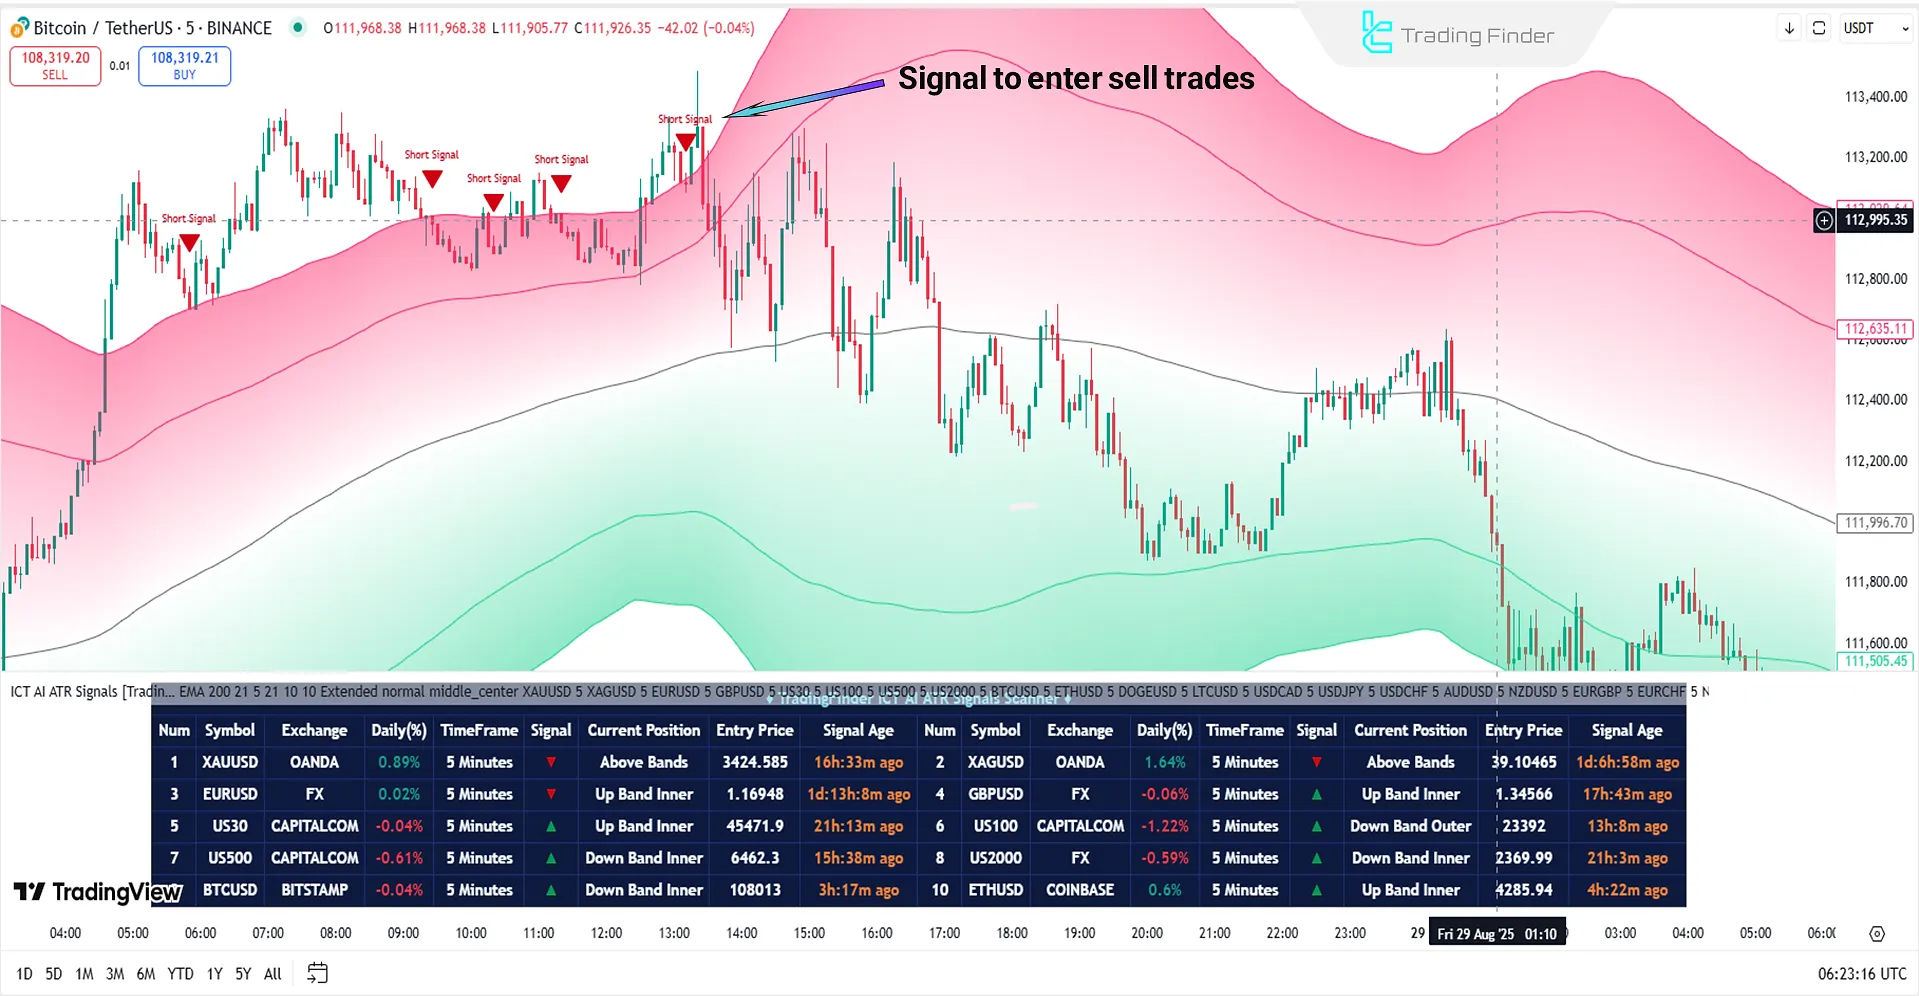
Screener Performance in a Downtrend
In the bearish scenario, when the price penetrates below the Moving Average (MA) midline and consolidates in that area, conditions are set for increasing selling pressure.
Under these conditions, a break of the lower ATR band, followed by a price rebound back above it, can signal the start of a new bearish wave.
In this screener, the upper ATR band serves as a dynamic resistance, and a touch of price to this level offers a suitable opportunity for entering short trades.
Settings of the ICT AI ATR Signals Screener
The image below shows the detailed settings of the ICT AI ATR Signals Screener (ICT AI ATR Signals):
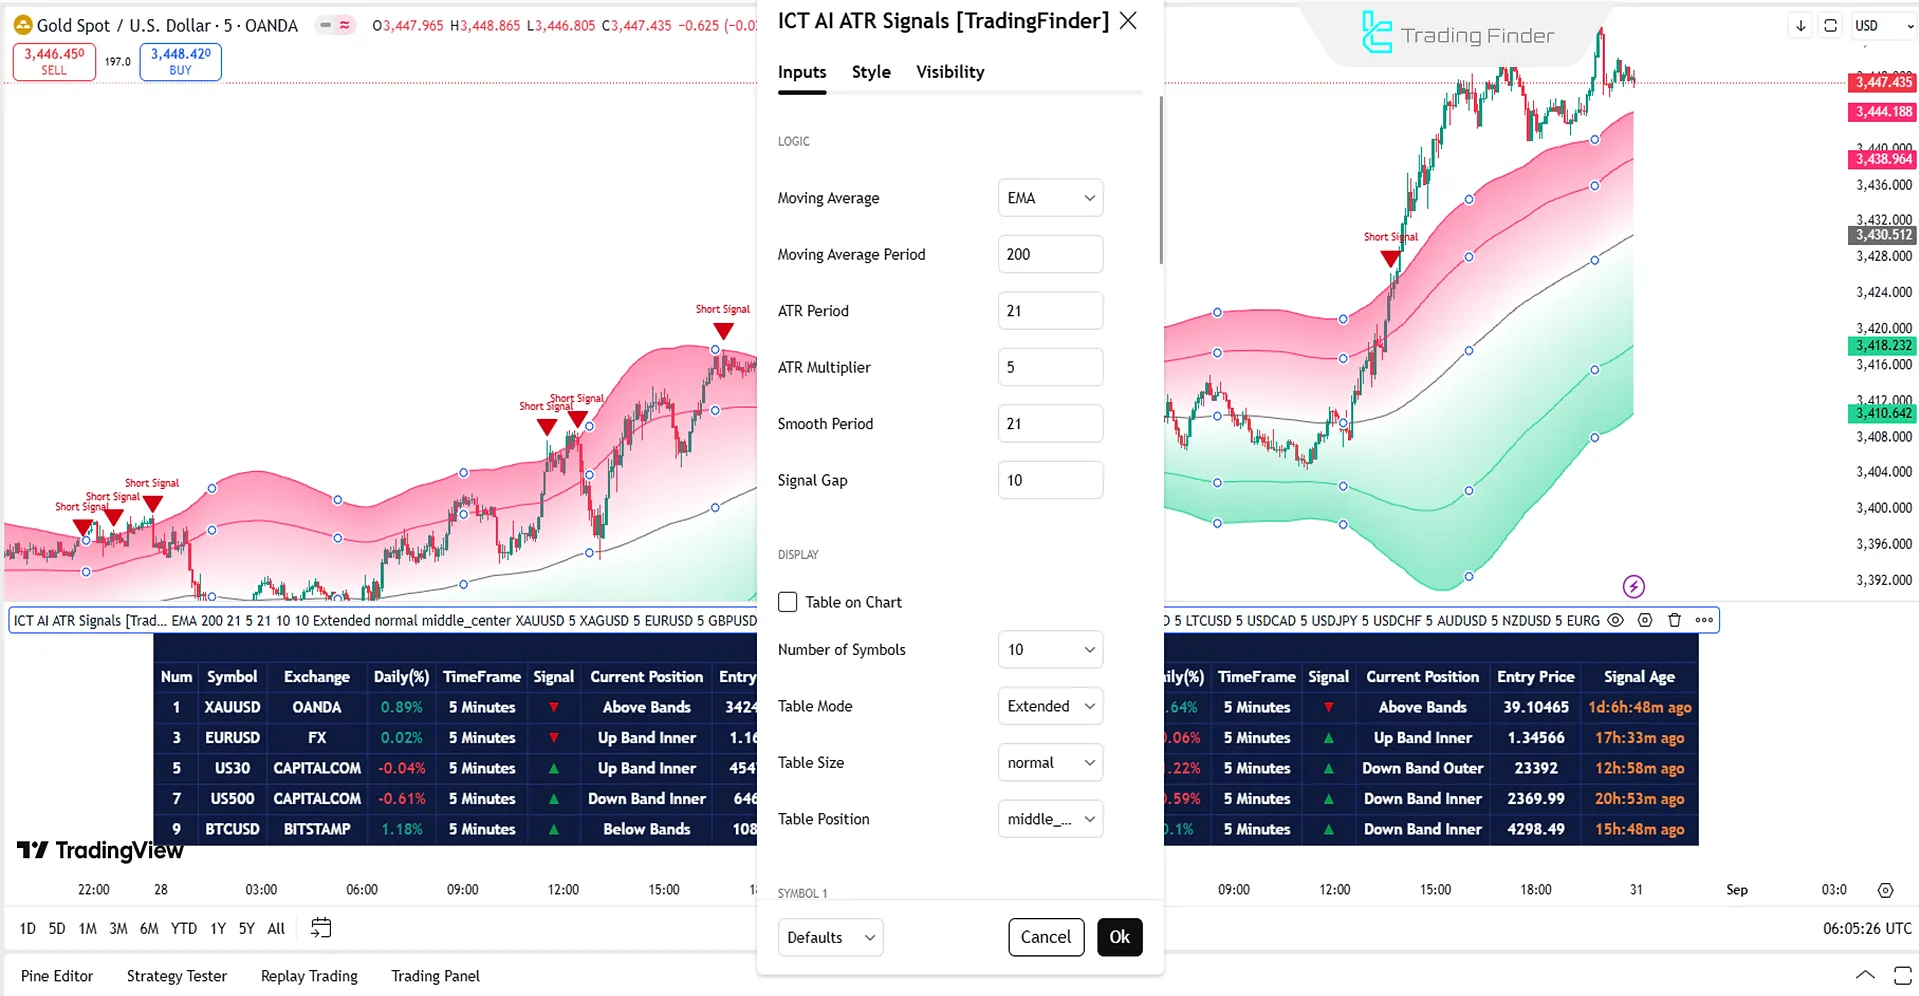
Logical Settings
- Moving Average Type: type of moving average
- Moving Average Period: moving-average period
- ATR Period: ATR period
- ATR Multiplier: ATR multiplier display
- Smooth Period: smoothing period
- Signal Gap: signal gap
Display Settings
- Table on Chart: display table on chart
- Number of Symbols: number of symbols
- Table Mode: table mode
- Table Size: table size
- Table Position: table position
Symbol Settings
- Each of the 10 symbols: ability to review 10 instruments
Alert Settings
- Alert: Display alert
- Message Frequency: alert-message frequency
- Show Alert Time by Time Zone: display alert time based on time zone
Conclusion
The ICT AI ATR screener, by combining a moving average and ATR, examines trend direction and the intensity of true volatility.
Beyond analyzing the trend and volatility of a single chart, this screener—via its dashboard—allows simultaneous review of 10 trading symbols across multiple timeframes.
ICT AI ATR Signals Screener on TradingView PDF
ICT AI ATR Signals Screener on TradingView PDF
Click to download ICT AI ATR Signals Screener on TradingView PDFDoes the ICT AI ATR Signals Screener support reviewing multiple symbols simultaneously?
Yes; this tool has an analytical dashboard that enables reviewing more than 20 assets in multiple timeframes and in real time.
When does the ICT AI ATR Signals Screener have the highest effectiveness?
This trading tool is most effective in trending markets, because in such conditions the overall trend direction is clearly defined.
Please i need permission to use this indicator

Please contact us on Telegram to access the indicators.
Por favor permiso para utilizar este indicador.
To get access, please contact our team on Telegram.
Hi!! I can't find your telegram link anywhere!!! How do I access it?
Hello! Please get in touch with our support team via Telegram or WhatsApp. 🔹https://t.me/TFLABS 🔸https://wa.me/971581022550
ICT ATR Signals Screener is an excellent tool for traders looking to effectively detect volatility and potential breakout signals. It provides clear, easy-to-understand alerts that help in making timely decisions. The accuracy of the signals is impressive, and the interface is user-friendly, making it suitable for both beginners and experienced traders. Highly recommend for anyone wanting to improve their ATR-based trading


