TradingView
MetaTrader4
MetaTrader5
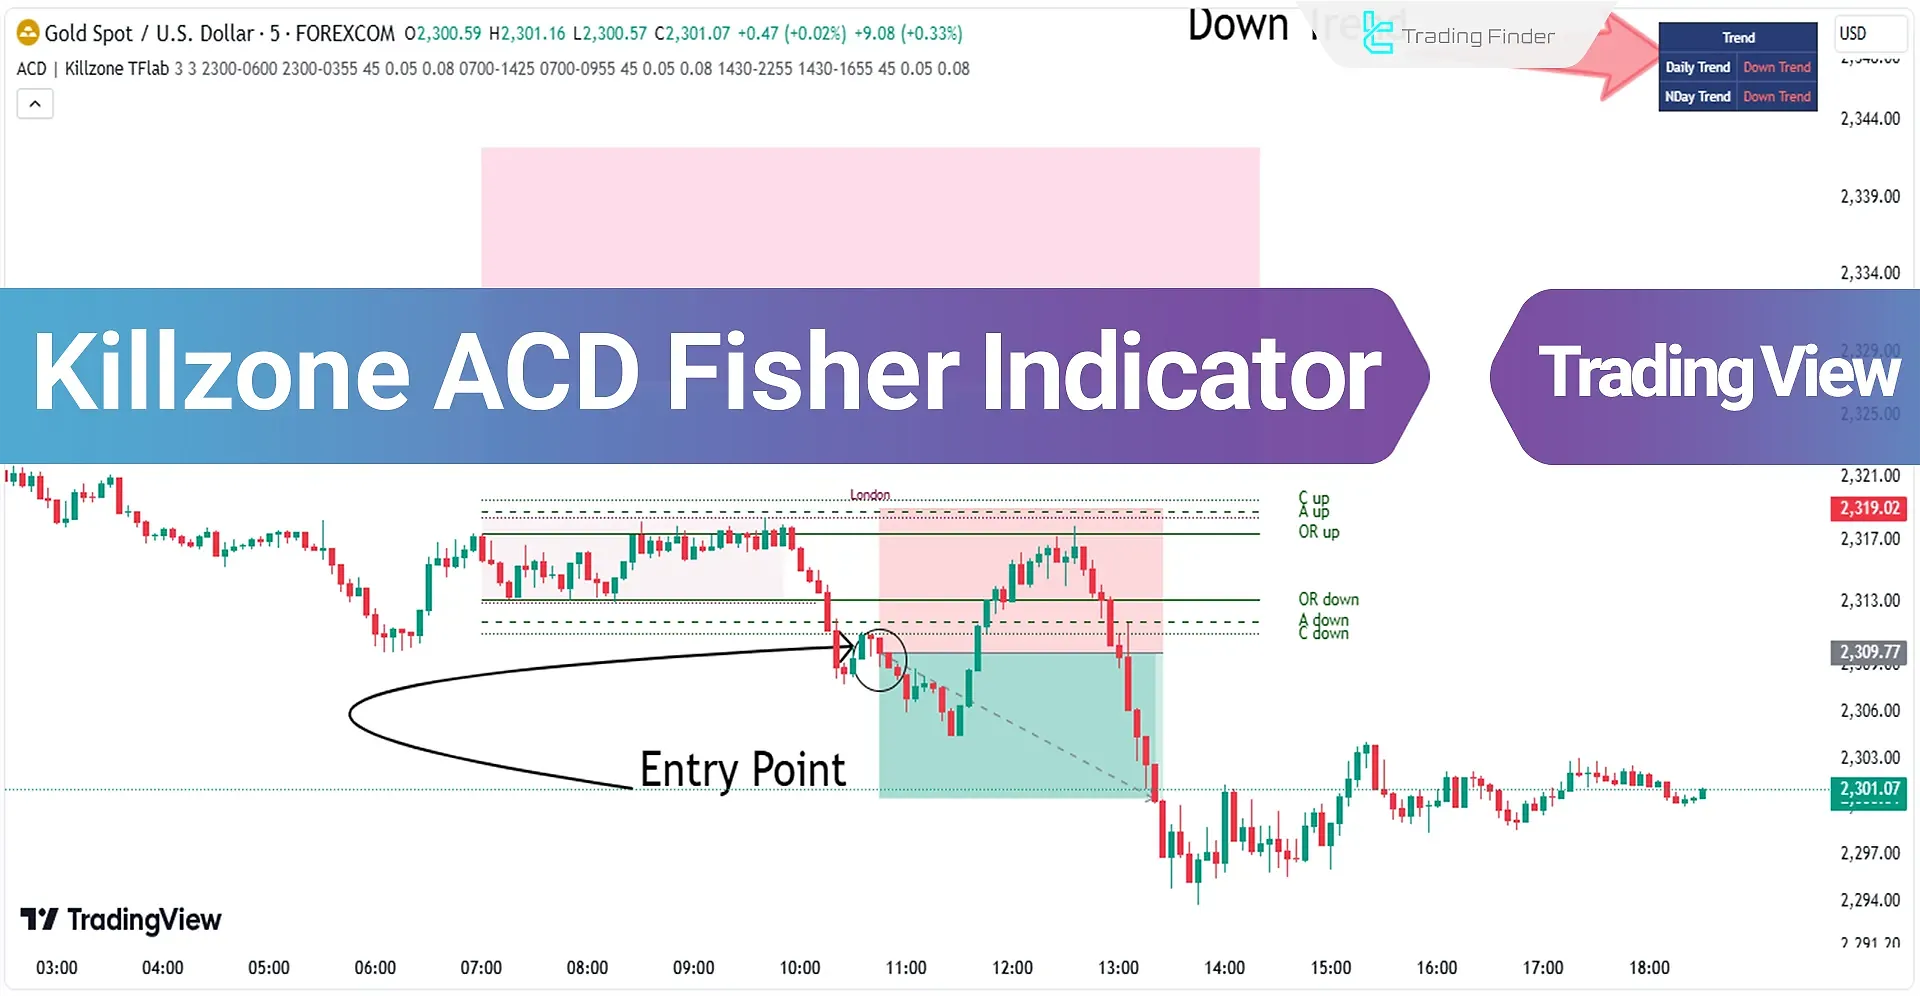
The Killzone ACD Fisher Indicator, which refers to the strategy developed by Mark Fisher, is a technical analysis tool on TradingView indicator used to identify trend direction at the start of various markets occurring in Killzones.
A Killzone refers to parts of a trading session with higher trading volume and significant price movements.

Integrating the Killzone strategy with the ACD method enhances the accuracy of trade entries and exits, leading to improved performance and outcomes in trading.
Indicator Table
Indicator Categories: | Supply & Demand Tradingview Indicators Session & KillZone Tradingview Indicators Levels Tradingview Indicators Kill Zones Indicators for TradingView |
Platforms: | Trading View Indicators |
Trading Skills: | Intermediate |
Indicator Types: | Range Tradingview Indicators Breakout Tradingview Indicators |
Timeframe: | M1-M5 Time Tradingview Indicators M30-M15 Time Tradingview Indicators |
Trading Style: | Day Trading Tradingview Indicators Scalper Tradingview Indicators |
Trading Instruments: | TradingView Indicators in the Forex Market Commodity Tradingview Indicators Share Stocks Tradingview Indicators |
Overview
The ACD trading strategy is a well-established breakout strategy that performs particularly well in volatile markets. Its combination with Killzones can yield much better results.
Therefore, it can be used in the Asia Killzone from 23:00 to 03:55, the London Killzone from 07:00 to 09:55, and the New York Morning Killzone from 14:30 to 16:55 UTC.
Bullish Setup Signal Conditions
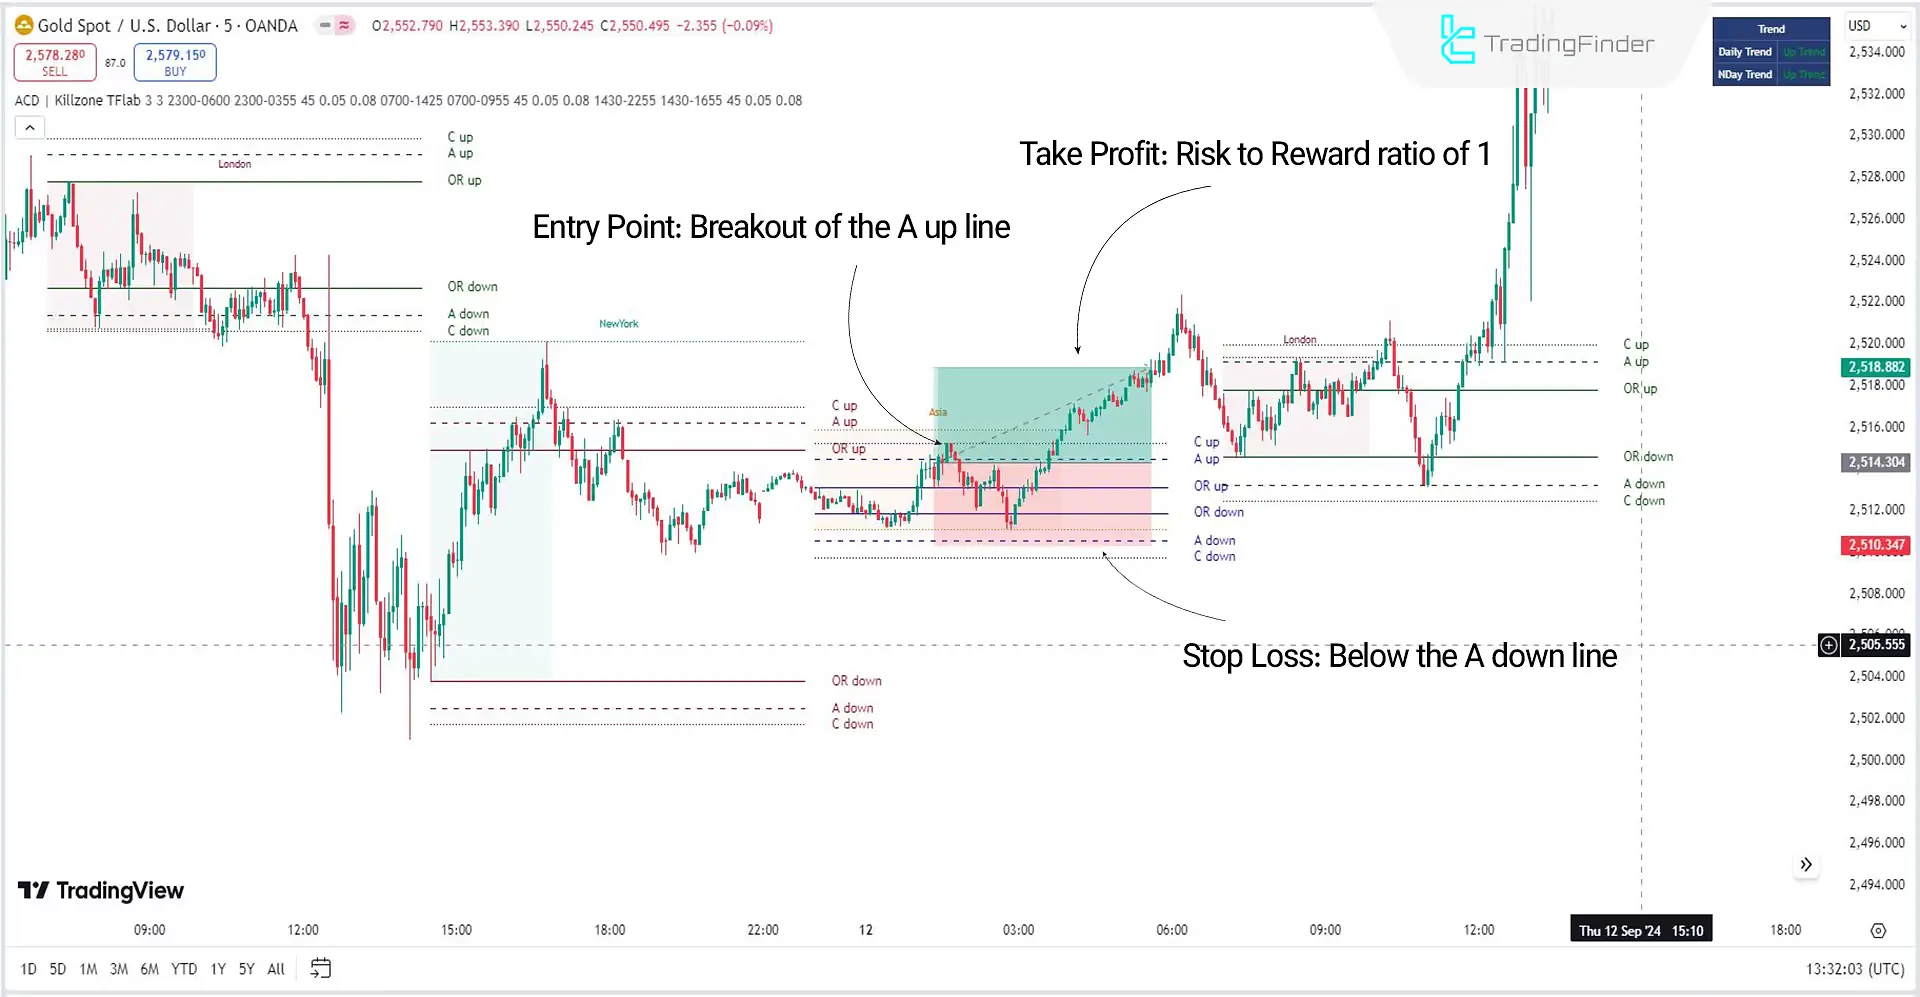
The image below shows the Gold (XAUUSD) price chart in a 5-minute timeframe. The breakout of the A up line in the Asia Killzone generates a bullish trend signal. With a 7-minute confirmation, one can enter a buy trade.
Take-Profit and Stop-Loss for Buy Trades with the ACD Indicator
After entering the trade, the stop-loss can be set below the A down line, as shown in the image, and the take-profit can be set using a Reward to Risk ratio of 1.

Bearish Setup Signal Conditions
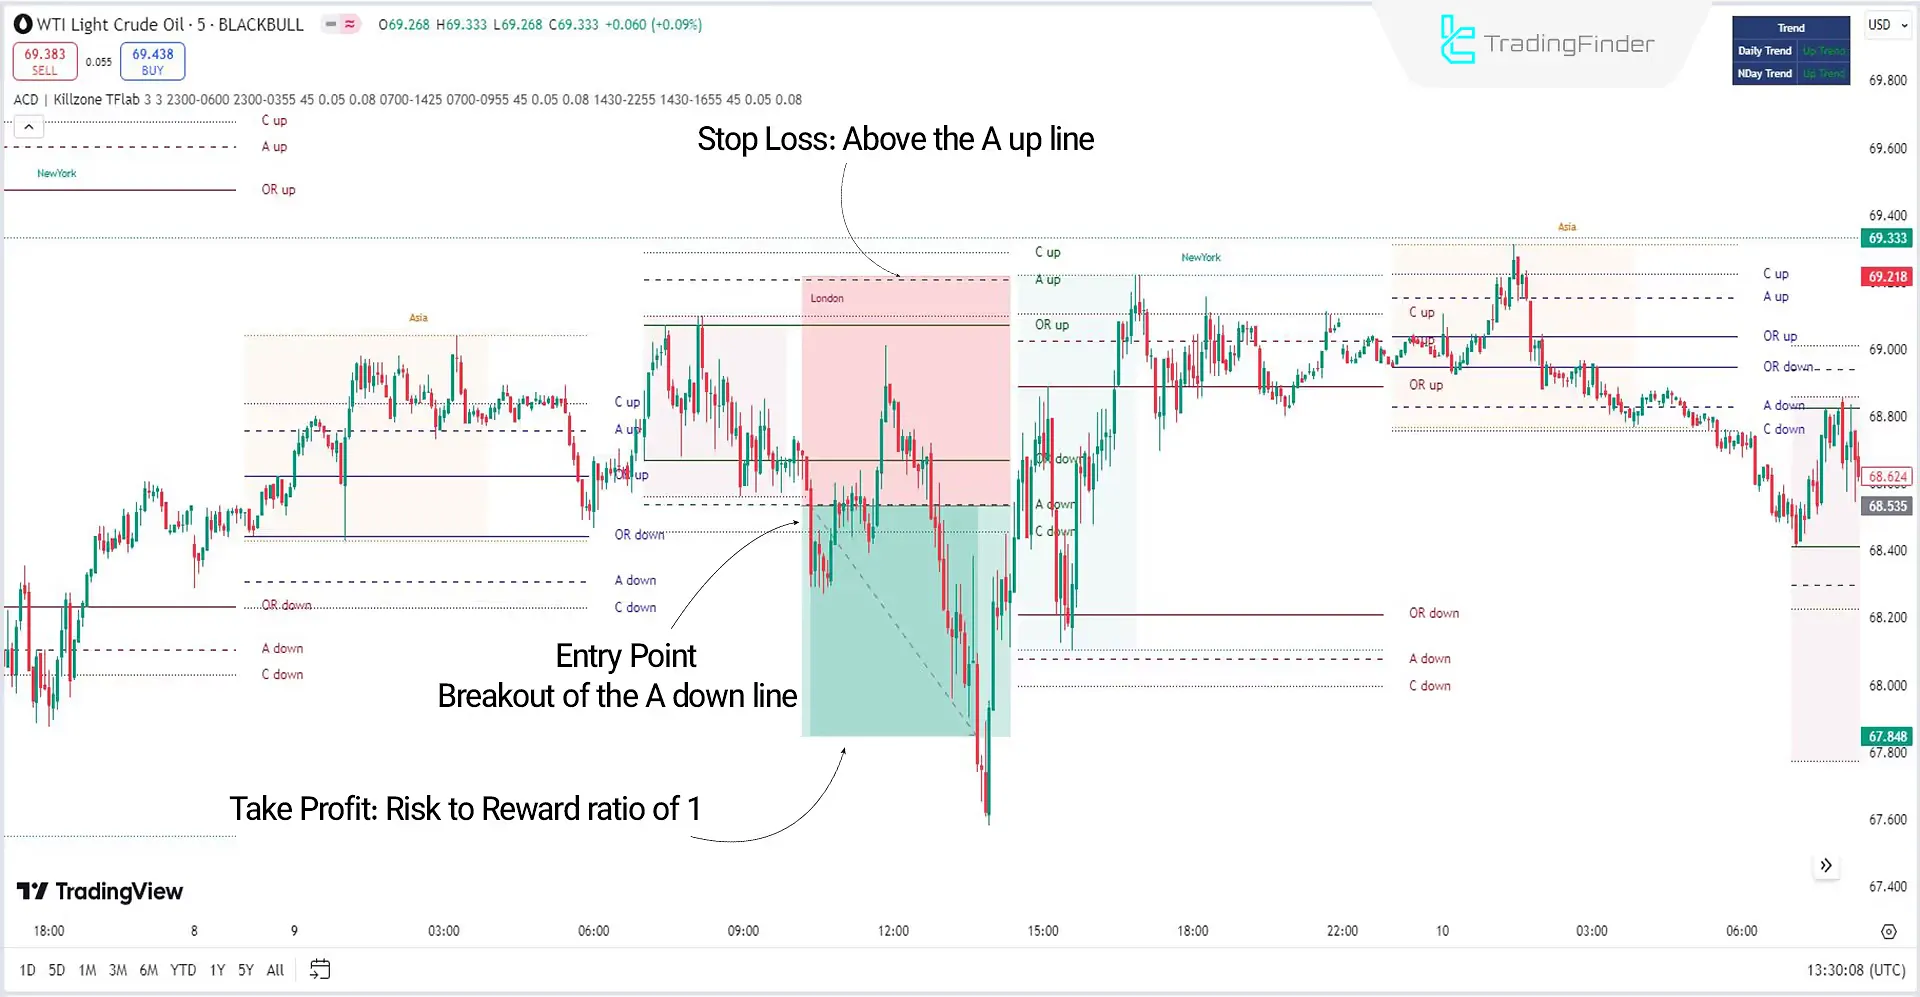
The image below displays the West Texas Intermediate (WTI) price chart on a 5-minute timeframe.
The breakout of the A downline in the London Killzone generates a bearish trend signal. A 7-minute confirmation below allows one to enter a sell trade.
Take-Profit and Stop-Loss for Sell Trades with the ACD Indicator
After entering the trade, the stop-loss can be set above the A up line, as shown in the image, and the take-profit can be set using a Reward to Risk ratio of 1.

Indicator Settings

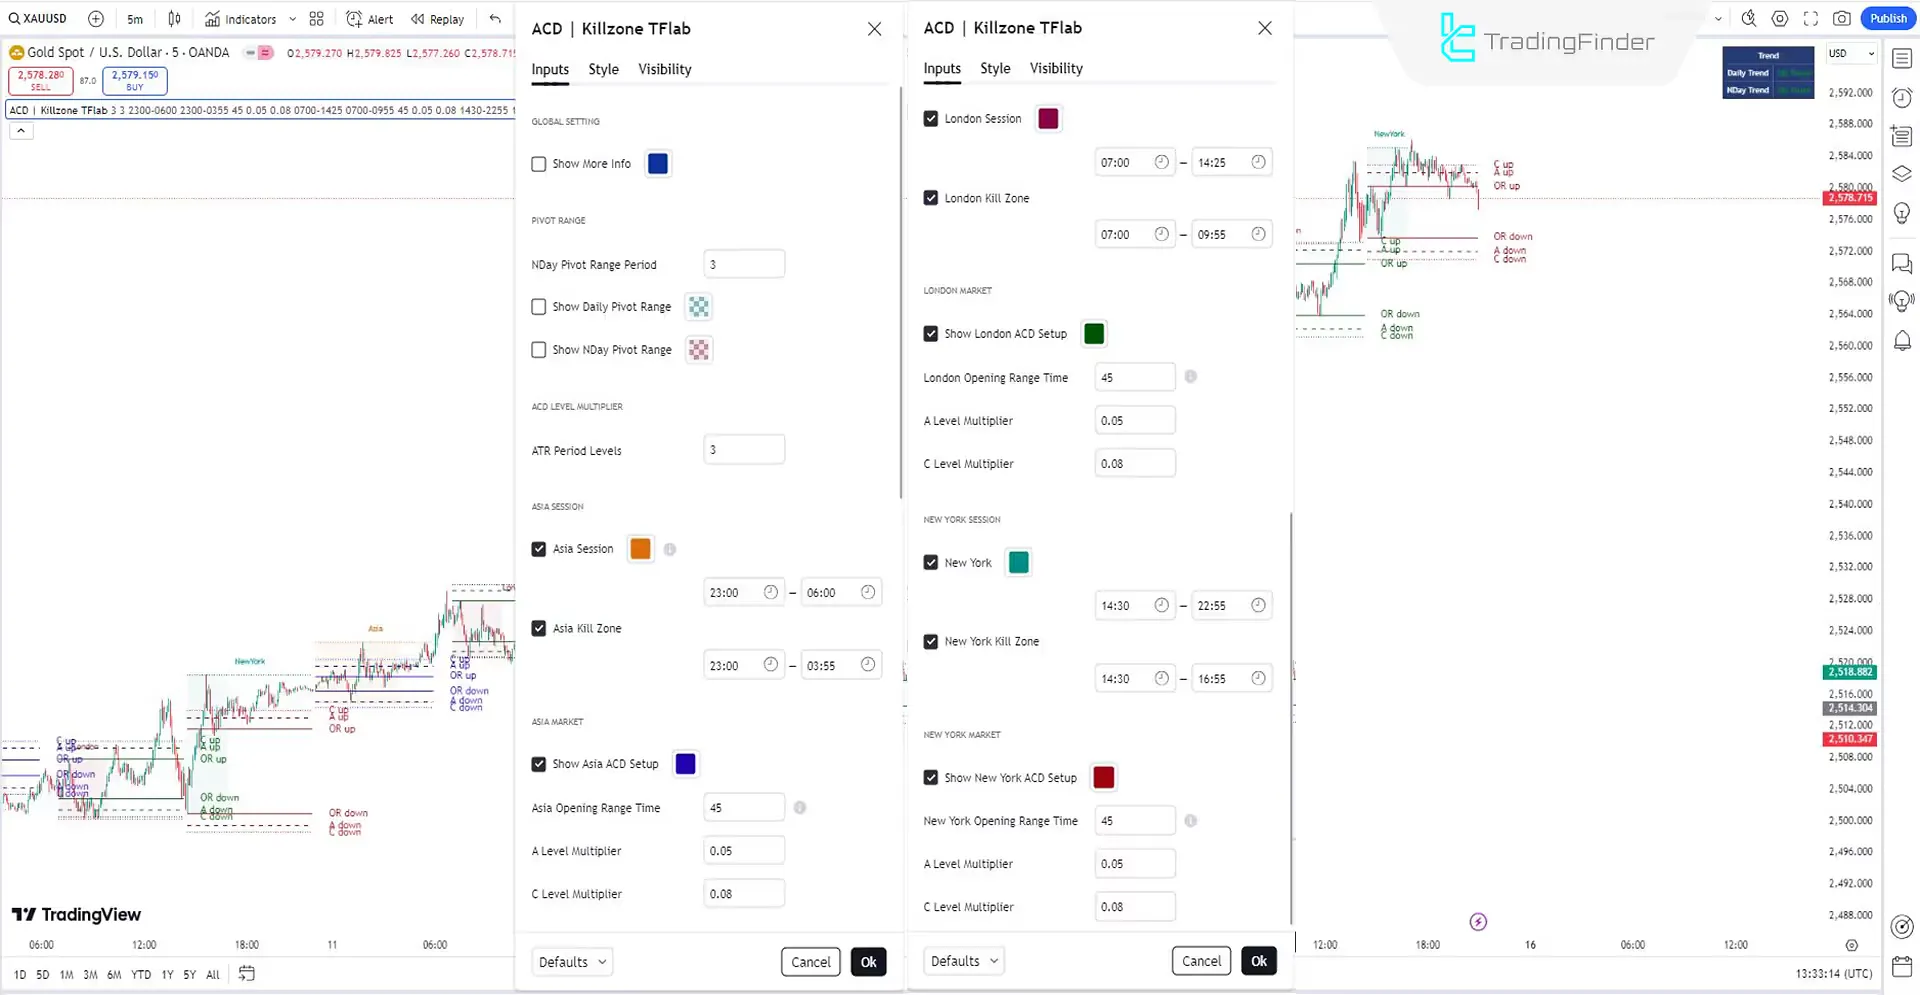
- NDay pivot Range Period: The range period for each pivot is 3;
- ATRPeriod Levels: Calculations in the daily timeframe are, by default, set to 3;
- Asia Session: Asia session is from 23:00 to 06:00;
- Asia Killzone: Asia Killzone is from 23:00 to 06:00;
- Asia Opening Range Time: The Asia opening range time is 45 minutes;
- A Level Multiplier: The distance percentage for A-lines is 05;
- C Level Multiplier: The distance percentage for C lines is 08;
- London Session: The London session is from 07:00 to 14:25;
- London Killzone: London Killzone is from 07:00 to 09:55;
- London Opening Range Time: The London opening range time is 45 minutes;
- New York Session: The New York session is from14:30 to 22:55;
- New York Killzone: New York Killzone is from 14:30 to 16:55;
- New York Opening Range Time: The New York opening range time is 45 minutes.
Conclusion
Combining the Trading View Supply and Demand Indicator (ACD) with the kill zones of trading sessions can significantly impact the win rate of trades. This method quickly identifies intense and volatile trends, optimizing trading strategies.
Implementing the ACD method within Killzones can maximize profit potential while minimizing risk.
Killzone ACD Fisher TradingView PDF
Killzone ACD Fisher TradingView PDF
Click to download Killzone ACD Fisher TradingView PDFWhich markets is the ACD Indicator suitable for?
The ACD Indicator is more effective in volatile markets such as Forex and Stocks.
What are the advantages of using the ACD Indicator alongside Killzones?
Using the ACD Indicator within Killzones helps traders identify solid trends and increase their win rate.


