


The Linear Regression Channel Indicator is a useful tool among TradingView Indicators that helps identify Support Levels, Resistance Levels, and analyze Uptrends and Downtrends.
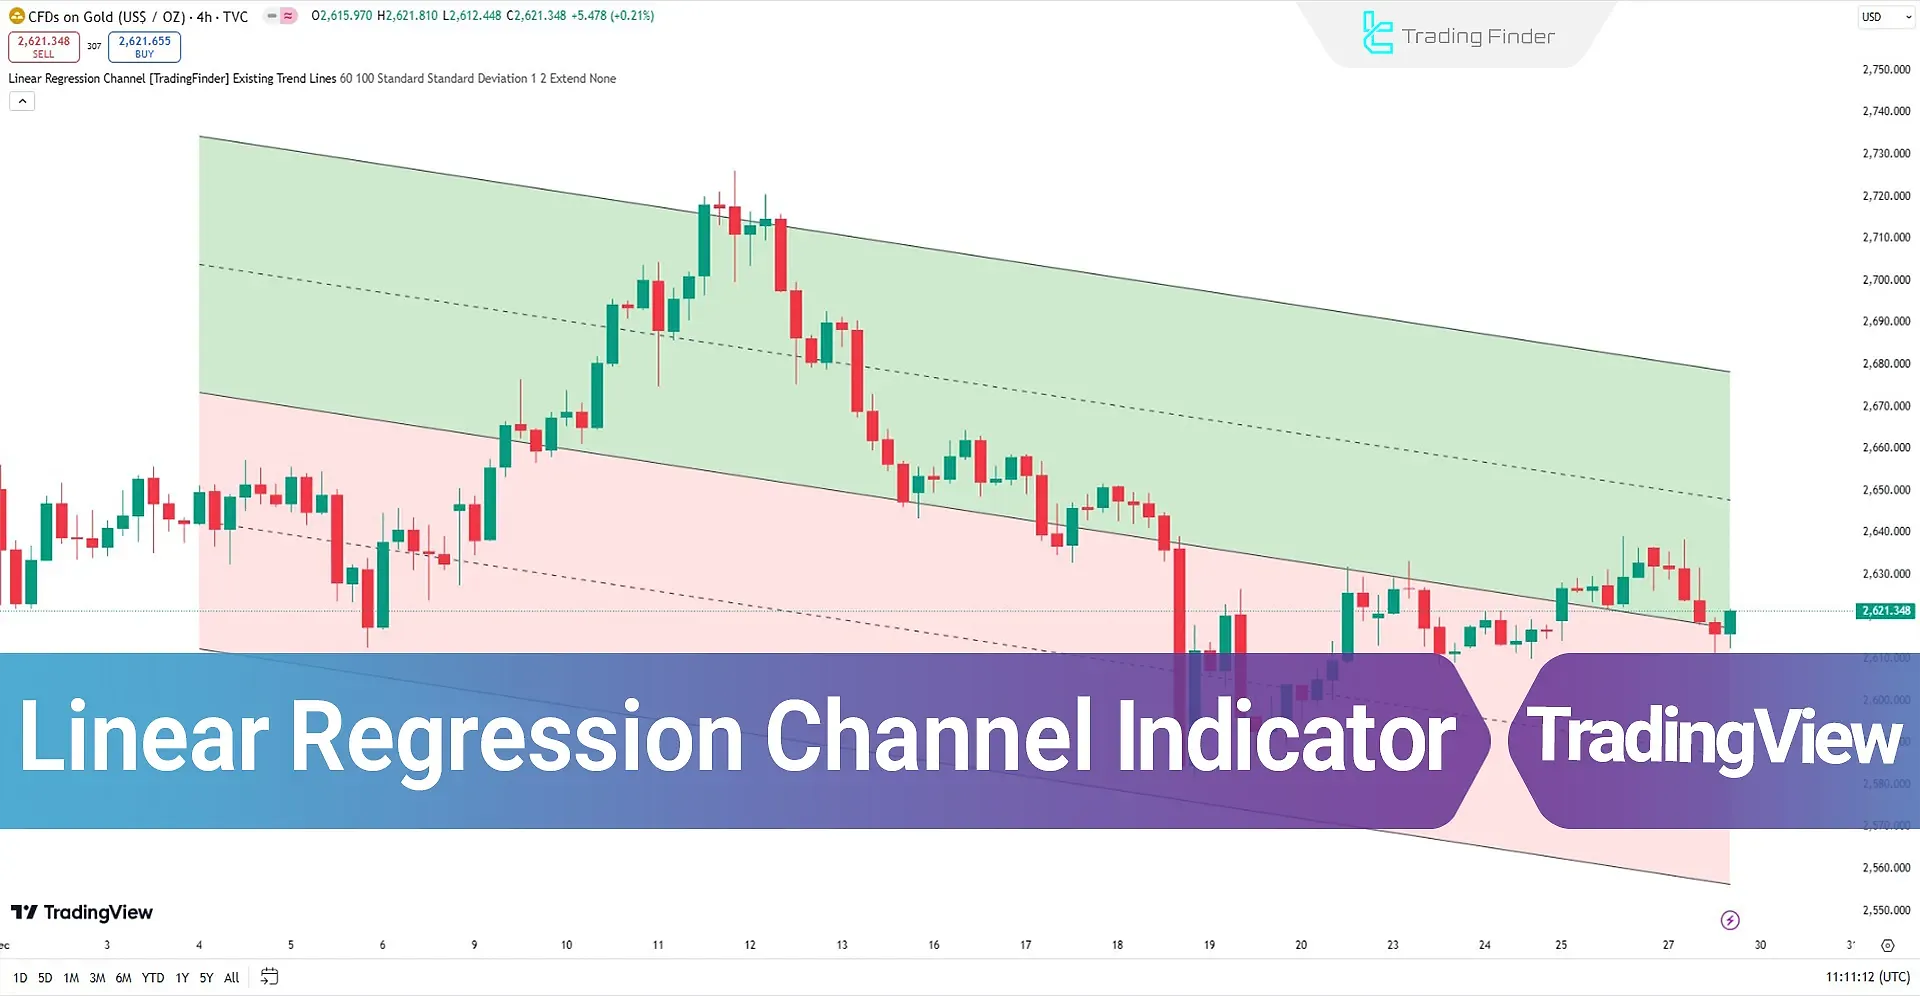
This indicatorconsists of 5 main components:
- Middle Line: Represents the linear regression line, indicating the overall market trend;
- First Support Line: Located below the middle line, acting as the initial support level;
- Second Support Line: Positioned below the first, indicating a stronger support level;
- First Resistance Line: The initial resistance level is located above the middle line;
- Second Resistance Line: Above the first resistance line, representing a stronger resistance level in the market.
Indicator Specifications Table
The table below summarizes the features of this indicator:
Indicator Categories: | Support & Resistance Tradingview Indicators Trading Assist Tradingview Indicators Levels Tradingview Indicators |
Platforms: | Trading View Indicators |
Trading Skills: | Elementary |
Indicator Types: | Reversal Tradingview Indicators |
Timeframe: | Multi-Timeframe Tradingview Indicators |
Trading Style: | Day Trading Tradingview Indicators |
Trading Instruments: | TradingView Indicators in the Forex Market Cryptocurrency Tradingview Indicators Stock Tradingview Indicators Forward Tradingview Indicators Share Stocks Tradingview Indicators Binary Option Tradingview Indicators |
Overview of the Indicator
The Linear Regression Channel is used to identify entry and exit zones, analyze breakouts, and assess price reversion to the mean. The lower channel line supports, while the upper line acts as resistance.
Breakouts of the upper or lower channel lines indicate the strength of buyers or sellers, respectively. Additionally, the Middle Line, behaving similarly to a Moving Average, often provokes price reactions in this area.
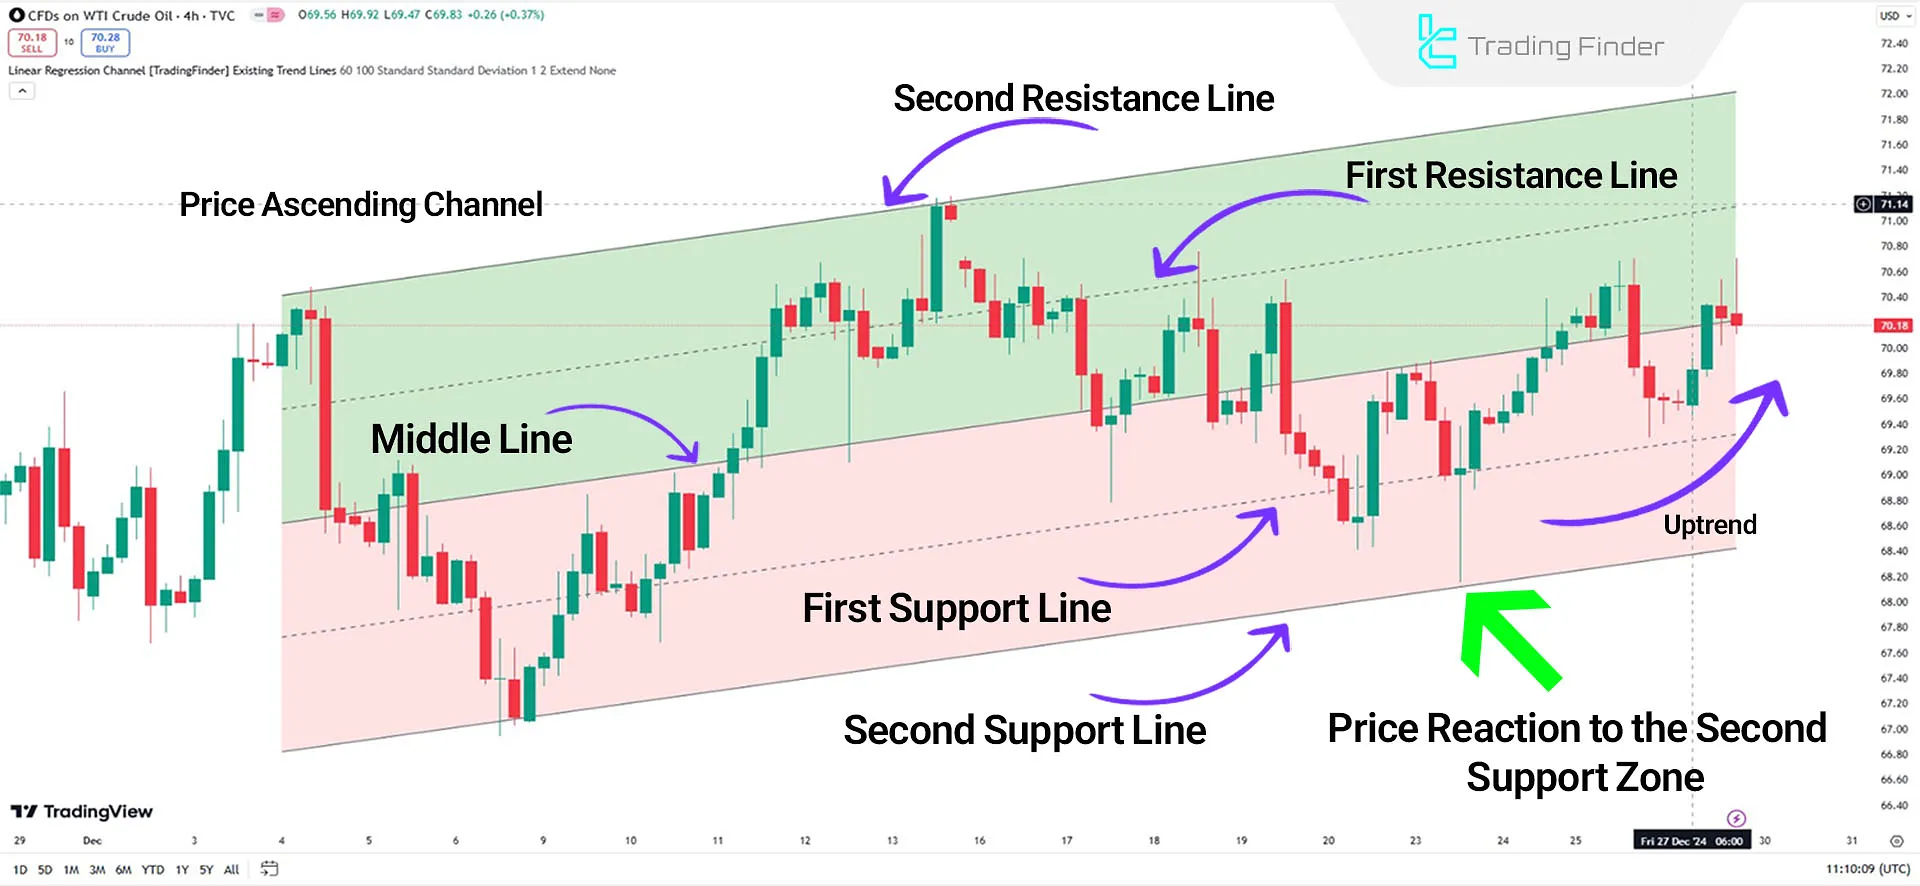
Indicator in Uptrend
In a 4-hour price chart of an oil index, the Middle Line has a positive slope, and prices fluctuate between the middle and resistance lines. Traders initiate buy trades after breaking the middle line and approaching the second support line.
Indicator in Uptrend
In a 4-hour price chart of an oil index, the Middle Line has a positive slope, and prices fluctuate between the middle and resistance lines.
Traders initiate buy trades after breaking the middle line and approaching the second support line.
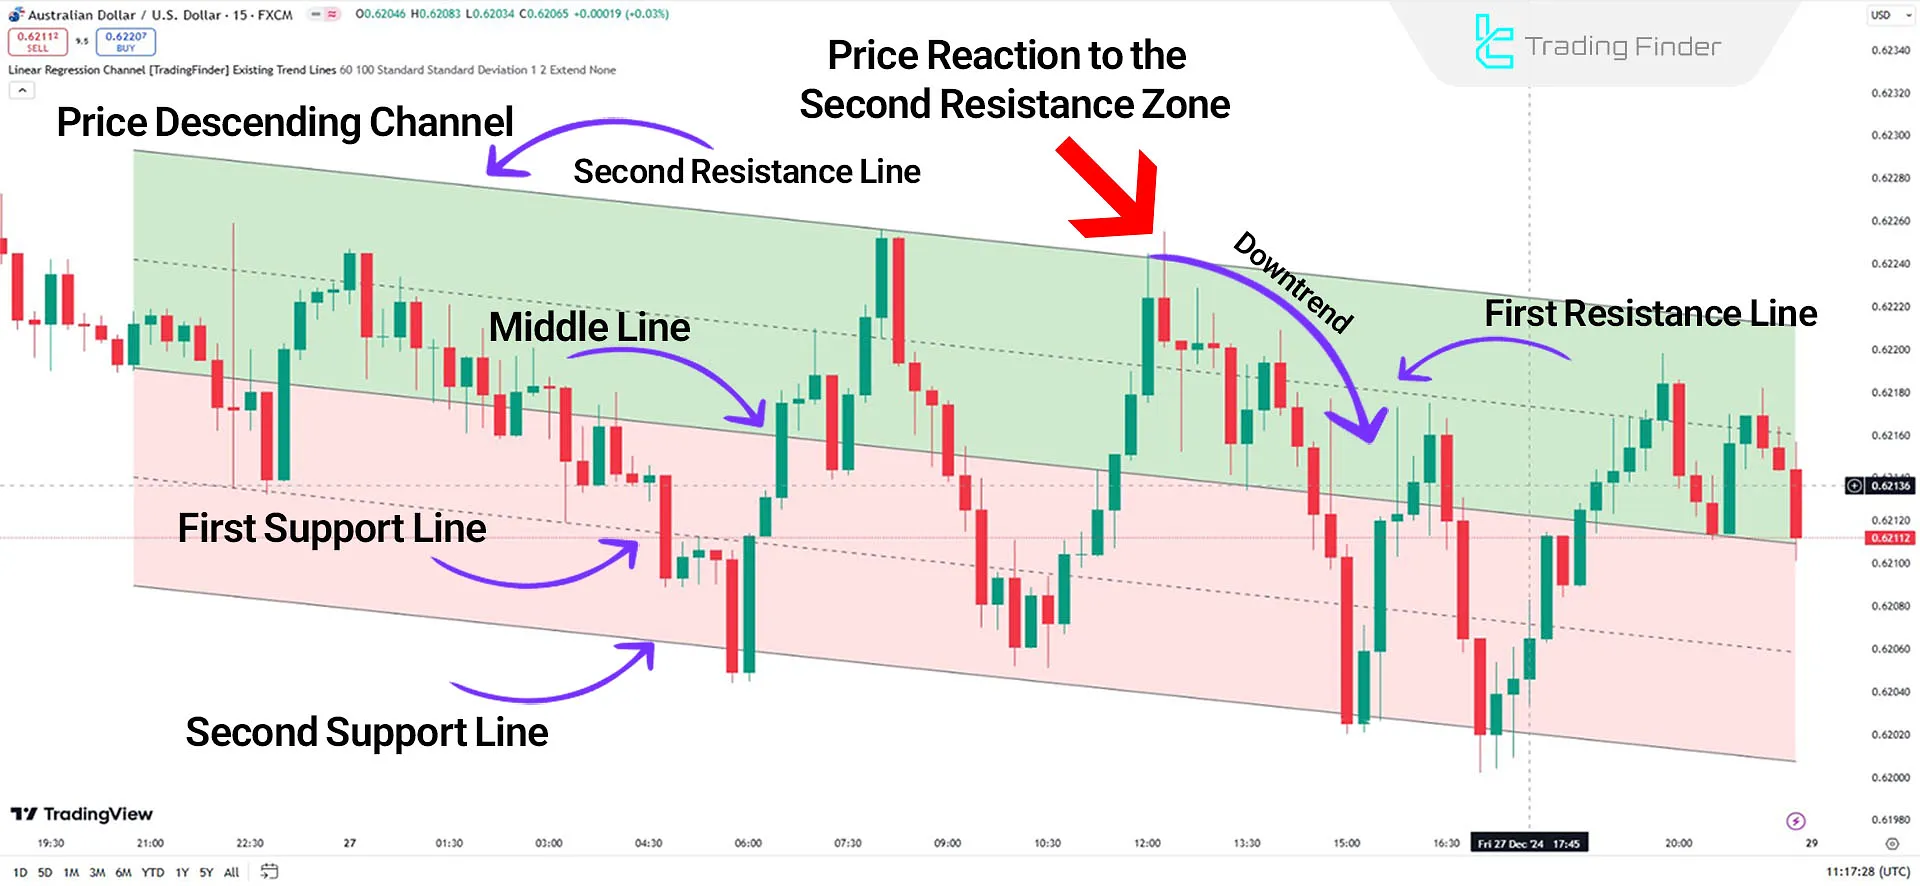
Indicator in Downtrend
In a descending channel of the AUD/USD pair, the Middle Line has a negative slope, and prices oscillate between the resistance and support lines.
Approaching these second resistance lines could act as a reversal zone. Traders can entersell trades after observing Doji Candles and necessary confirmations.
Indicator Settings
The following image illustrates the indicator’s specifications:
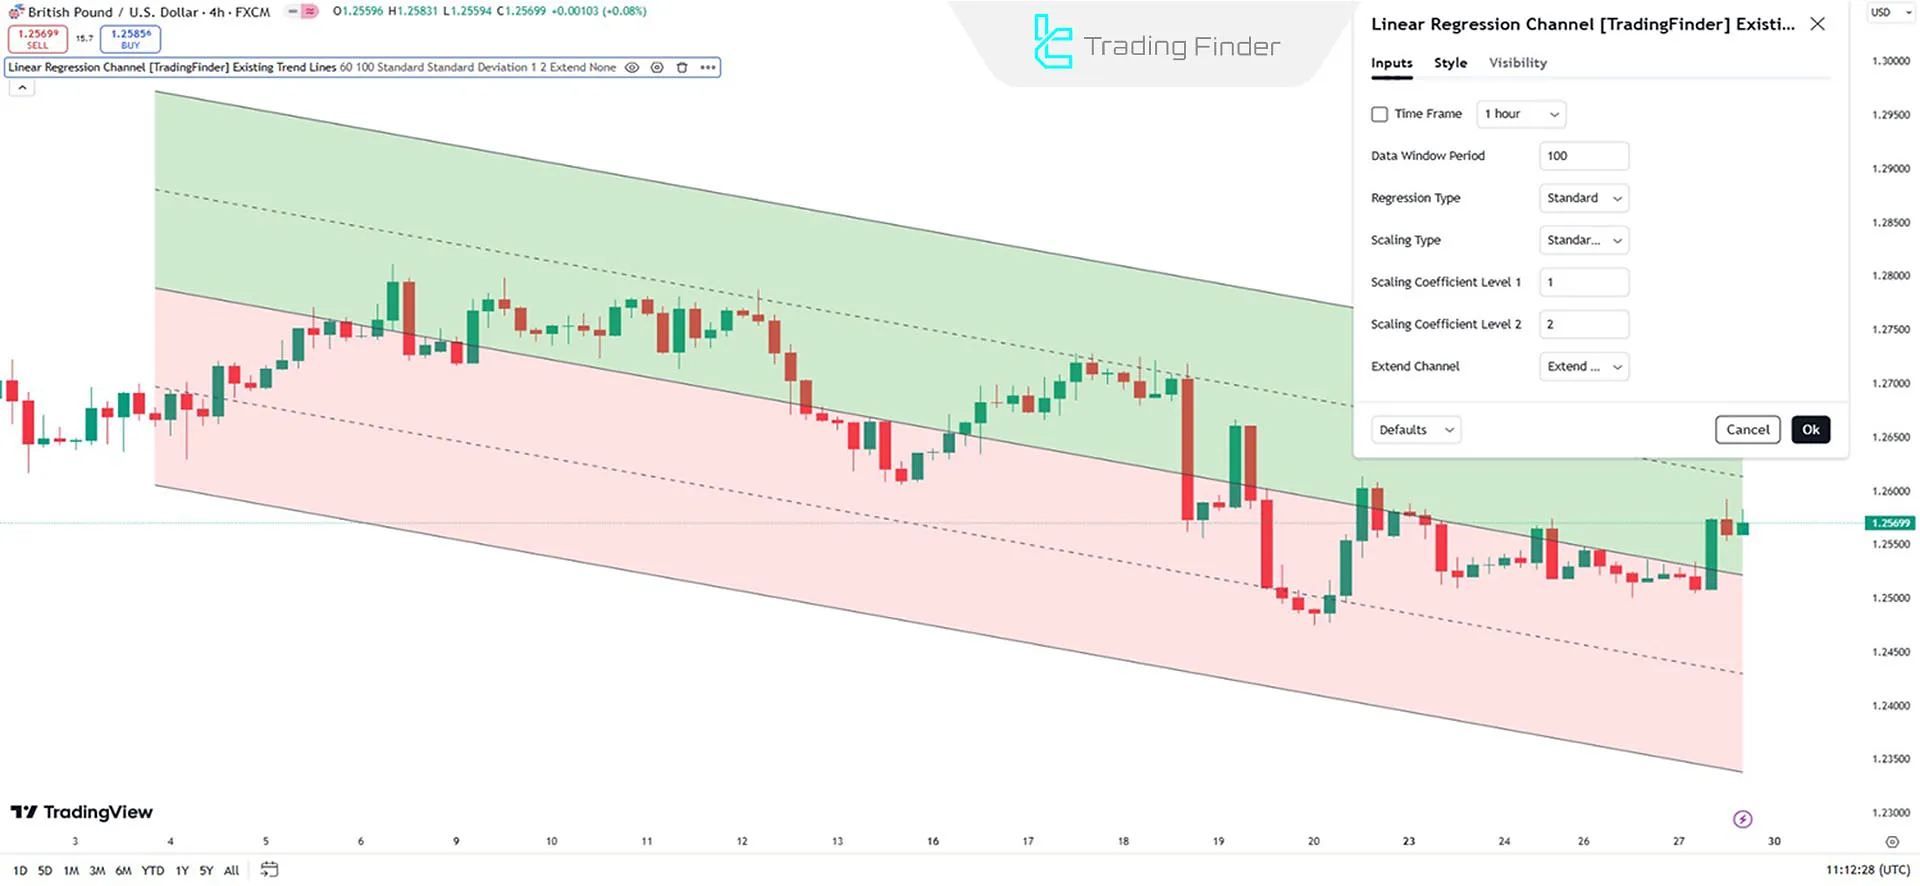
- Time Frame: Setting the timeframe;
- Data Window Period: Number of recent candles used for calculation;
- Regression Type: Choosing the regression type for analysis;
- Scaling Type: Selecting the type of scaling;
- Scaling Coefficient Level 1: Setting the first scaling level;
- Scaling Coefficient Level 2: Adjusting the second scaling level;
- Extend Channel: Extend the channel for future movement predictions.
Conclusion
The Linear Regression Channel is an efficient tool for predicting price behavior in financial markets.
The Support and Resistance Indicator is widely used across different markets, including Forex, Stocks, and Cryptocurrencies.
Traders rely on it for trend analysis, risk management, and identifying Key Price Levels to make well-informed trading decisions.
Linear Regression Channel TradingView PDF
Linear Regression Channel TradingView PDF
Click to download Linear Regression Channel TradingView PDFWhat is the Linear Regression Channel Indicator?
It is a technical analysis tool for identifying trends, support, and resistance levels, and price behavior.
How does this indicator work?
This tool uses a regression line as the middle line and two support and resistance lines to pinpoint key price movement zones.
Hello, Can the development team consider adding the ability to change Level 1 and Level 2 upper and lower line color for the TradingView Linear Regression Channel indicator mentioned in the following page of your website? https://tradingfinder.com/products/indicators/tradingview/linear-regression-channel/ Thank you for your consideration.

Hello,Your feedback has been communicated to the development team.


