TradingView
MetaTrader4
MetaTrader5
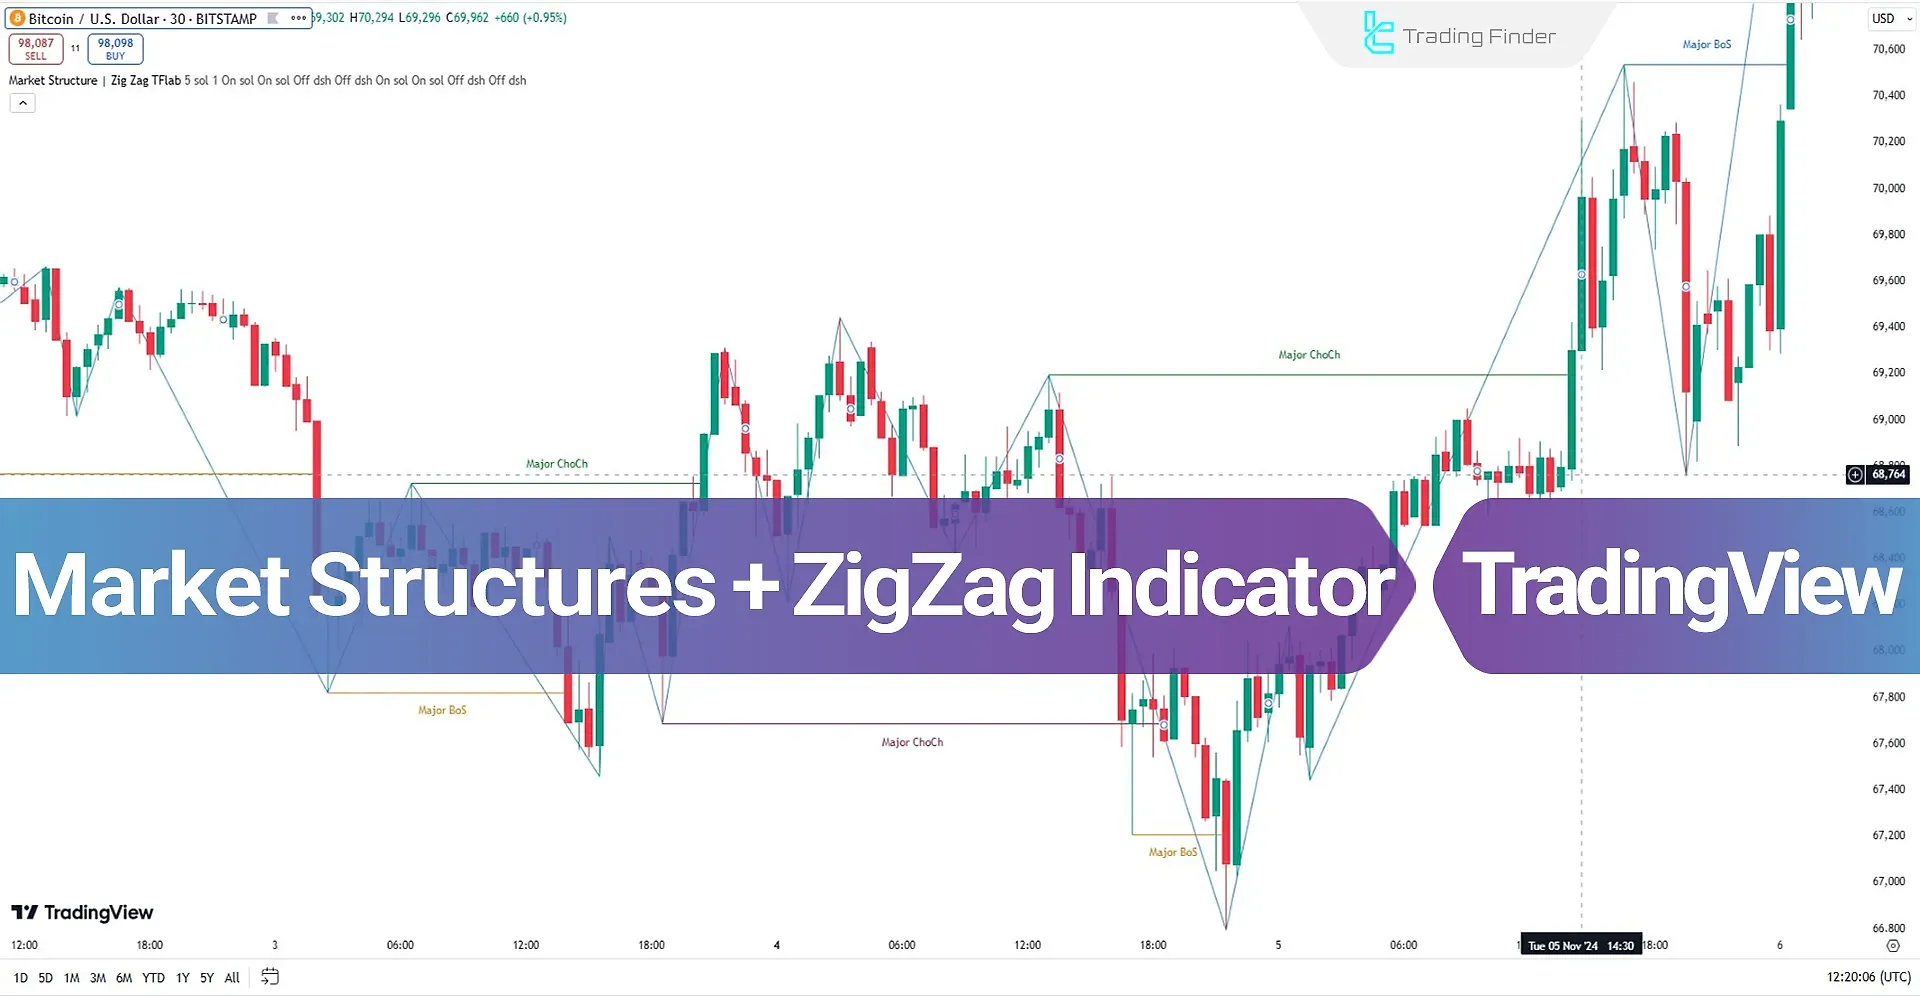
The Market Structures + ZigZag Indicator is an efficient tool for analyzing market structure among TradingView Indicators.

This indicator identifies reversal points and trends by utilizing key concepts such as Market Structure Shift (MSS), Market Structure Break (MSB), Change of Character (CHoCH) and Break of Structure (BoS).
Market Structures + ZigZag Indicator Table
Below is a summary of the indicator's features:
Indicator Categories: | ICT Tradingview Indicators Smart Money Tradingview Indicators Trading Assist Tradingview Indicators Zigzag Indicators for TradingView |
Platforms: | Trading View Indicators |
Trading Skills: | Intermediate |
Indicator Types: | Breakout Tradingview Indicators |
Timeframe: | Multi-Timeframe Tradingview Indicators |
Trading Style: | Day Trading Tradingview Indicators |
Trading Instruments: | TradingView Indicators in the Forex Market Cryptocurrency Tradingview Indicators Forward Tradingview Indicators |
Indicator Overview
The Market Structures + ZigZag Indicator can serve as a complementary tool for identifying trade entry and exit levels.
Confirming BoS and CHoCH in this indicator requires at least one candle to close beyond the previous level.
In this indicator:
- Major bullish CHoCH is displayed in green;
- Major bullish BoS is displayed in blue;
- Major bearish CHoCH is displayed in purple;
- Major bearish BoS is displayed in orange.
Indicator in Uptrend
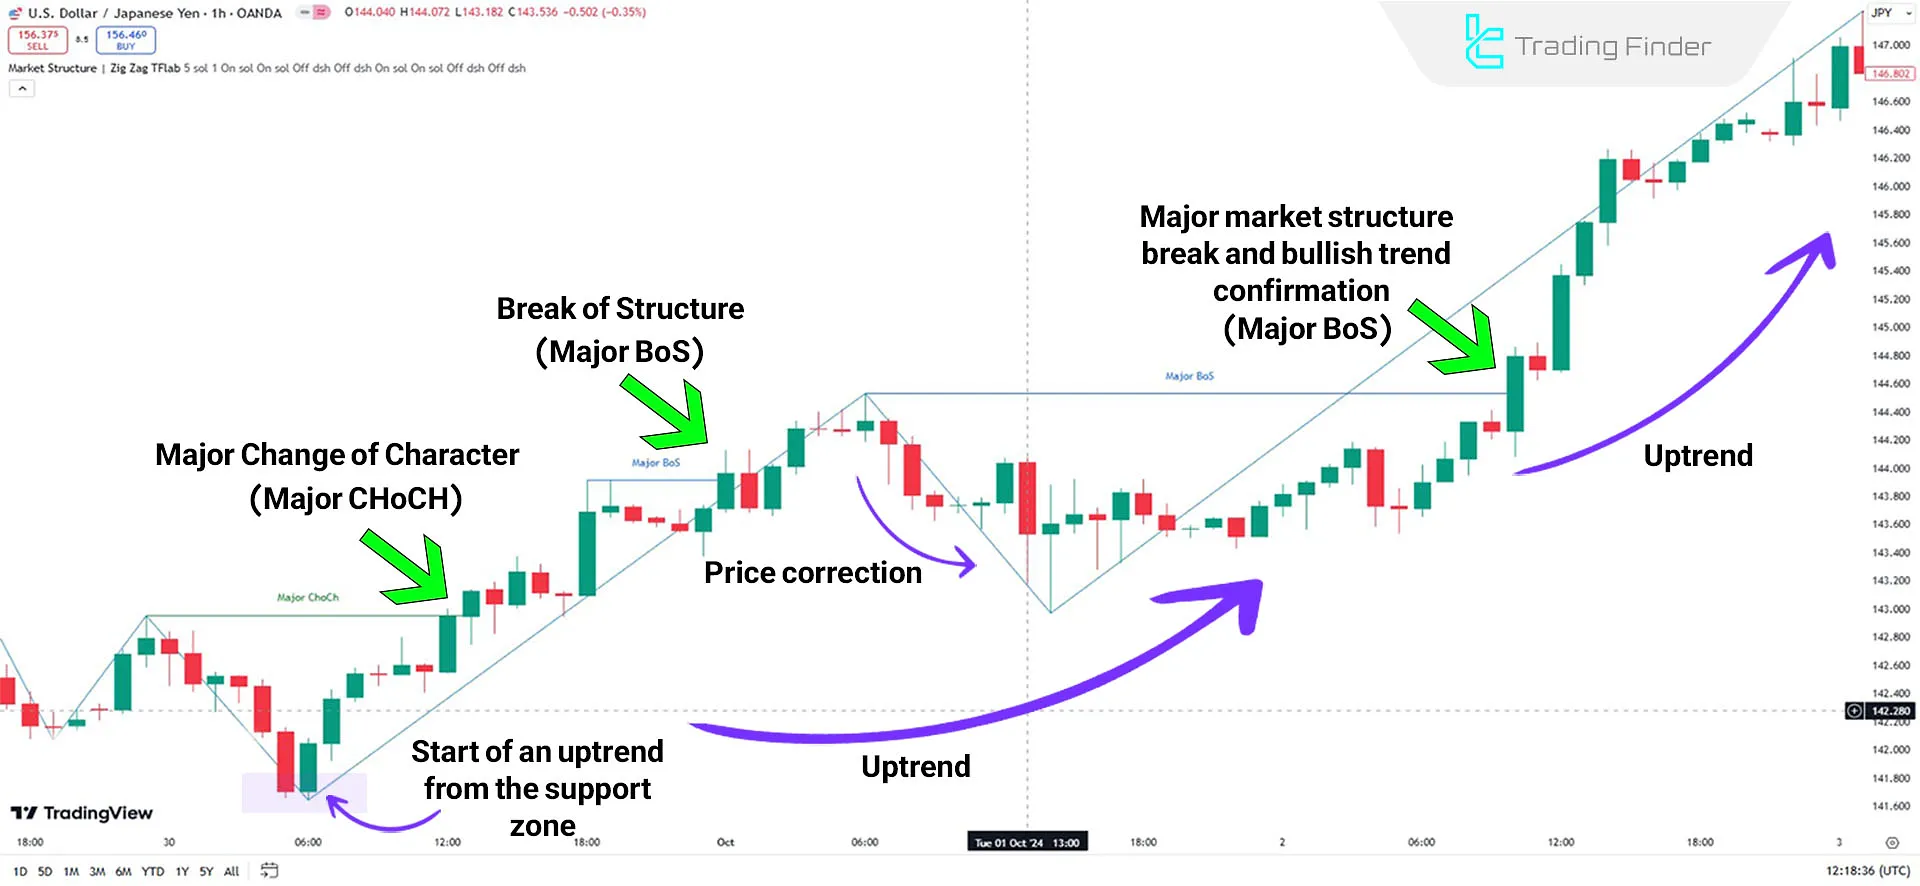
On the USD/JPY currency pair chart, the price shows signs of reversal after hitting a support area and a Change of Character (CHoCH).
As this reversal continues with successive Breaks of Structure (BoS), traders may find opportunities to enter buy trades.

Indicator in Downtrend
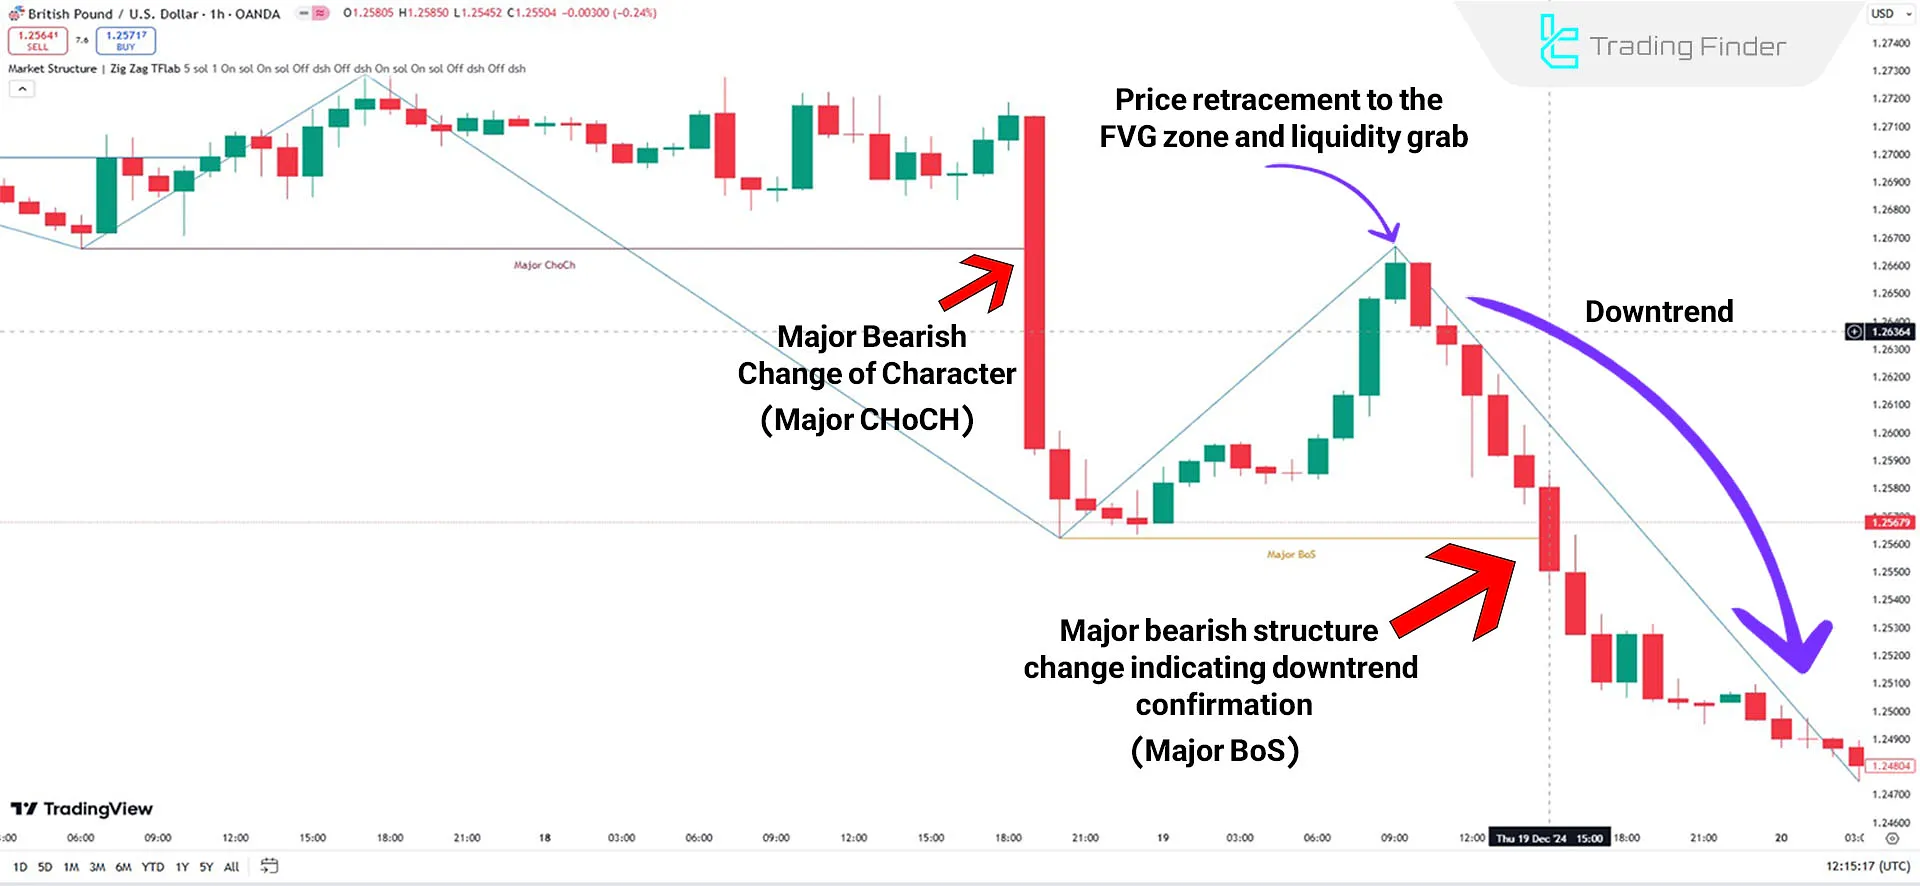
In the downtrend of the GBP/USD chart, after a Change of Character (CHoCH), the price returns to its Fair Value Gap (FVG) to absorb liquidity.
Then, with a Major Break of Structure (BOS), it resumes its downward trend. This behavior represents a clear pattern of liquidity extraction and continuation in the trend direction.

Settings of Market Structures + ZigZag Indicator
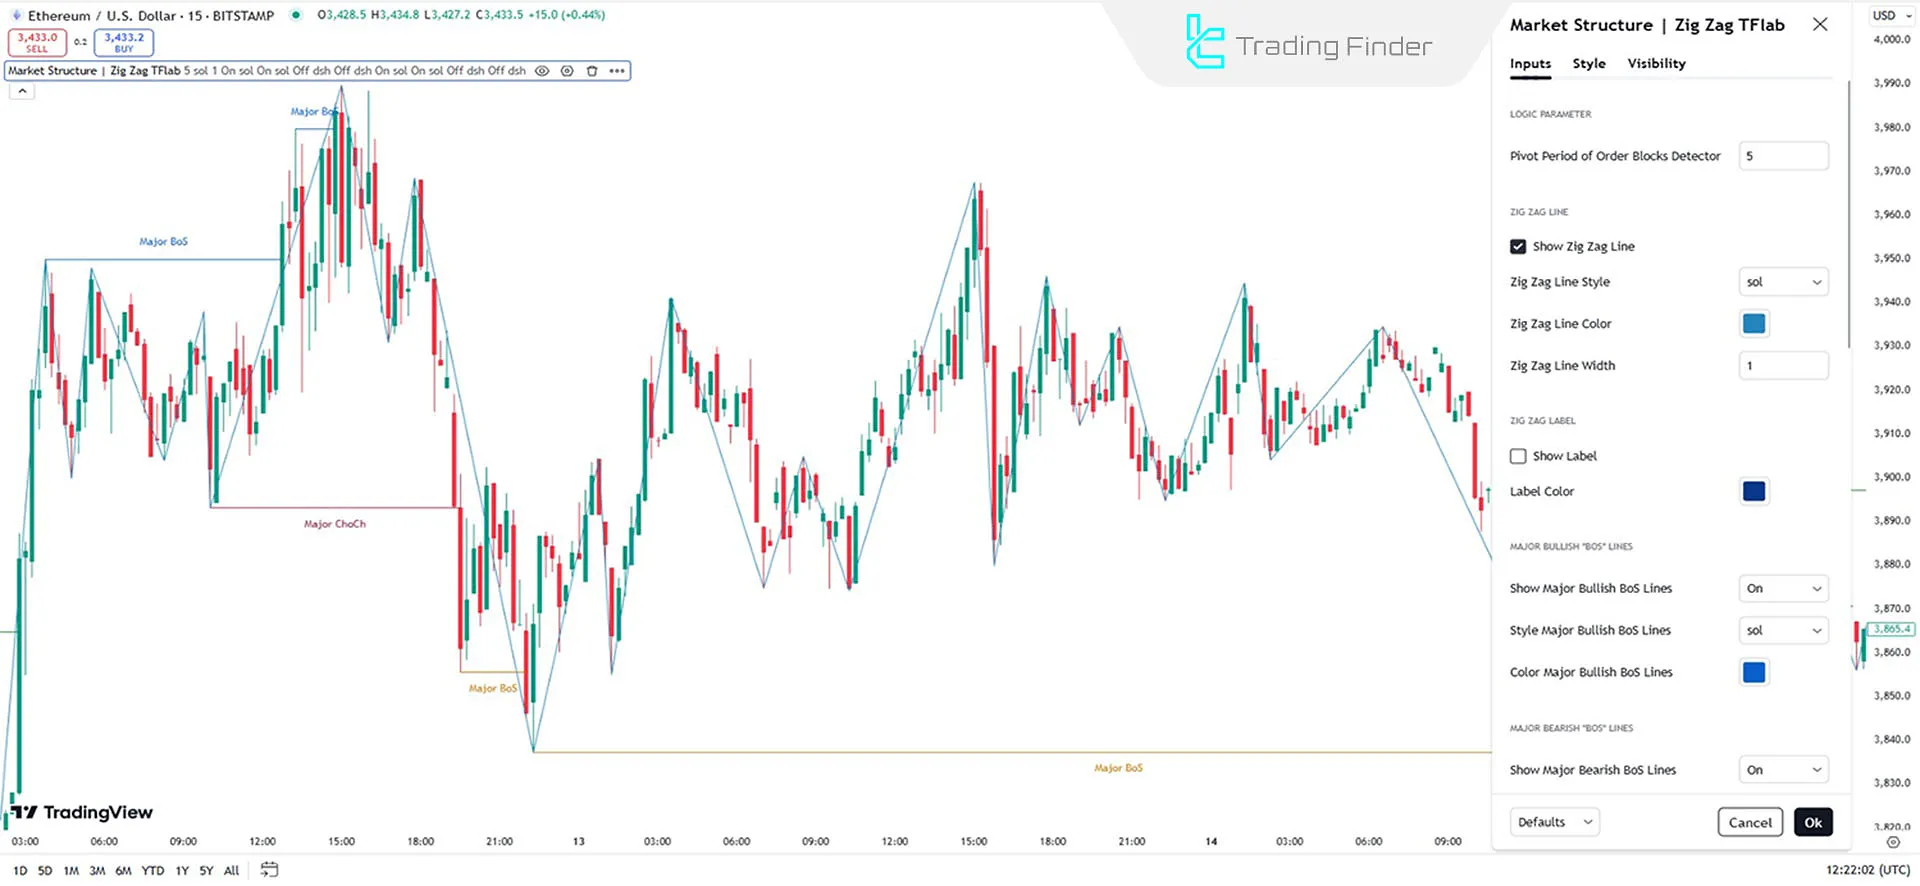
The following image illustrates the indicator's settings on the Ethereum chart. The settings include (Logic Parameter, Zig Zag Line):

Logic Parameter
- Pivot Period of Order Blocks Detector: Pivot period for identifying order blocks, default value is 5.
Zig Zag Line
- Show Zig Zag Line: Enable or disable the display of ZigZag lines on the chart;
- Zig Zag Line Style: Smooth (sol) ZigZag line;
- Zig Zag Line Color: ZigZag line color (default: blue);
- Zig Zag Line Width: Thickness of the ZigZag line (1).
Zig Zag Label
- Show Label: Show or hide ZigZag labels;
- Label Color: Color of ZigZag labels.
Major Bullish BOS Lines
- Show Major Bullish BoS Lines: Display major bullish BoS lines;
- Style Major Bullish BoS Lines: Style of bullish BoS lines (sol);
- Color Major Bullish BoS Lines: Color of blue bullish BoS lines.
Major Bearish BOS Lines
- Show Major Bearish BoS Lines: Display major bearish BoS lines;
- Style Major Bearish BoS Lines: Style of bearish BoS lines (sol);
- Color Major Bearish BoS Lines: Color of orange bearish BoS lines.
Minor Bullish BOS Lines
- Show Minor Bullish BoS Lines: Display minor bullish BoS lines;
- Style Minor Bullish BoS Lines: Style of minor bullish BoS lines (dsh);
- Color Minor Bullish BoS Lines: Color of gray bullish BoS lines.
Minor Bearish BOS Lines
- Show Minor Bearish BoS Lines: Display minor bearish BoS lines;
- Style Minor Bearish BoS Lines: Style of minor bearish BoS lines (dsh);
- Color Minor Bearish BoS Lines: Color of gray bearish BoS lines.
Major Bullish CHoCH Lines
- Show Major Bullish CHoCH Lines: Display major bullish CHoCH lines;
- Style Major Bullish CHoCH Lines: Style of major bullish CHoCH lines (sol);
- Color Major Bullish CHoCH Lines: Color of green major bullish CHoCH lines.
Major Bearish CHoCH Lines
- Show Major Bearish CHoCH Lines: Display major bearish CHoCH lines;
- Style Major Bearish CHoCH Lines: Style of major bearish CHoCH lines (sol);
- Color Major Bearish CHoCH Lines: Color of red major bearish CHoCH lines.
Minor Bullish CHoCH Lines
- Show Minor Bullish CHoCH Lines: Display minor bullish CHoCH lines;
- Style Minor Bullish CHoCH Lines: Style of minor bullish CHoCH lines (dsh);
- Color Minor Bullish CHoCH Lines: Color of gray minor bullish CHoCH lines.
Minor Bearish CHoCH Line
- Show Minor Bearish CHoCH Lines: Display minor bearish CHoCH lines;
- Style Minor Bearish CHoCH Lines: Style of minor bearish CHoCH lines (dsh);
- Color Minor Bearish CHoCH Lines: Color of gray minor bearish CHoCH lines.
Conclusion
The Market Structures + ZigZag Indicator is designed to identify critical market trend changes. Combining concepts such as CHoCH, BoS, and ZigZag lines, it is a robust tool for analyzing market trends and key price movement shifts.
Market Structures ZigZag TradingView PDF
Market Structures ZigZag TradingView PDF
Click to download Market Structures ZigZag TradingView PDFWhat is the Market Structures + ZigZag Indicator?
This indicator is designed to identify trends and price reversals by combining concepts like Break of Structure (BoS), Change of Character (CHoCH), and ZigZag lines.
How can I customize the indicator settings?
In the indicator settings section on TradingView, you can personalize line styles, colors, thicknesses, and toggle the display of elements on or off.
hi good day [TFLab] what is the best setting for pivot period of order block detection for Market Structures + ZigZag indcator or which better 3, 5, or 9
Hello, the best pivot period depends on the market conditions, the traded symbols, and the chosen time frame. There isn’t a single exact setting.


