


The ICT Power Of 3 Indicator is built on the principles of the ICT strategy to identify the key phases of the market.
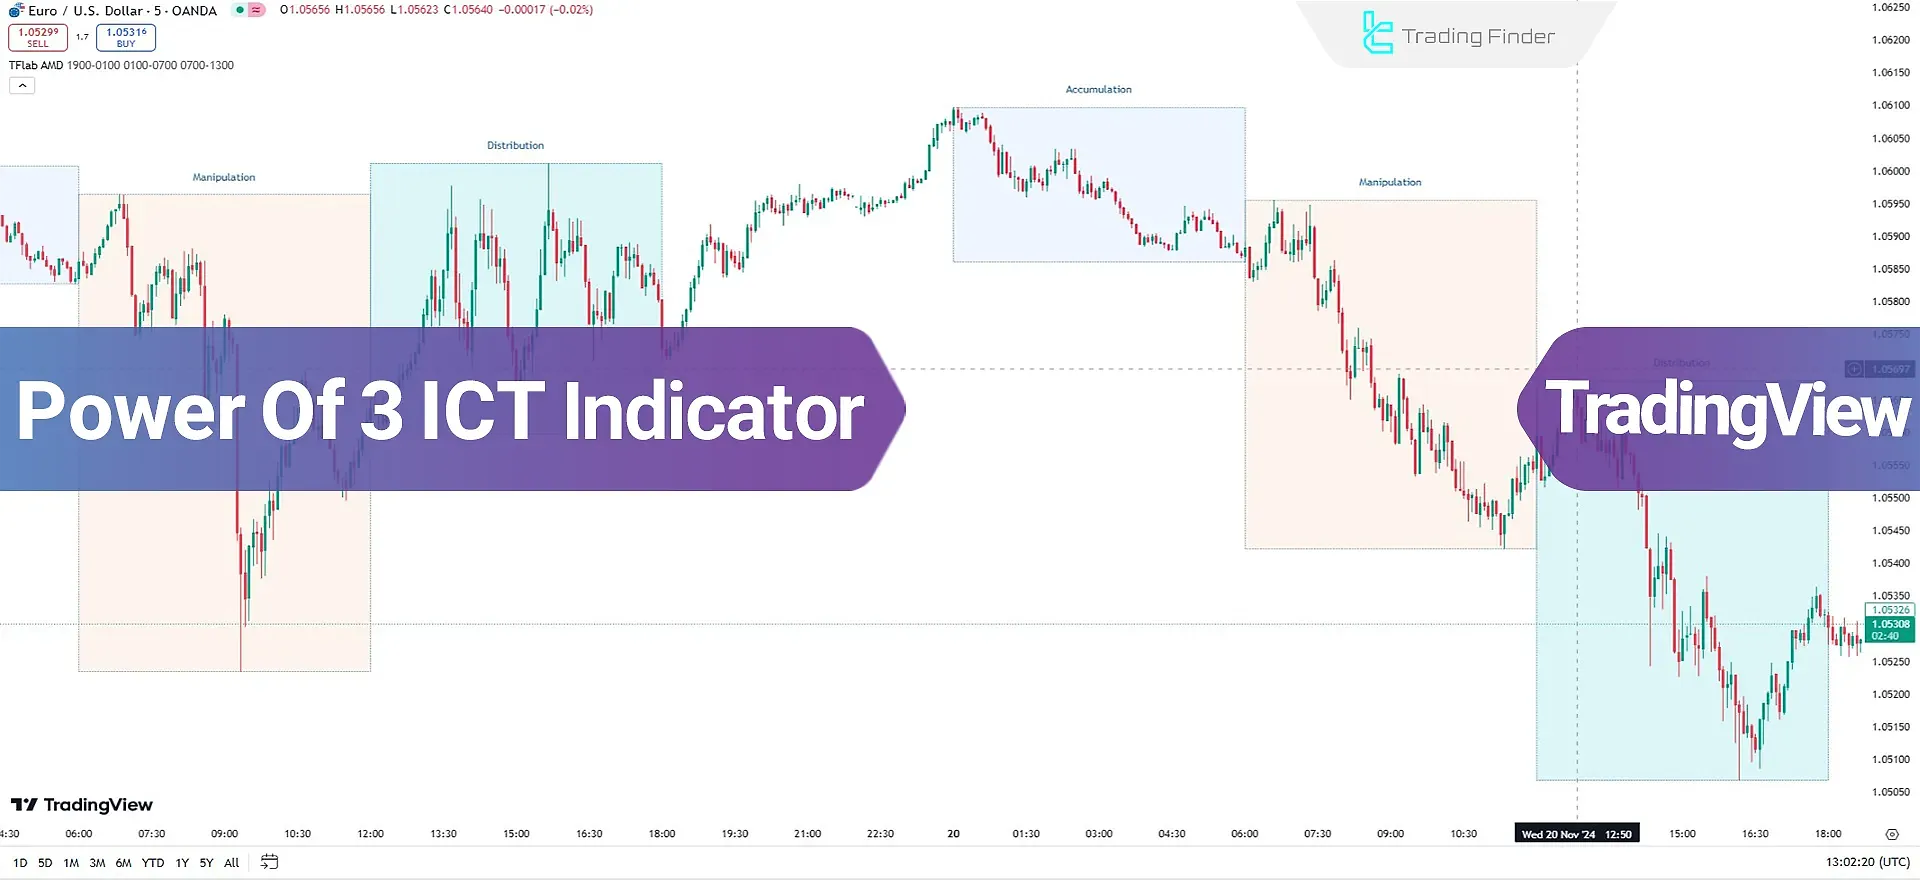
This indicator focuses on institutional behavior and liquidity sweep, highlighting critical price levels such as peaks and troughs within specific timeframes, enabling traders to detect market changes effectively.
ICT Power Of 3 Indicator Specifications
The details of this indicator are summarized in the table below:
Indicator Categories: | ICT Tradingview Indicators Smart Money Tradingview Indicators Liquidity Tradingview Indicators |
Platforms: | Trading View Indicators |
Trading Skills: | Advanced |
Indicator Types: | Leading Tradingview Indicators |
Timeframe: | M1-M5 Time Tradingview Indicators M30-M15 Time Tradingview Indicators H4-H1 Time Tradingview Indicators |
Trading Style: | Fast Scalper Tradingview Indicators Scalper Tradingview Indicators |
Trading Instruments: | TradingView Indicators in the Forex Market Cryptocurrency Tradingview Indicators |
Overview of the Indicator
Each of these phases represents specific market movements influenced by institutional traders' strategies and decisions. This strategy divides the market into three distinct phases:
- Accumulation: From19:00 to 01:00, market makers collect orders quietly within horizontal ranges without drawing attention;
- Manipulation: From01:00 to 07:00, the market experiences movements such as false breakouts and liquidity traps designed to deceive retail traders;
- Distribution: From07:00 to 13:00, institutions offload their positions, and the market transitions into fast and strong movements.
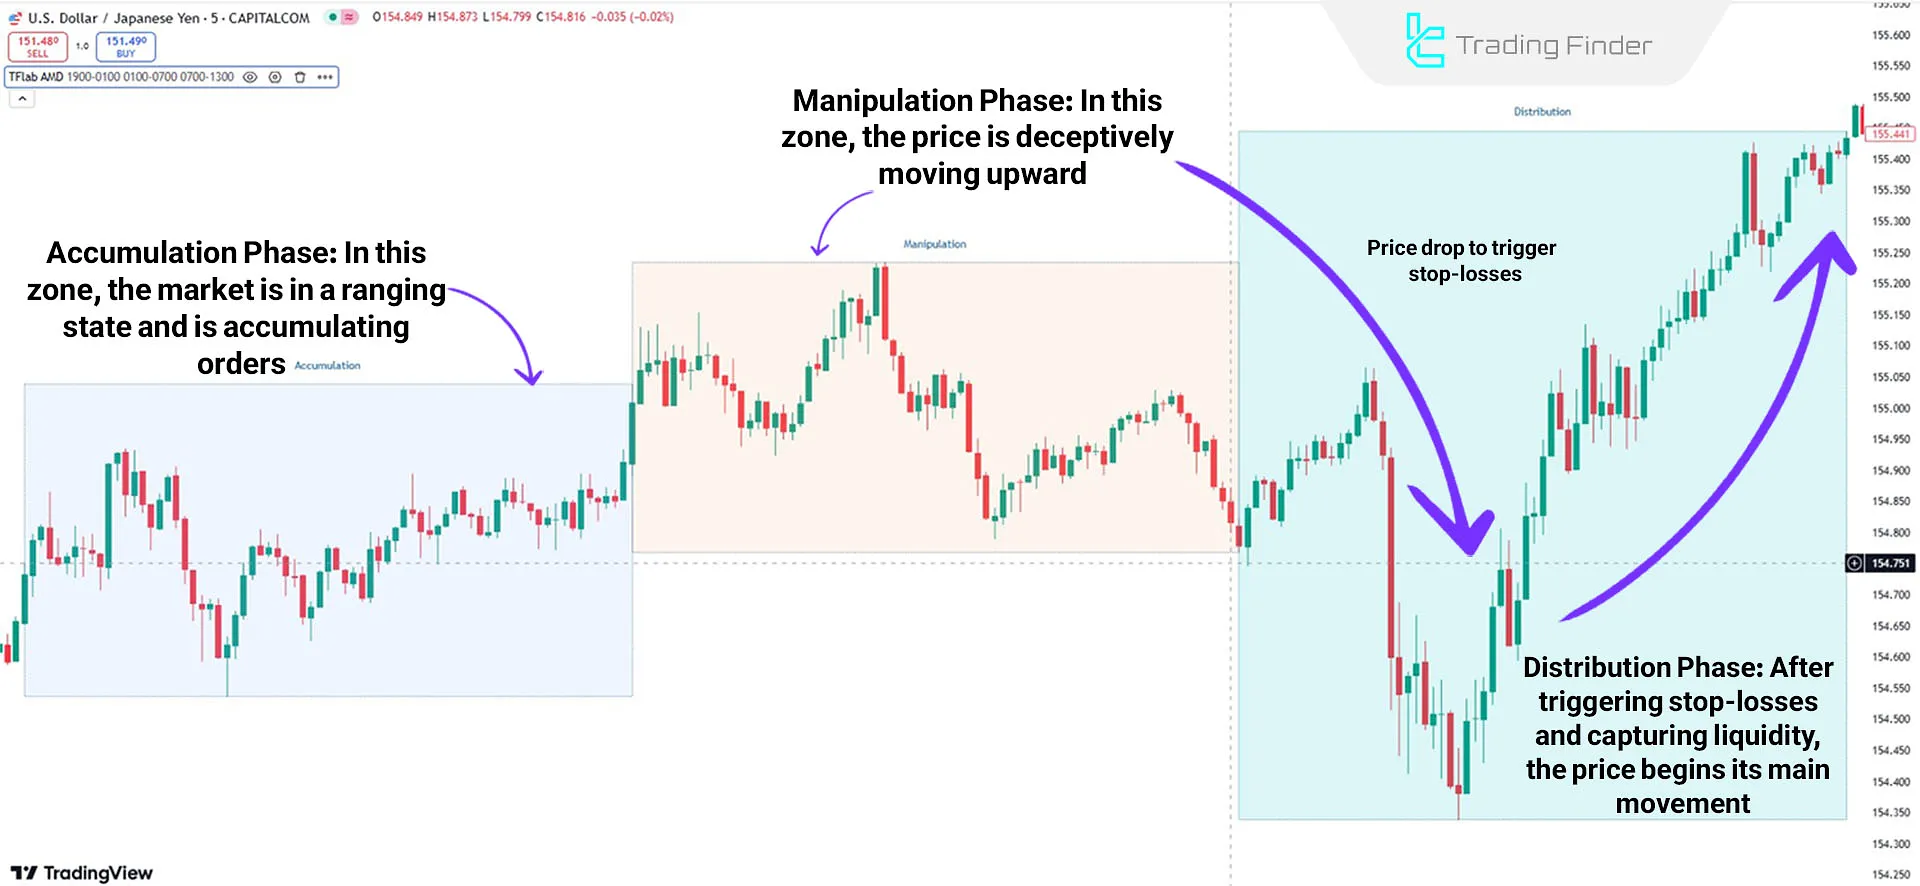
Indicator in an Uptrend
The analyzed chart represents the USD/JPY currency pair on a 5-minute timeframe. During the Accumulation Phase, the price activates buy orders within a range, setting the stage for the next move.
In the Manipulation Phase, the price deceptively trends upward, misleading retail traders into making incorrect decisions.
Upon reaching the Distribution Phase, market makers trigger stop-losses and collect liquidity from traders before the price resumes its primary upward trend, initiating the main market movement.
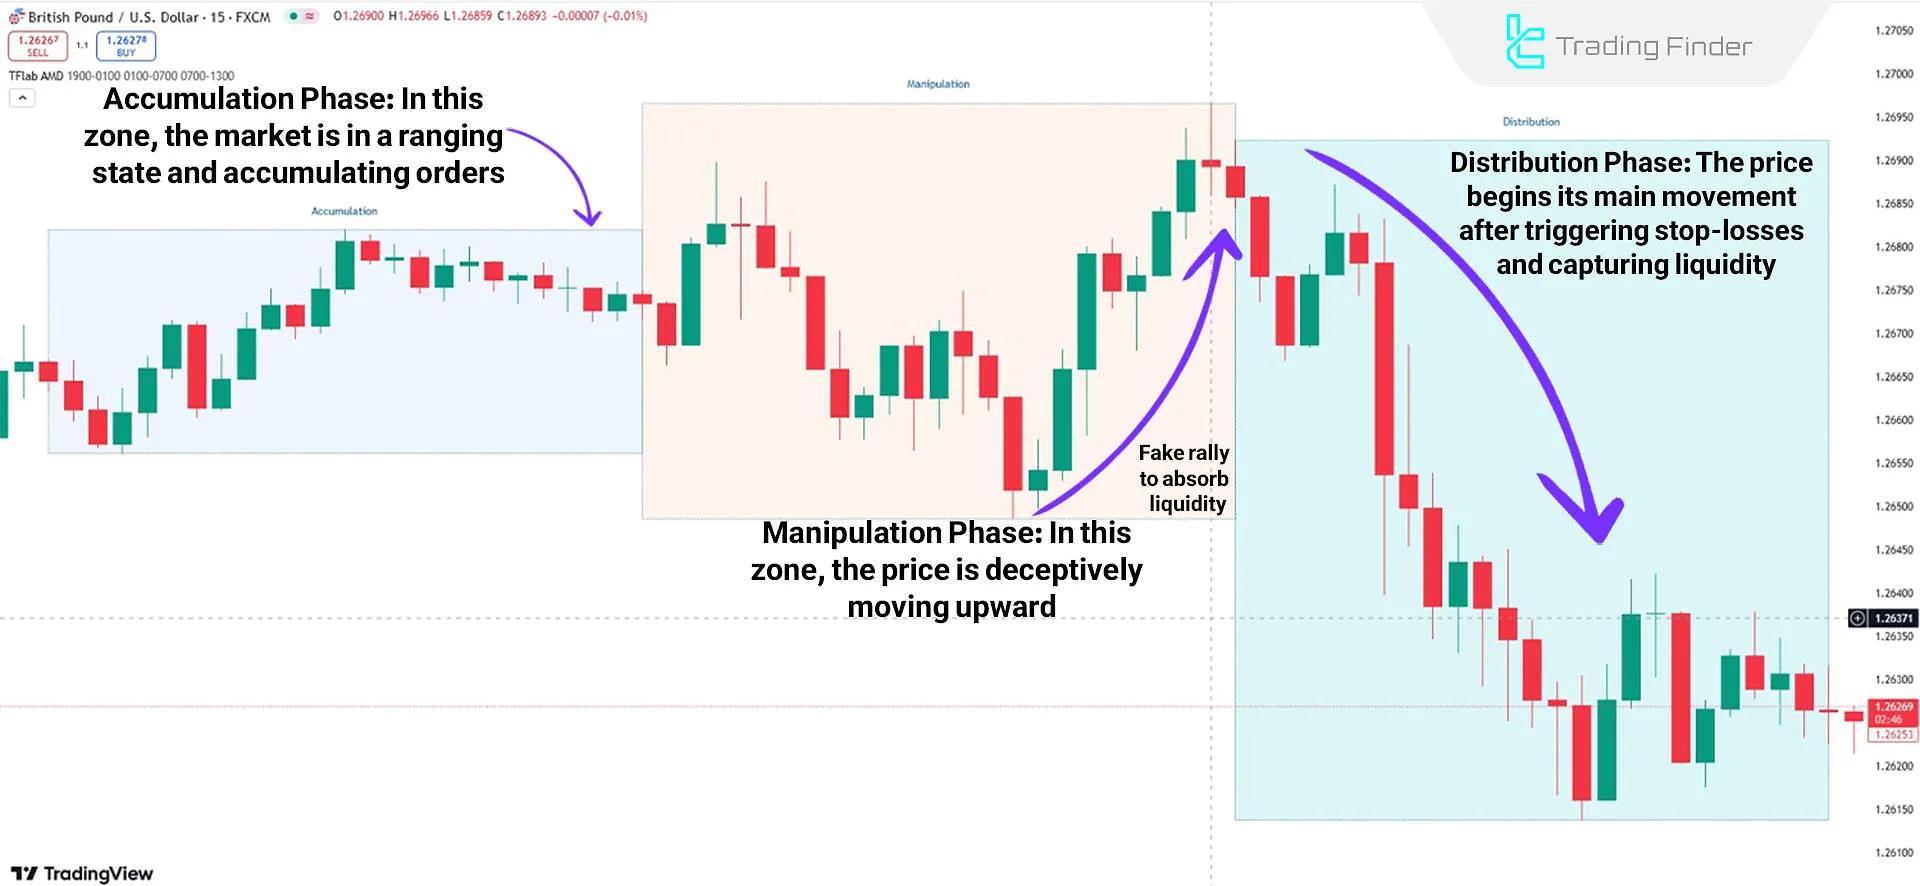
Indicator in a Downtrend
The chart below illustrates the GBP/USD currency pair on a 1-hour timeframe. Initially, during the Accumulation Phase, the price moves within a defined range without showing any clear trend.
In the Manipulation Phase, institutional traders create false breakouts and deceptive moves to entice retail traders into entering an upward trend.
After gathering liquidity and triggering stop-losses, the price abruptly transitions into a downtrend, initiating the primary market movement.
ICT Power Of 3 Indicator Settings
The settings of the Triple Accumulation Strength Indicator can be seen in the image below:
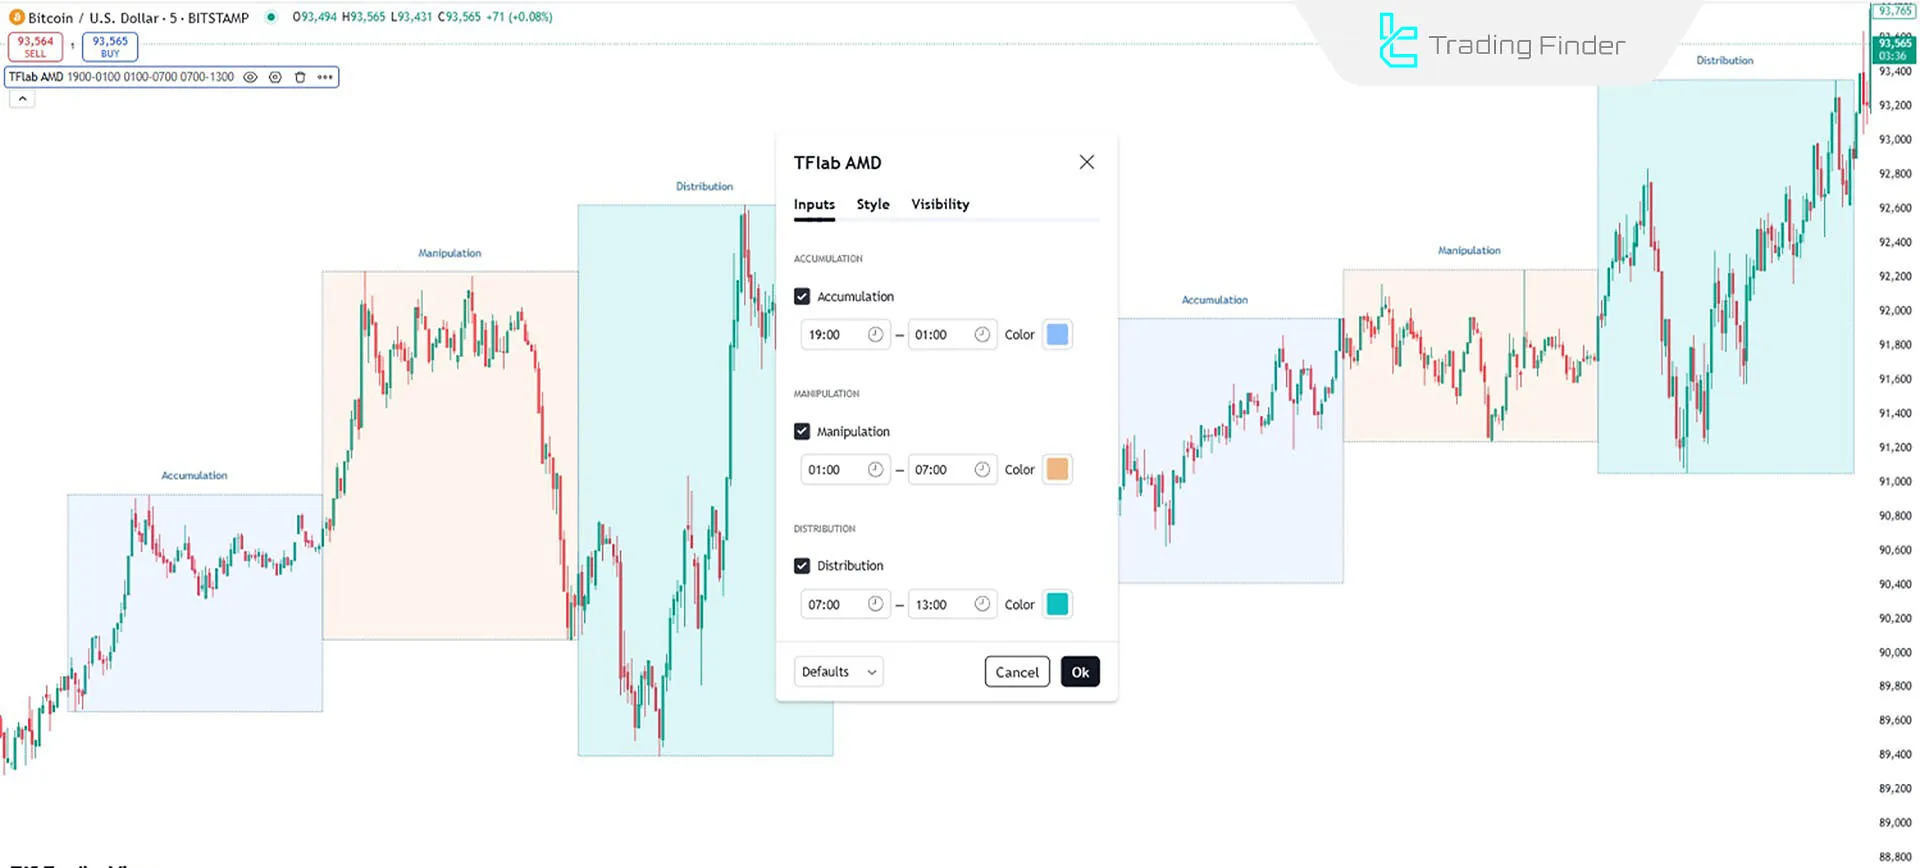
- Accumulation: Accumulation Phase from 19:00 to 01:00 (Blue Zone);
- Manipulation: Manipulation Phase from 01:00 to 07:00 (Red Zone);
- Distribution: Distribution Phase from 07:00 to 13:00 (Green Zone).
Conclusion
The ICT Power Of 3 Indicator is a valuable tool for traders seeking to understand market structure based on time and price dynamics.
By highlighting the three critical market phases-Accumulation, Manipulation, and Distribution it simplifies the complex strategies of market makers.
Power Of 3 ICT TradingView PDF
Power Of 3 ICT TradingView PDF
Click to download Power Of 3 ICT TradingView PDFWhat is the ICT Power Of 3 Indicator?
The ICT Power Of 3 Indicator is a useful tool for identifying the market's Accumulation, Manipulation, and Distribution phases.
Is this indicator suitable for all trading levels?
Yes, the ICT Power Of 3 Indicator is suitable for traders at all experience levels.
hi there any chance of introducing buffers into this indi please ? ie top left, top right, bottom right, bottom left.. That way we can re-use the indicator for trade execution ( or at least test it ) thanks t


