


TradingView
MetaTrader4
MetaTrader5
The Quarterly Theory ICT 05 Indicator is designed to identify institutional movements, hidden liquidity zones, and trading opportunities.
This tool is built on a unique blend of Quarterly ICT style theory, Smart Money concepts, and time-based market structure analysis.
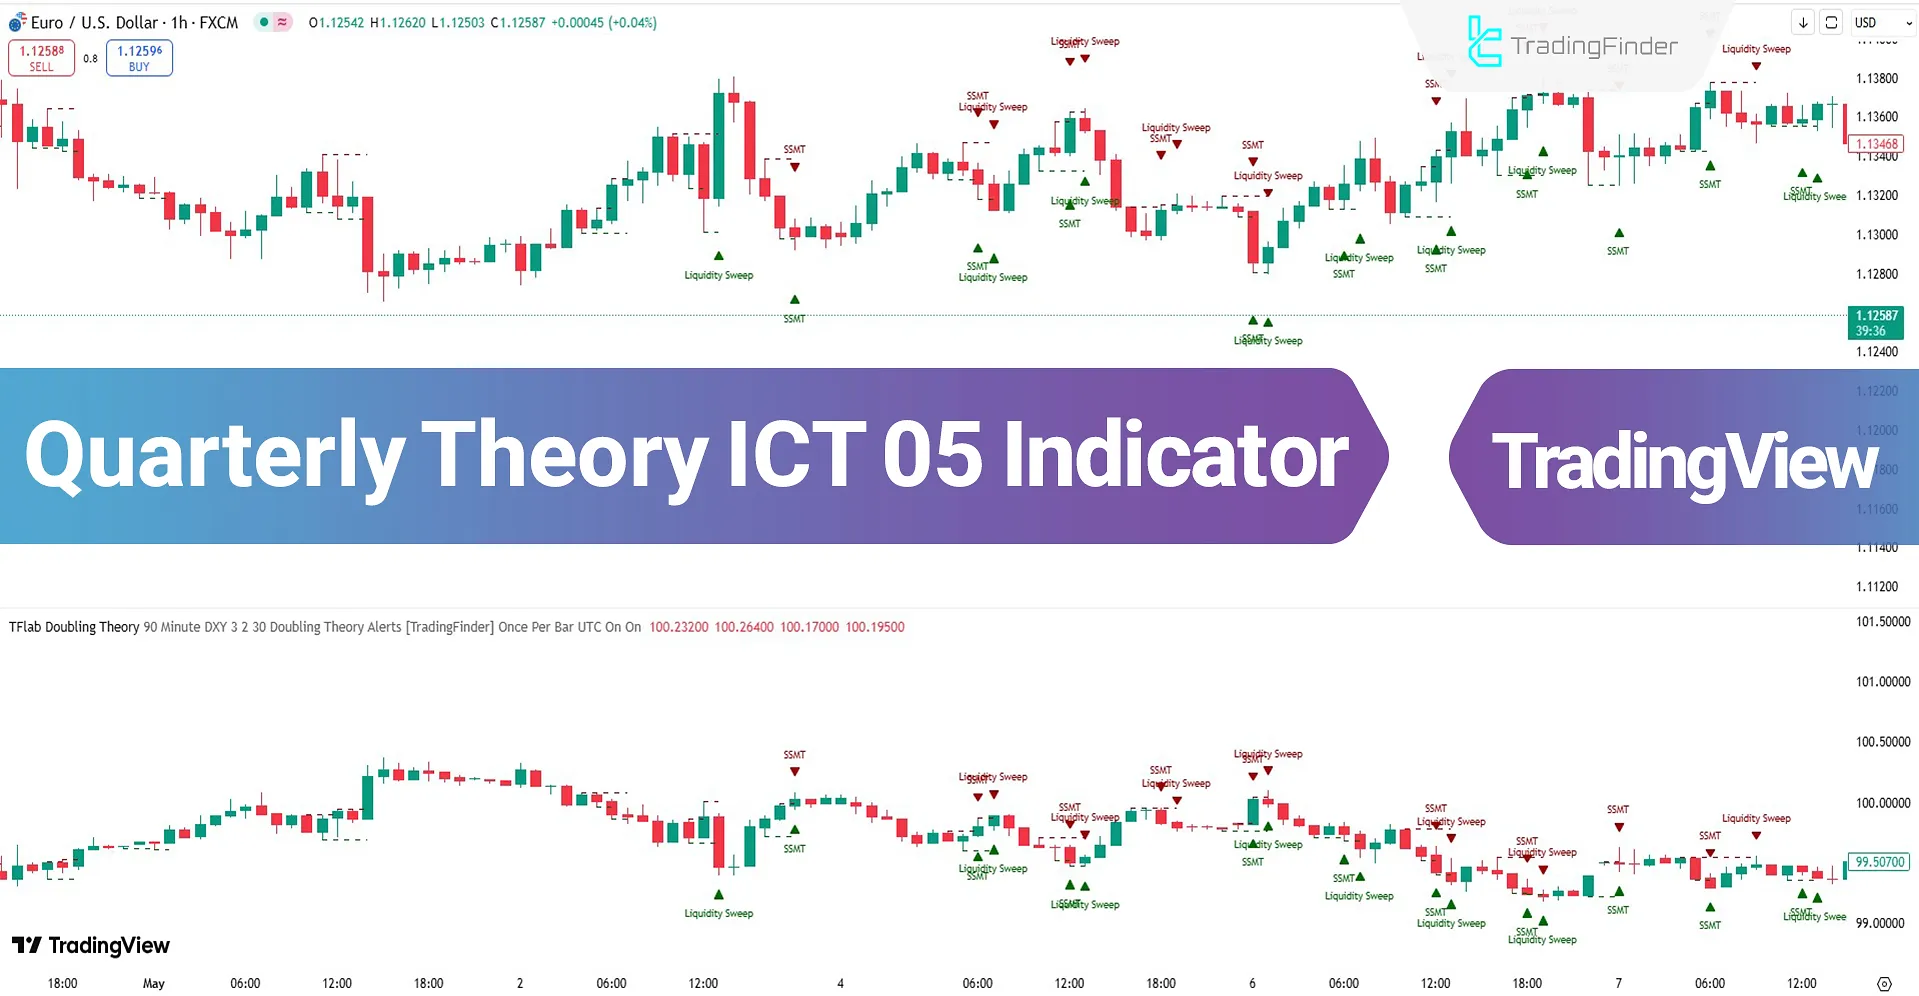
It is considered an advanced tool in the technical analysis of financial markets.
Quarterly Theory ICT 05 Indicator Specifications
The technical specifications of the Quarterly Theory ICT 05 Indicator are listed in the table below.
Indicator Categories: | ICT Tradingview Indicators Smart Money Tradingview Indicators Liquidity Tradingview Indicators |
Platforms: | Trading View Indicators |
Trading Skills: | Advanced |
Indicator Types: | Reversal Tradingview Indicators |
Timeframe: | Multi-Timeframe Tradingview Indicators |
Trading Style: | Day Trading Tradingview Indicators Scalper Tradingview Indicators Swing Trading Tradingview Indicators |
Trading Instruments: | TradingView Indicators in the Forex Market Cryptocurrency Tradingview Indicators Stock Tradingview Indicators |
Quarterly Theory 05 at a Glance
The Quarterly Theory ICT 05 Indicator, based on Doubling Theory Signals and focused on Smart Money behavior, divides market structure into two time based phases to identify institutional entry and exit points.
The two main phases of the indicator are:
- Doubling 1: The phase where SSMT (Smart Money Structural Divergence) forms
- Doubling 2: The phase where the price returns to liquidity zones and performs aLiquidity Sweep
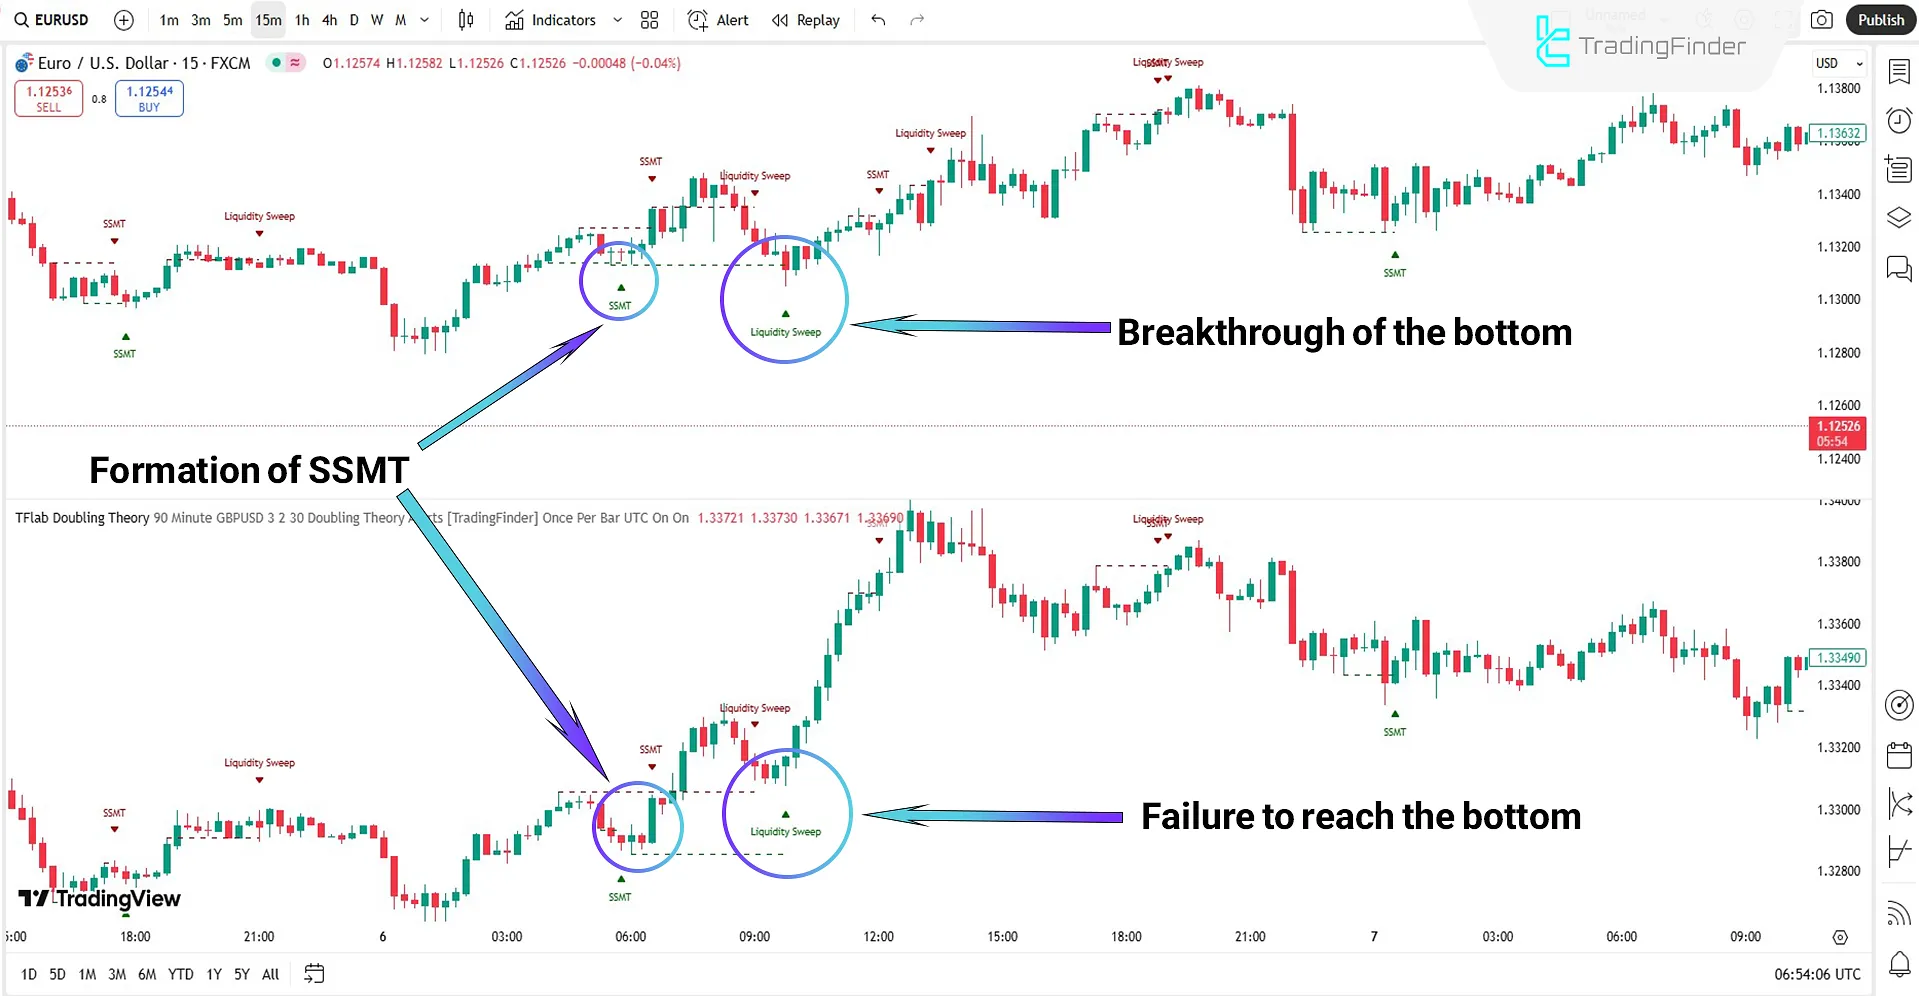
Bullish Trend Analysis
In Phase 1, an SSMT divergence forms between EUR/USD and GBP/USD; while EUR breaks below the low, GBP maintains its structure indicating weakening bearish pressure.
In Phase 2, EUR performs a liquidity sweep at the low, but GBP fails to confirm this move. With the formation of an SMT divergence and a rapid price jump, the bullish trend is confirmed.
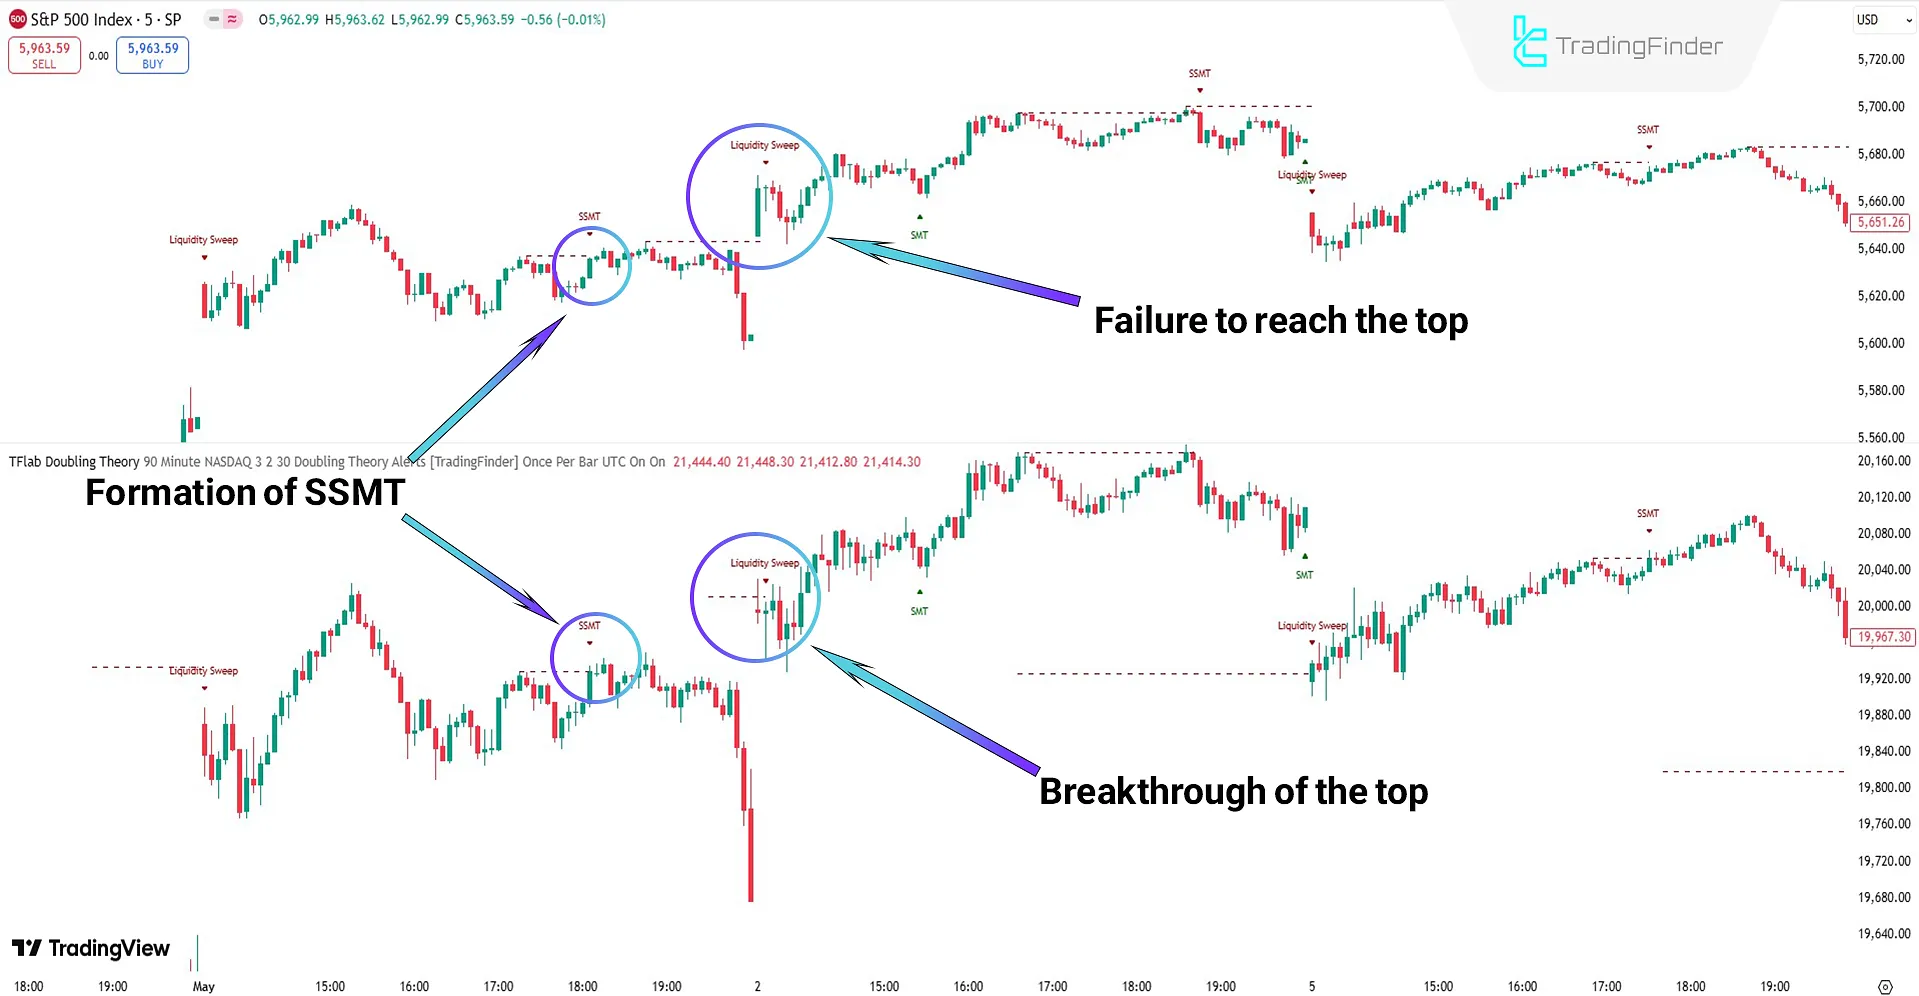
Bearish Trend Analysis
In Phase 1, an SSMT divergence forms between the NASDAQ and S&P 500; the NASDAQ breaks above the high, but the S&P fails to reach it. This suggests weakening buying power and the start of distribution by Smart Money.
In Phase 2, after forming a bearish SMT and breaking the market structure, the market enters a decline phase, confirming institutional selling.
Quarterly Theory ICT 05 Indicator Settings
The following items pertain to the settings of the Quarterly Theory 05 Indicator:
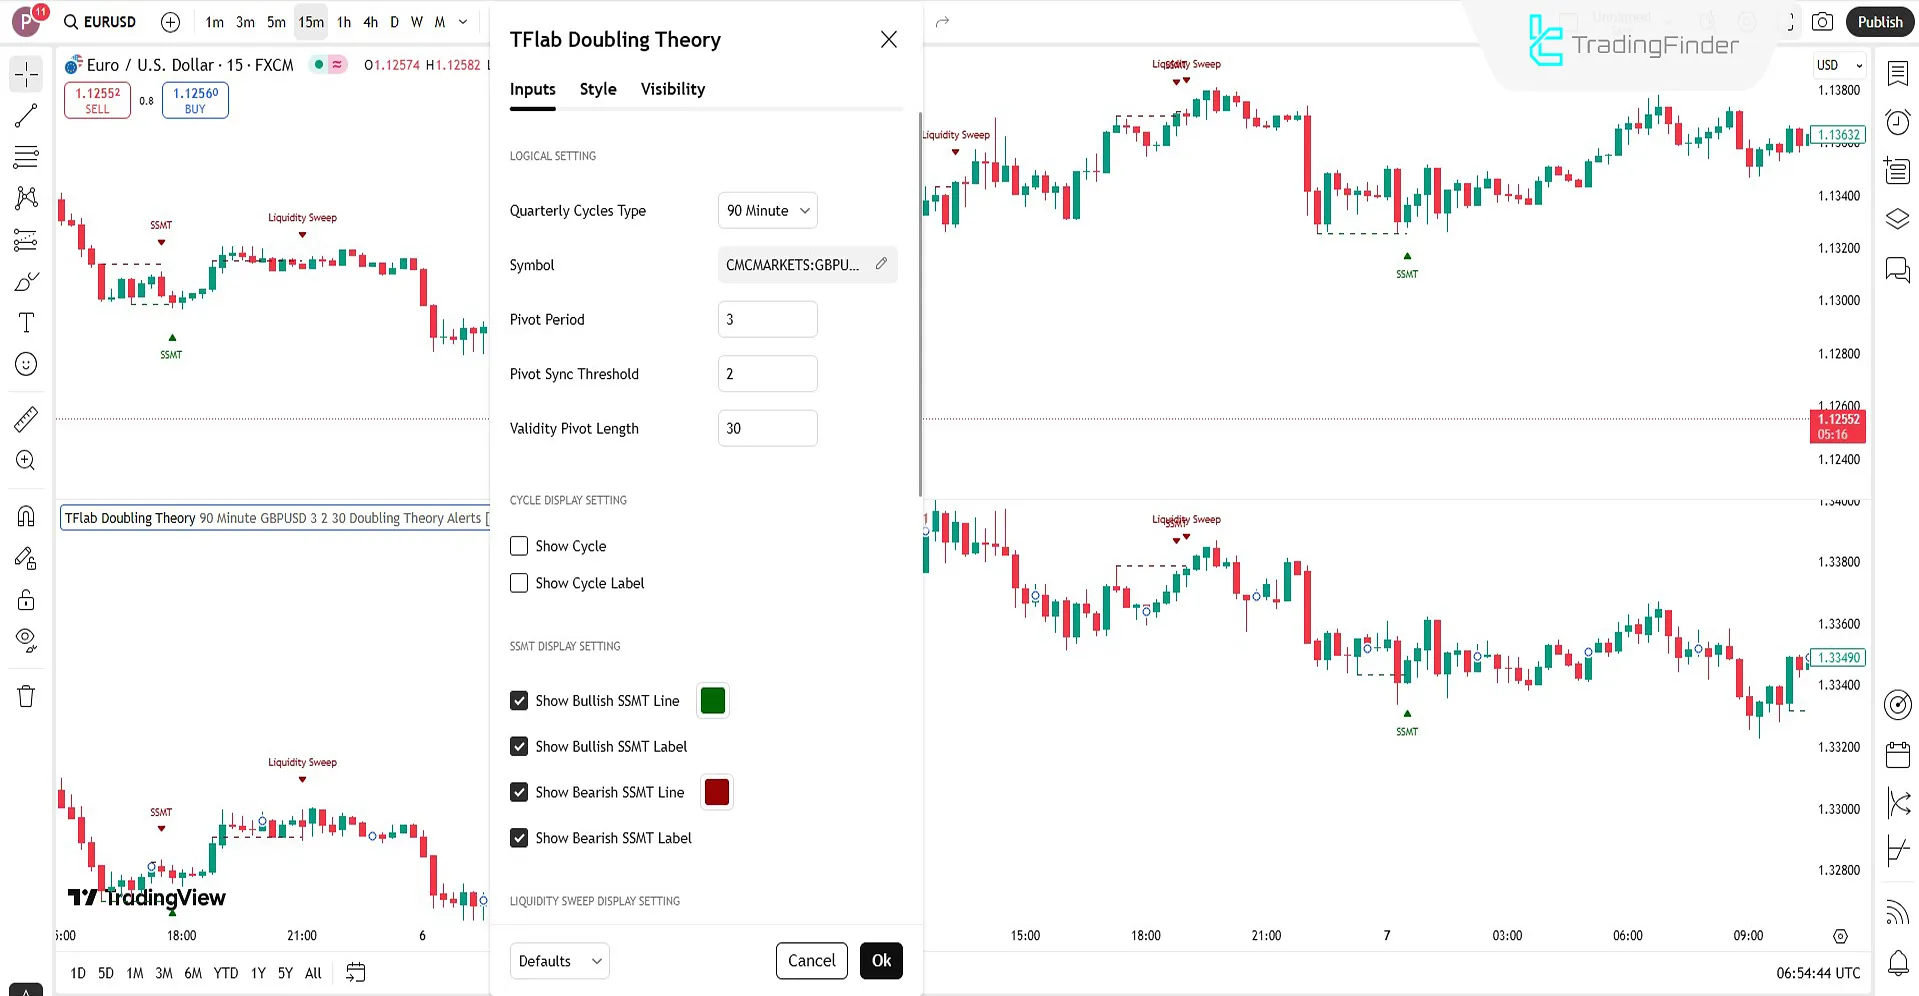
Logical Setting
- Quarterly Cycles Type: Type of time cycle
- Symbol: Second asset
- Pivot Period: Period to identify pivots
- Pivot Sync Threshold: Maximum time difference between two pivots
- Validity Pivot Length: Number of candles to validate the pivot
Cycle Display Setting
- Show Cycle: Enable time cycle display
- Show Cycle Label: Show labels for cycle phases
SSMT Display Setting
- Show Bullish SSMT Line: Display bullish Smart Money divergence lines
- Show Bullish SSMT Label: Display text label for bullish SSMT
- Show Bearish SSMT Line: Display bearish divergence lines
- Show Bearish SSMT Label: Display text label for bearish SSMT
Liquidity Sweep Display Setting
- Show Low Liquidity Line: Line for low liquidity zones
- Show Low Liquidity Label: Text label for liquidity sweeps at lows
- Show High Liquidity Line: Line for high liquidity zones
- Show High Liquidity Label: Text label for liquidity sweeps at highs
SMT Display Setting
- Show Bullish SMT Line: Line between assets showing bullish SMT
- Show Bullish SMT Label: Label for bullish SMT divergence
- Show Bearish SMT Line: Bearish SMT divergence line between correlated assets
- Show Bearish SMT Label: Label for bearish SMT divergence
Alert Settings
- Alert Name: Name of alert
- Message Frequency: Frequency of alert messages
- Show Alert time by Time Zone: Display alert time based on time zone
- Bullish SMT Divergence: Alert for bullish SMT divergence
- Bearish SMT Divergence: Alert for bearish SMT divergence
Input Values
- Inputs in the status line: Show indicator values on the chart status bar
Conclusion
The Quarterly Theory ICT 05 Indicator, through analysis of correlated assets, identifies institutional entry and exit points via behavioral divergences and structural reversals.
The market is divided into two core phases Doubling 1 and Doubling 2. In the first phase, the indicator detects SSMT divergences between correlated assets to reveal Smart Money activity. In the second phase, price returns to key liquidity zones with an SMT divergence, offering precise trade entries.
Quarterly Theory ICT 05 TradingView PDF
Quarterly Theory ICT 05 TradingView PDF
Click to download Quarterly Theory ICT 05 TradingView PDFWhat trading styles is this indicator suitable for?
This tool is ideal for Price Action, ICT, Smart Money, and short to mid-term traders.
Is this indicator only for currency pairs?
No, it can be used with any correlated instruments, including indices, cryptocurrencies, and commodities.


