


TradingView
MetaTrader4
MetaTrader5
The Sweep Swing indicator was upgraded on September 1, 2025, with modifications in the settings and enhancements to the algorithm, and has been released as the improved version titled Smart Money Trap.
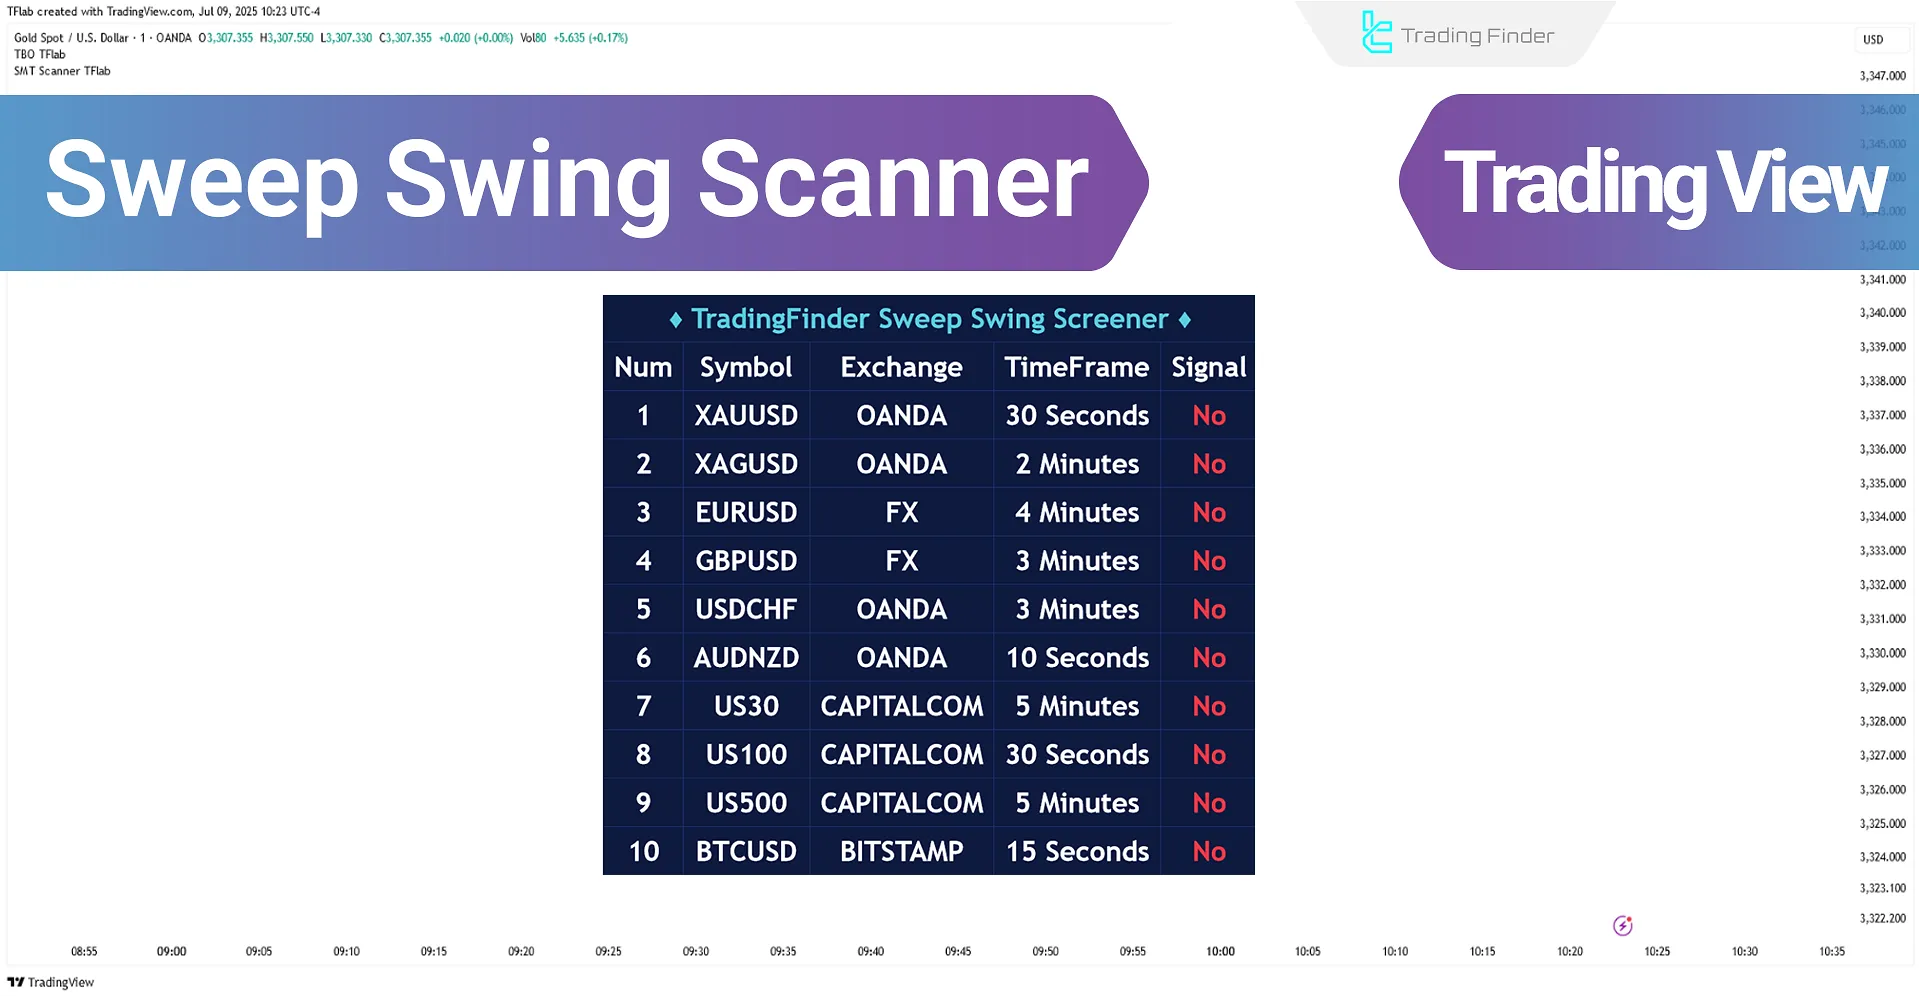
The Sweep Swing Screener is an advanced technical analysis tool specifically designed to identify potential reversal points based on liquidity sweep logic and price behavior at swing points.
This screener is built upon a combination of three key components:
- Market Structure
- Liquidity Behavior
- Candle Confirmation
It automatically scans the chart to detect zones where price reversal is highly probable.
Access to this screener is available with a $50 payment.
After completing the payment, please get in touch with us via the website's live chat, or through Telegram or WhatsApp so that we can send you the activation link.
Sweep Swing Screener Specification Table
The general specifications and features of the Liquidity Sweep Screener are summarized in the table below:
Indicator Categories: | ICT Tradingview Indicators Smart Money Tradingview Indicators Liquidity Tradingview Indicators |
Platforms: | Trading View Indicators |
Trading Skills: | Advanced |
Indicator Types: | Reversal Tradingview Indicators |
Timeframe: | Multi-Timeframe Tradingview Indicators |
Trading Style: | Intraday Tradingview Indicators |
Trading Instruments: | TradingView Indicators in the Forex Market Cryptocurrency Tradingview Indicators Stock Tradingview Indicators Commodity Tradingview Indicators Indices Tradingview Indicators Share Stocks Tradingview Indicators |
Sweep Swing Screener at a Glance
The Sweep Screener is designed to identify high-probability reversal zones using market structure and liquidity behavior. Its analysis process is as follows:
Identifying Swing Points (Swing High / Swing Low)
It detects key highs and lows areas often associated with liquidity accumulation and the placement of stop-loss orders.
Defining the Reaction Zone
Once a valid "Swing" is identified, the screener defines a "Reaction Zone", extending from the swing level to the highest or lowest open/close price of the related candle.
This zone becomes a key area for evaluating future price reactions and potential signal generation.
Analyzing the Liquidity Sweep
At this stage, the tool assesses the return of price to the reaction zone and a breach of the swing level.
This breach may be a true breakout or simply a liquidity sweep. Distinguishing between the two is the tool's core function for filtering false breakouts.
Detecting Failed Breakouts with Candle Confirmation
If, after the sweep, the price closes inside the reaction zone with the formation of an indecision candle (e.g., a Doji), this indicates a failed breakout and the absorption of Smart Money Trap.
Note: A valid signal is issued only when all of the following conditions are met:
- A liquidity sweep has occurred;
- The confirmation candle closes within the reaction zone;
- The time gap between the swing point and confirmation candle is below the allowed threshold (e.g., 50 candles).
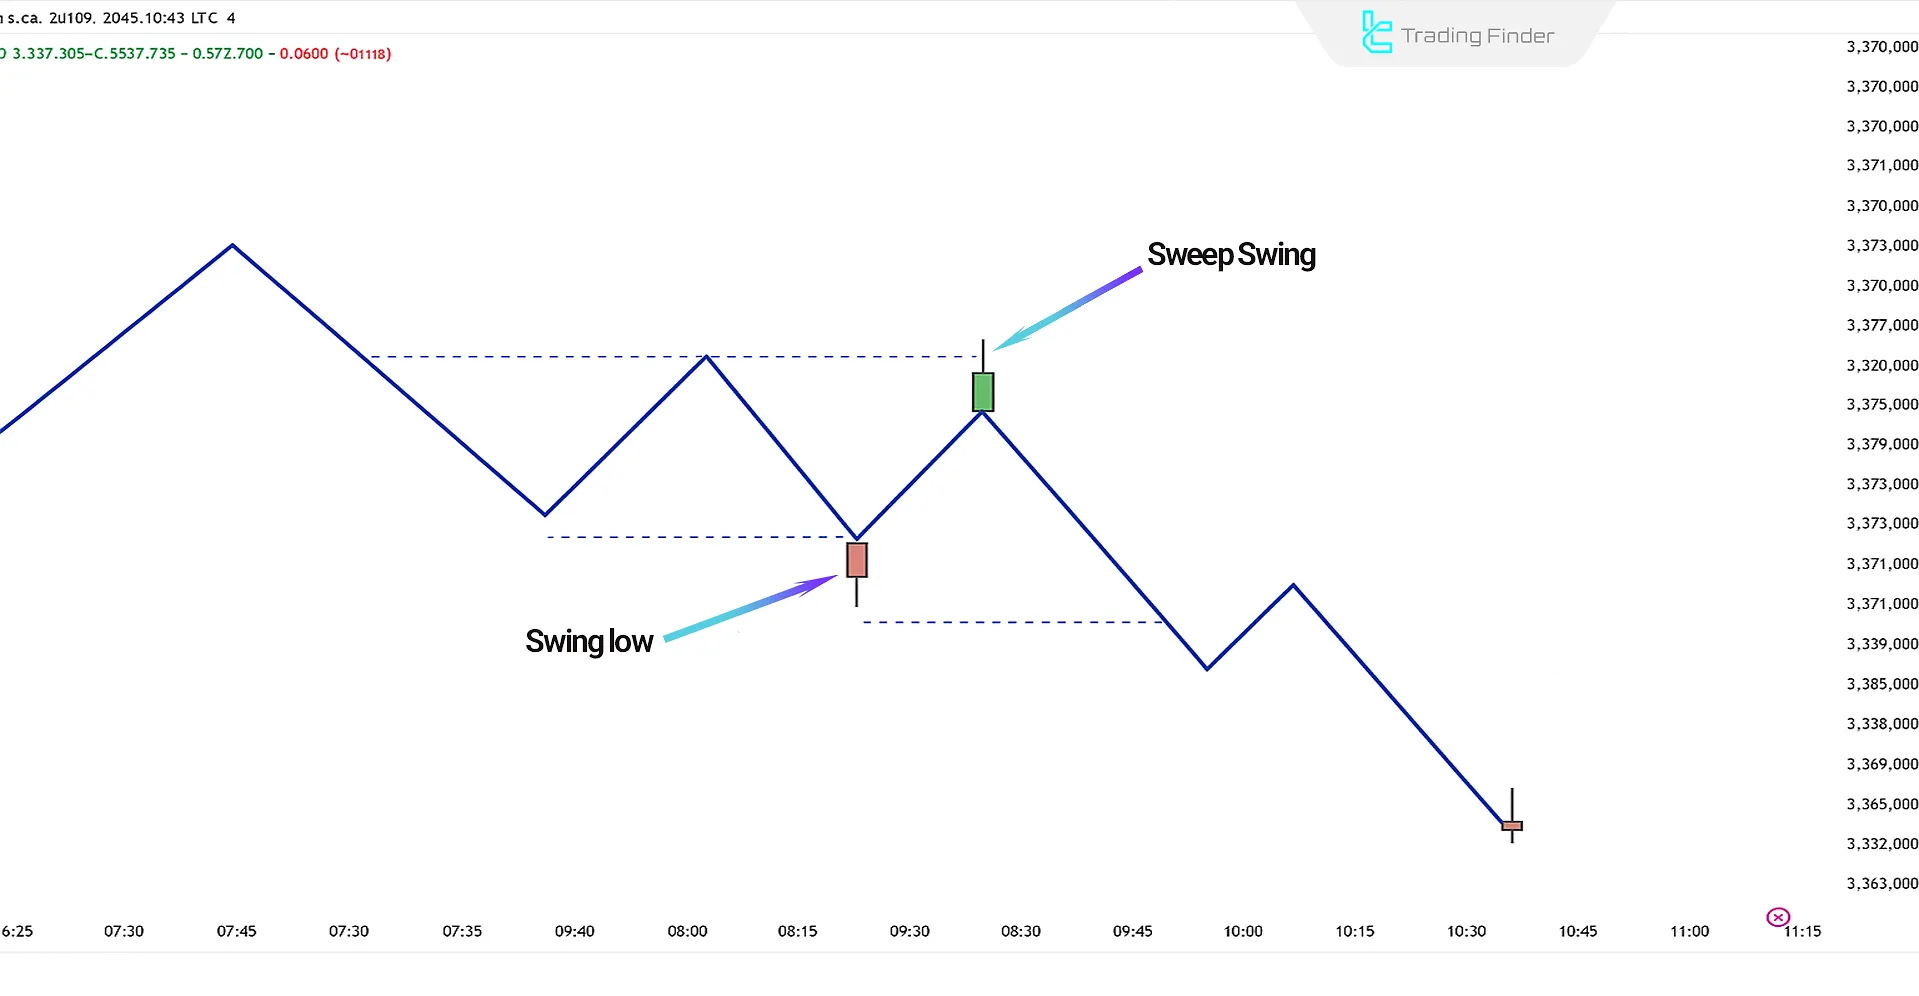
Screener Behavior in Bullish Trends
A buy signal is generated when, after forming a valid swing low, the price returns to the area and temporarily breaks below it. This short-lived breach is considered a liquidity sweep.
If the price then re-enters the reaction zone and closes with a confirmation candle (such as a Doji or short-bodied candle), it indicates weakening selling pressure and a likely bullish reversal. The screener issues a buy signal and, if enabled, sends an alert notification.
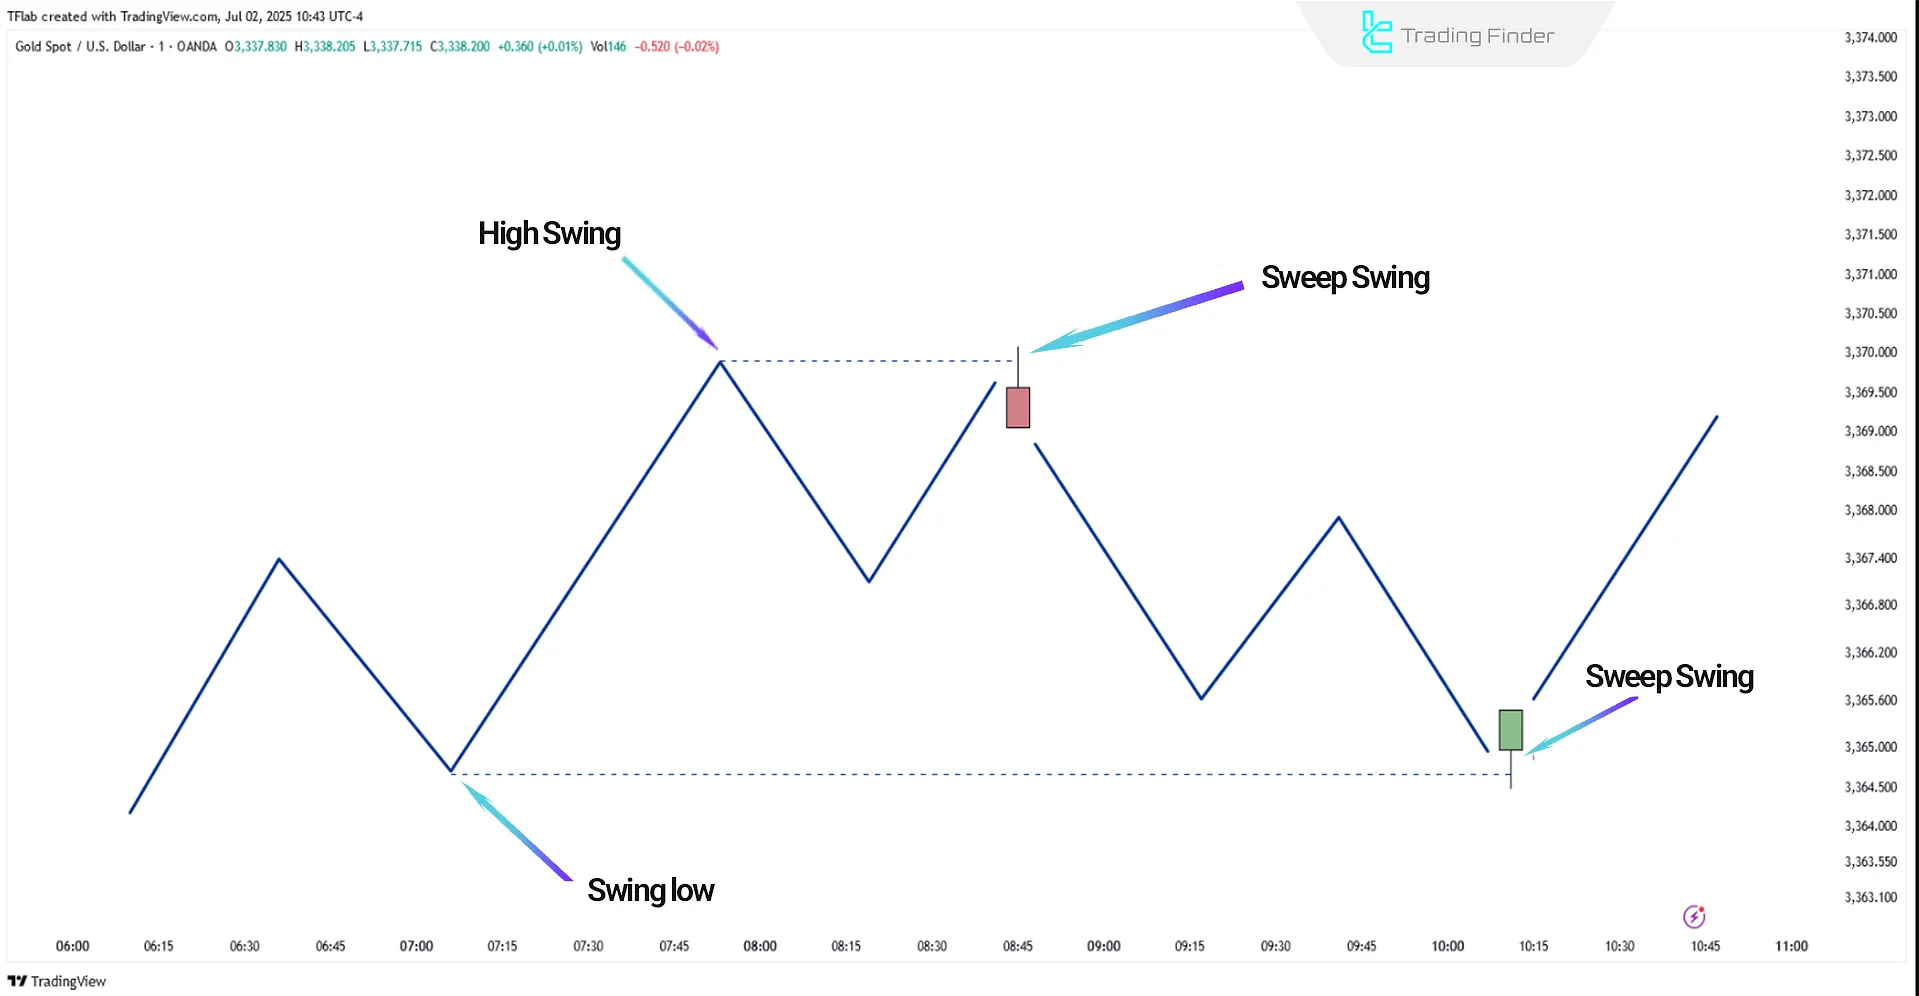
Screener Behavior in Bearish Trends
A sell signal is issued when, after forming a valid swing high, the market returns to that level and fakes a breakout above the swing.
If the price then returns below the reaction zone after a failed breakout and an indecision or rejection candle closes within the area, the screener generates a sell signal and, if necessary, sends the corresponding alert.
Sweep Swing Screener Settings
The image below represents the adjustable settings of the Sweep Swing Screener:
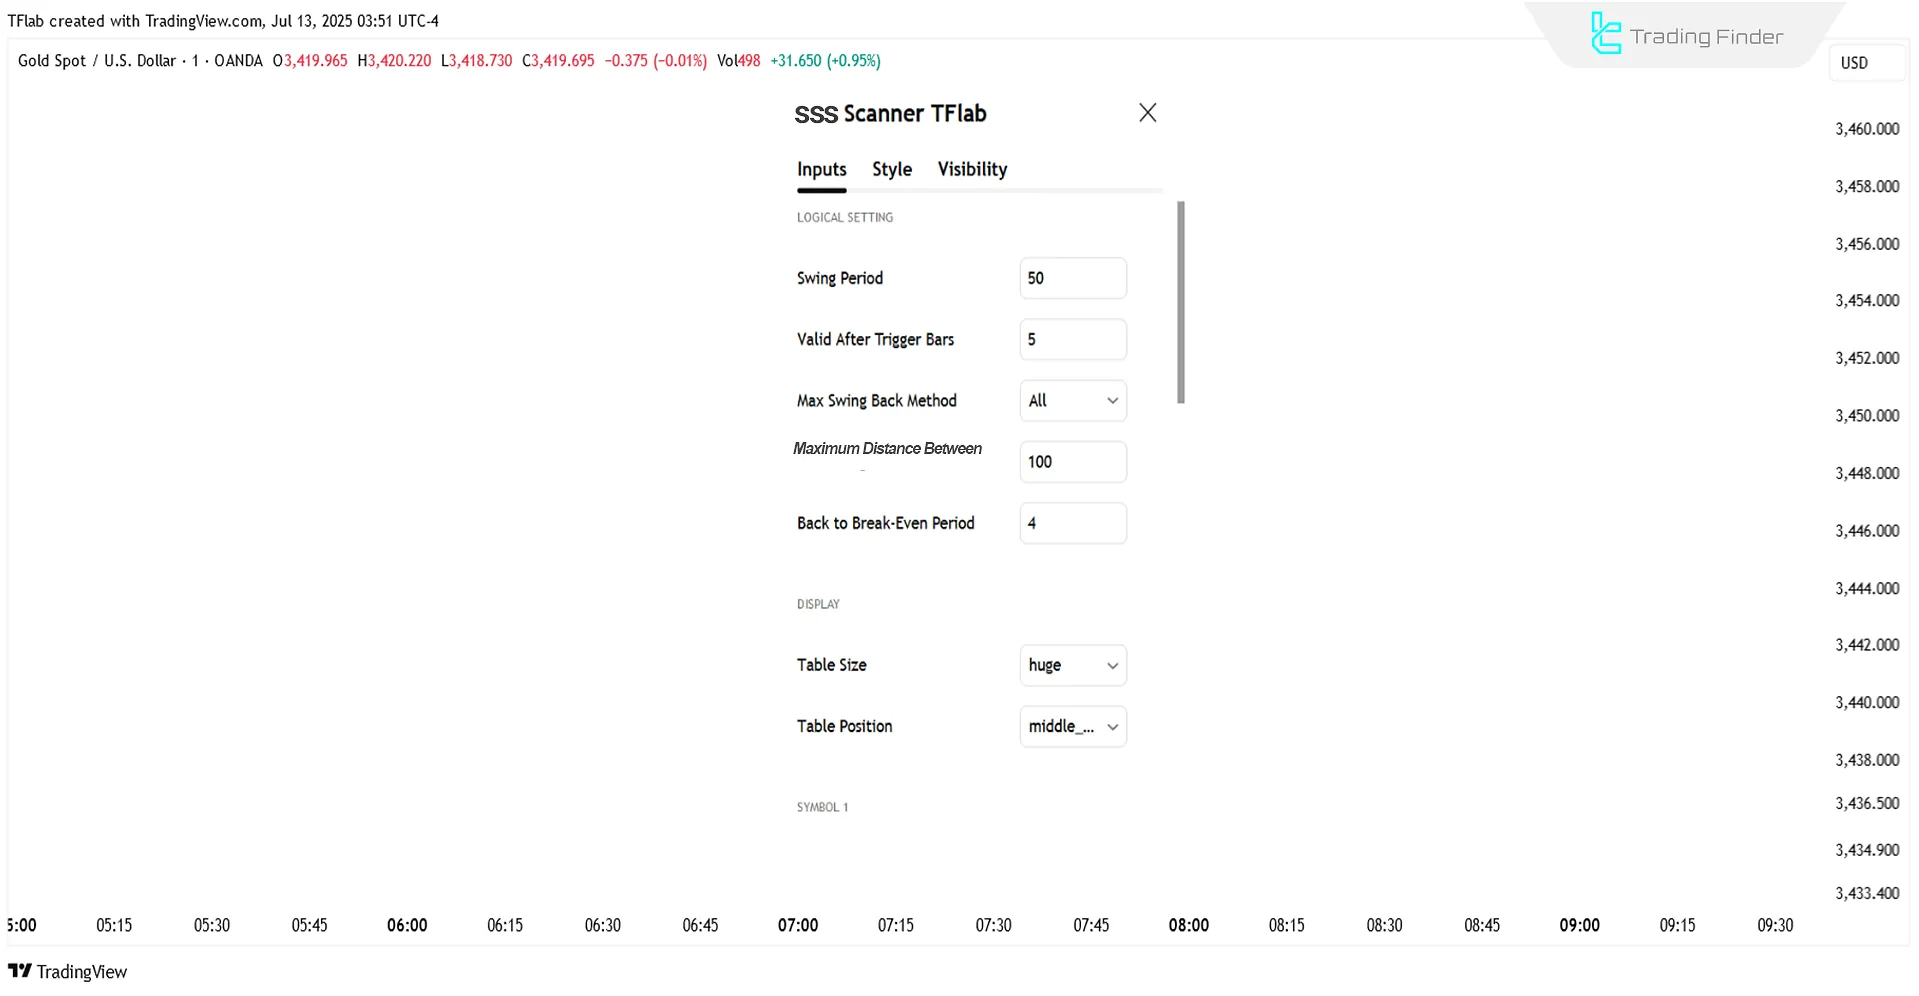
Logical Settings
- Swing Period: Period for swing point detection;
- Max Swing Back Method: Method for evaluating maximum past swings;
- Max Swing Back: Maximum number of lookback swings;
- Maximum Distance Between Swing and Signal: The maximum allowable time gap between swing and signal generation.
Display Settings
- Table Size: Table dimensions;
- Table Position: Table display position;
Symbol Settings
- Symbol: Trading symbol;
- Timeframe: Chart timeframe.
Alert Settings
- Alert: Toggle alert on/off;
- Message Frequency: Frequency of alert messages;
- Show Alert Time by Time Zone: Display alert time by time zone.
Conclusion
The Sweep Swing Screener combines market structure, liquidity, and candlestick confirmation to detect high-probability reversal zones automatically.
By filtering out false breakouts and focusing on areas of liquidity absorption, it provides accurate entry and exit signals.
Sweep Swing Screener On TradingView PDF
Sweep Swing Screener On TradingView PDF
Click to download Sweep Swing Screener On TradingView PDFHow does the Liquidity Sweep Screener detect reversal points?
By identifying valid swing highs/lows and analyzing price behavior within the reaction zone, it detects potential reversals in case of failed breakouts, confirmed by candle patterns.
Can multiple symbols be Screener simultaneously using this screener?
Yes. Using the Symbol setting, up to 10 different symbols can be scanned and analyzed independently, each with its separate timeframe.


