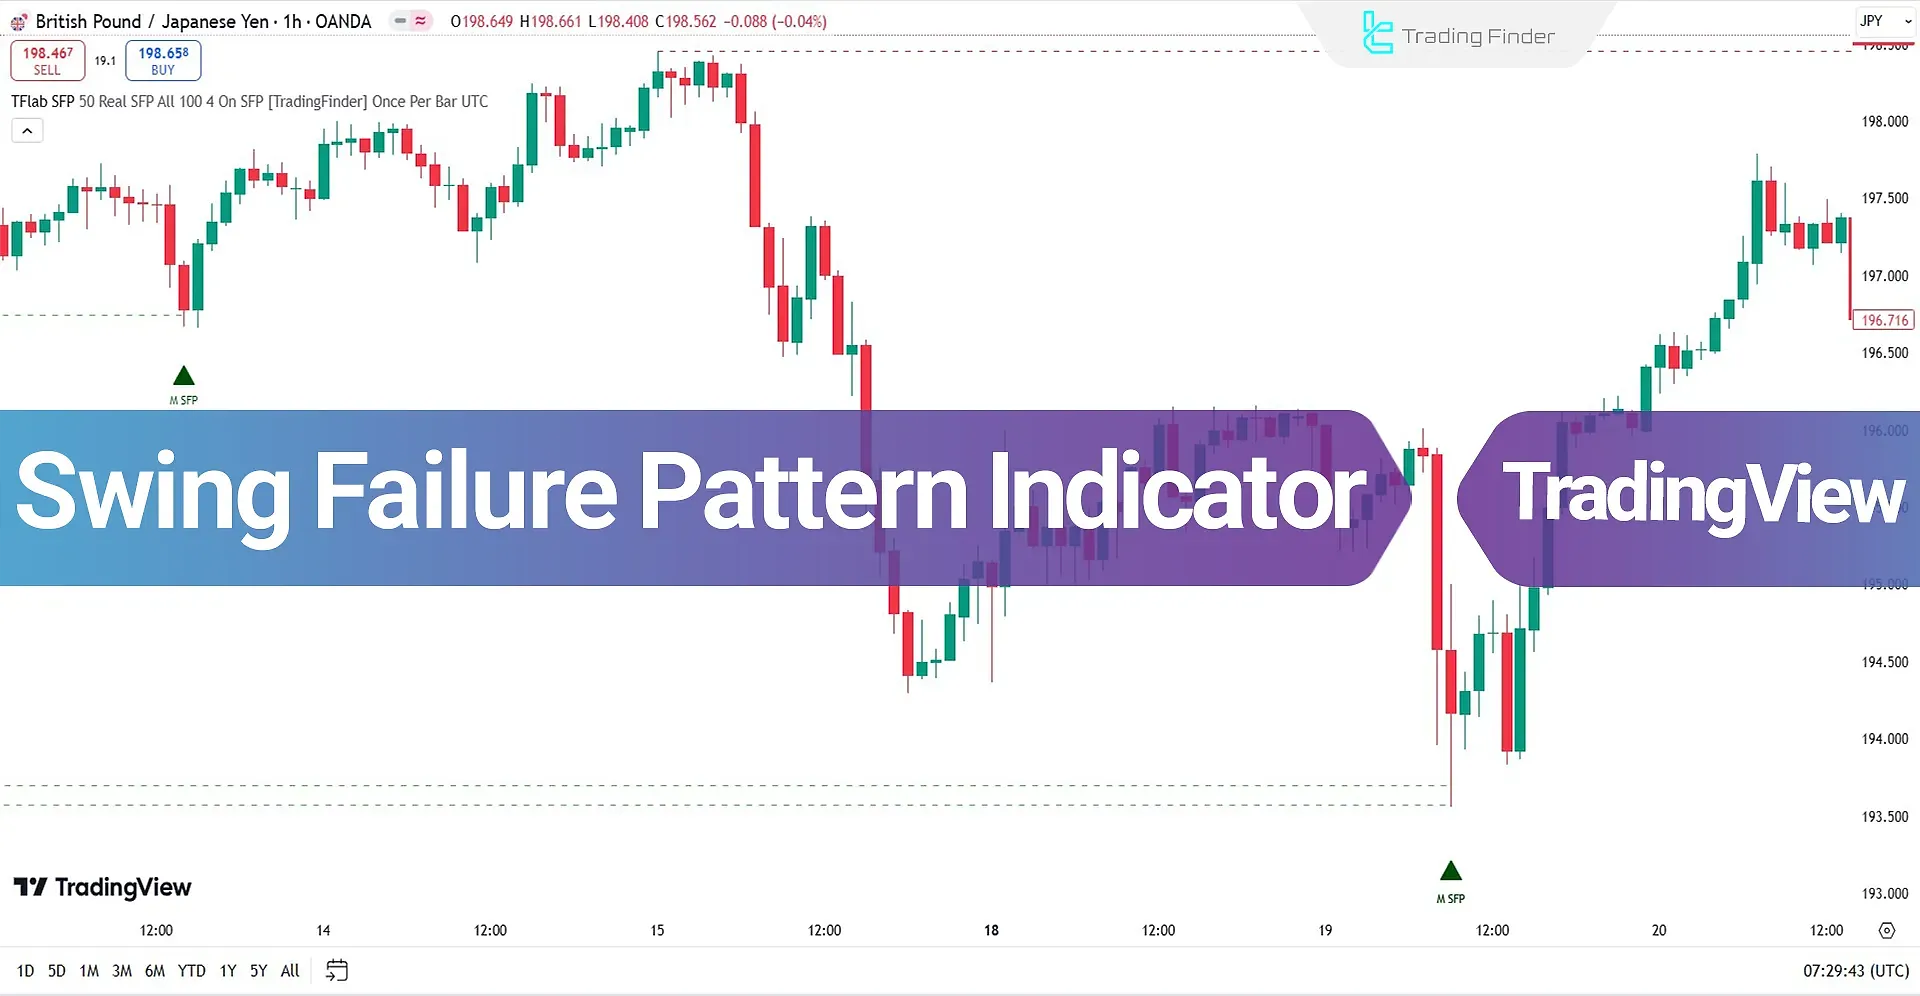
The Swing Failure Pattern (SFP) Indicator is designed to identify false breakouts at key price levels among TradingView indicators. This pattern forms when the price temporarily crosses the previous low or high level with the candle’s wick and breaks it.

The breakout caused by the price is fake and quickly reverts to its original trend.The primary purpose of this movement is to trigger liquidity zones and stop-losses in the Fake Breakout Zone, which is located in that area.
Indicator Specifications
The following table summarizes the specifications of the Swing Failure Pattern indicator:
Indicator Categories: | ICT Tradingview Indicators Smart Money Tradingview Indicators Liquidity Tradingview Indicators |
Platforms: | Trading View Indicators |
Trading Skills: | Intermediate |
Indicator Types: | Reversal Tradingview Indicators |
Timeframe: | Multi-Timeframe Tradingview Indicators |
Trading Style: | Intraday Tradingview Indicators |
Trading Instruments: | TradingView Indicators in the Forex Market Cryptocurrency Tradingview Indicators Stock Tradingview Indicators Commodity Tradingview Indicators Share Stocks Tradingview Indicators |
Indicator at a Glance
This indicator marks price highs in green and price lows in red, enabling traders to easily identify key trend reversal points.
This feature is especially useful for trading styles like ICT, Smart Money, and other liquidity-based strategies. The indicator also displays green arrows for buy entry signals and red arrows for sell entry signals.
Indicator in an Uptrend
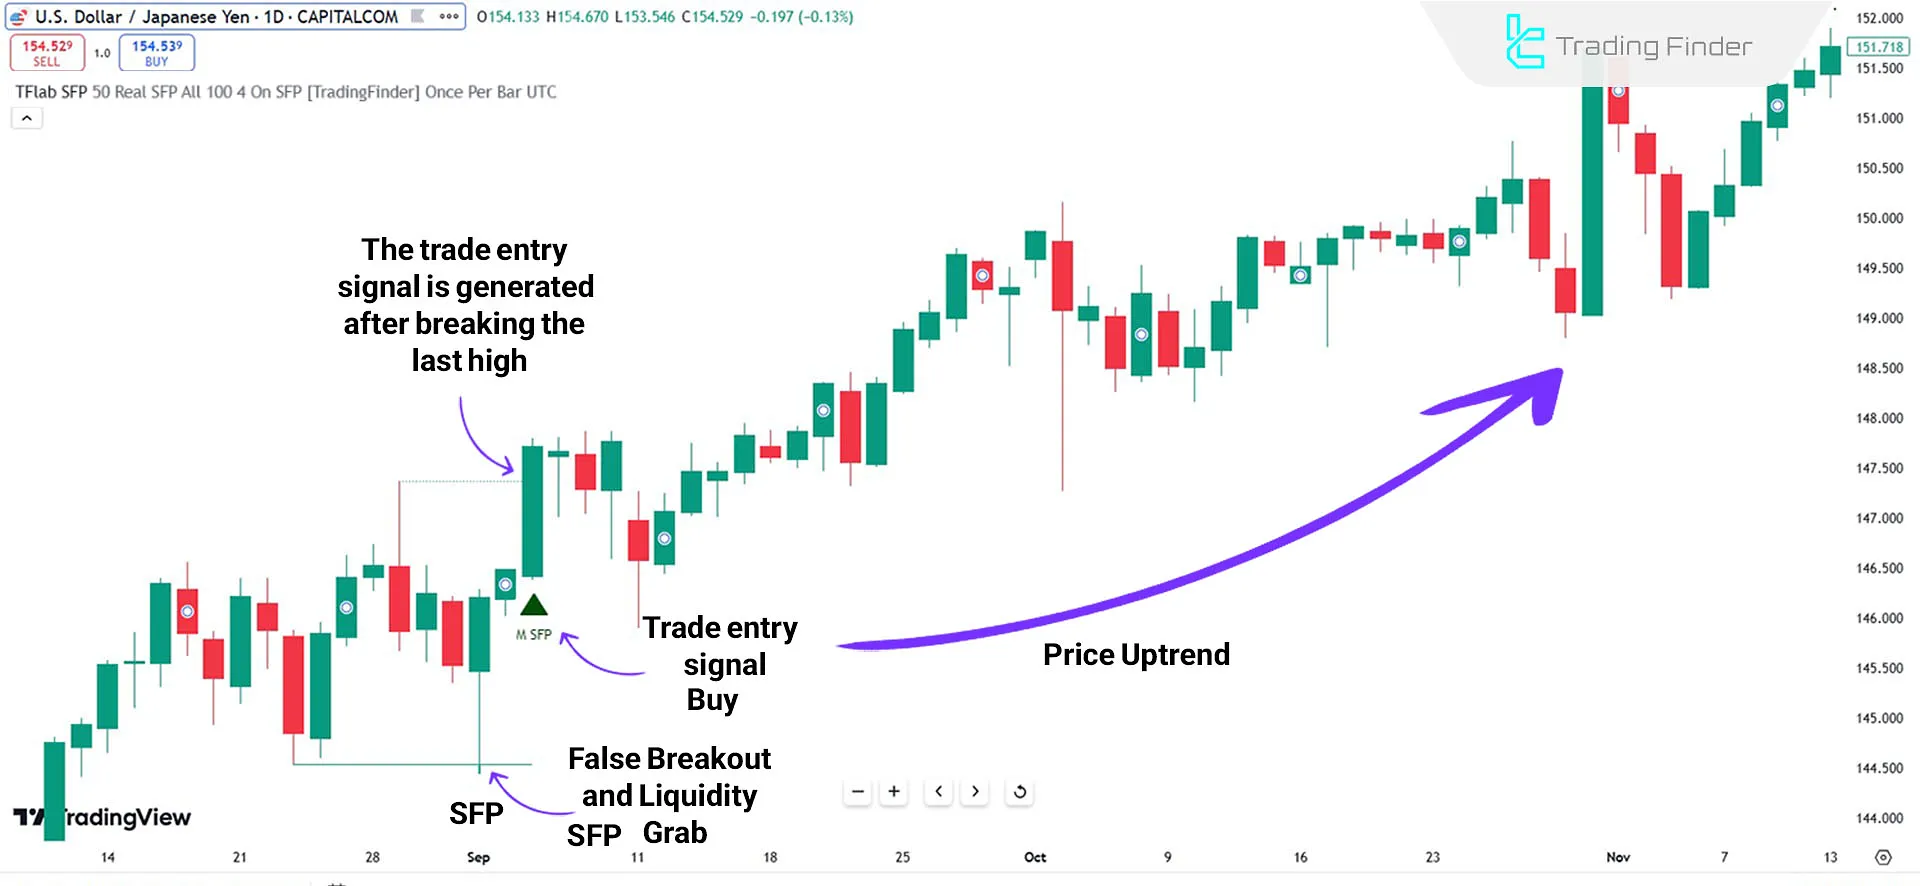
The SFP pattern is identified in the daily timeframe chart of the USD/JPY currency pair. The price initially breaks the support level as a false breakout but fails to close below this level.
After collecting liquidity and triggering stops, the price quickly reverts to its original trend. Upon receiving the necessary confirmations, the indicator displays a buy signal with a green arrow.

Indicator in a Downtrend
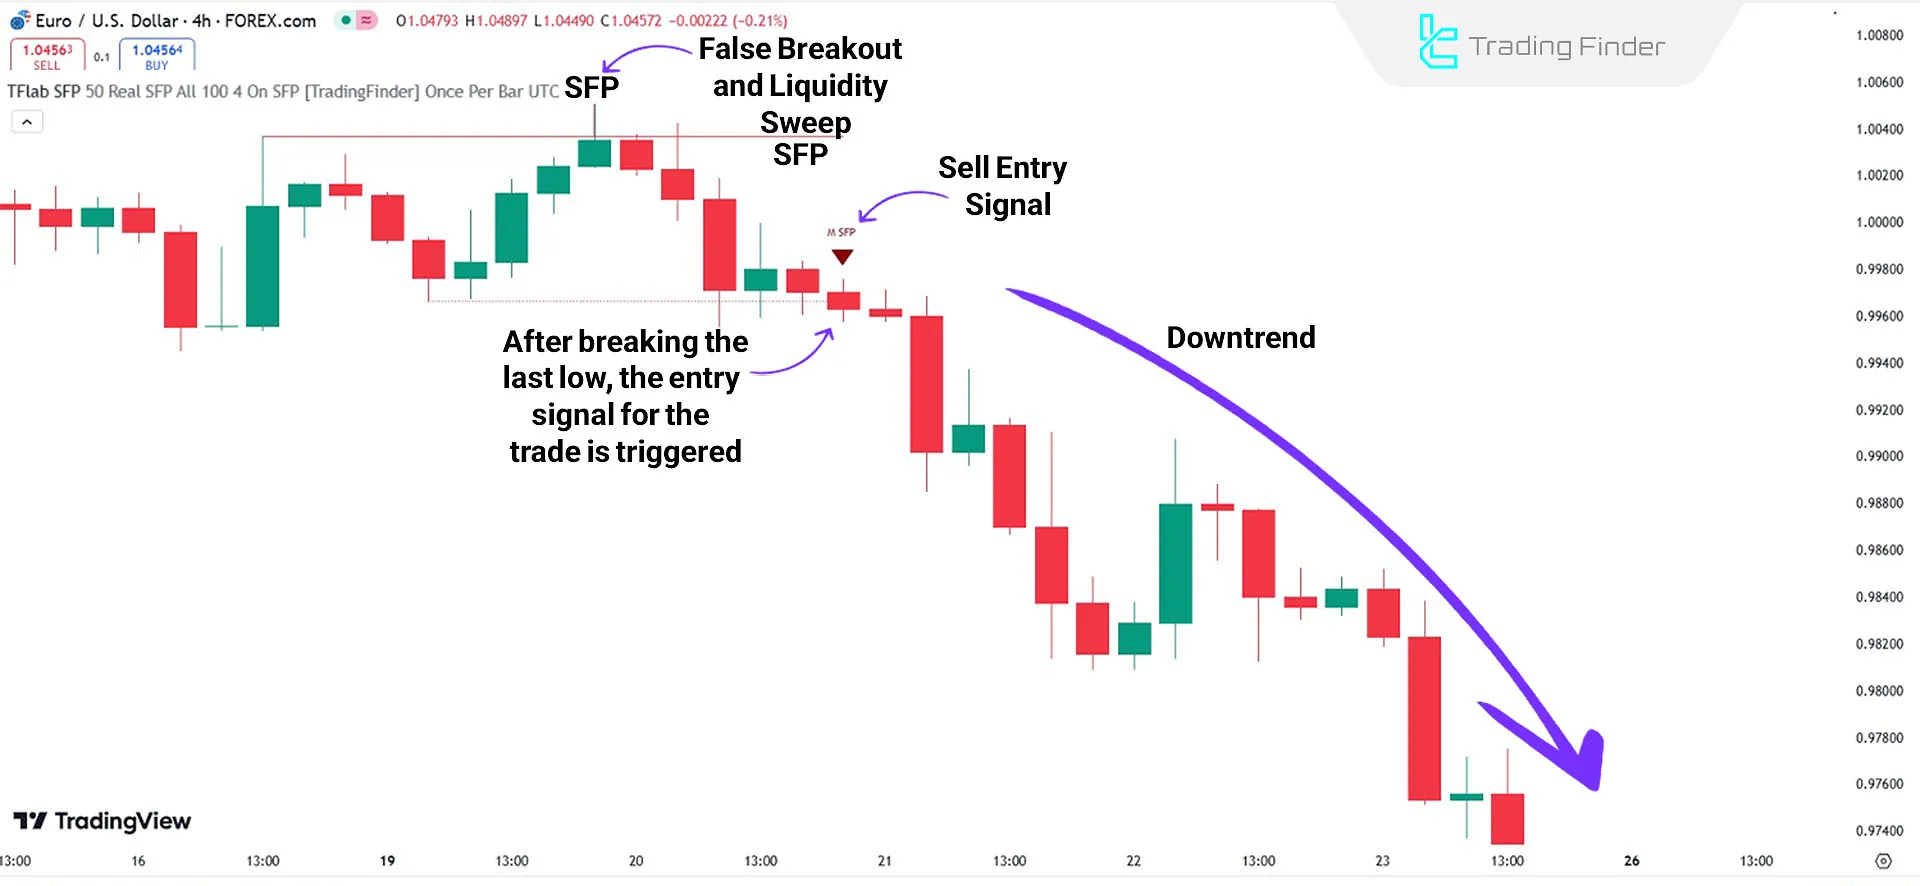
In the daily timeframe chart of the EUR/USD currency pair, the price temporarily breaks the resistance level and captures the liquidity in that area.
After falling below the resistance level, the indicator issues a sell signal with a red arrow. This signal allows traders to enter a trade and exploit the ongoing downtrend.

Indicator Settings
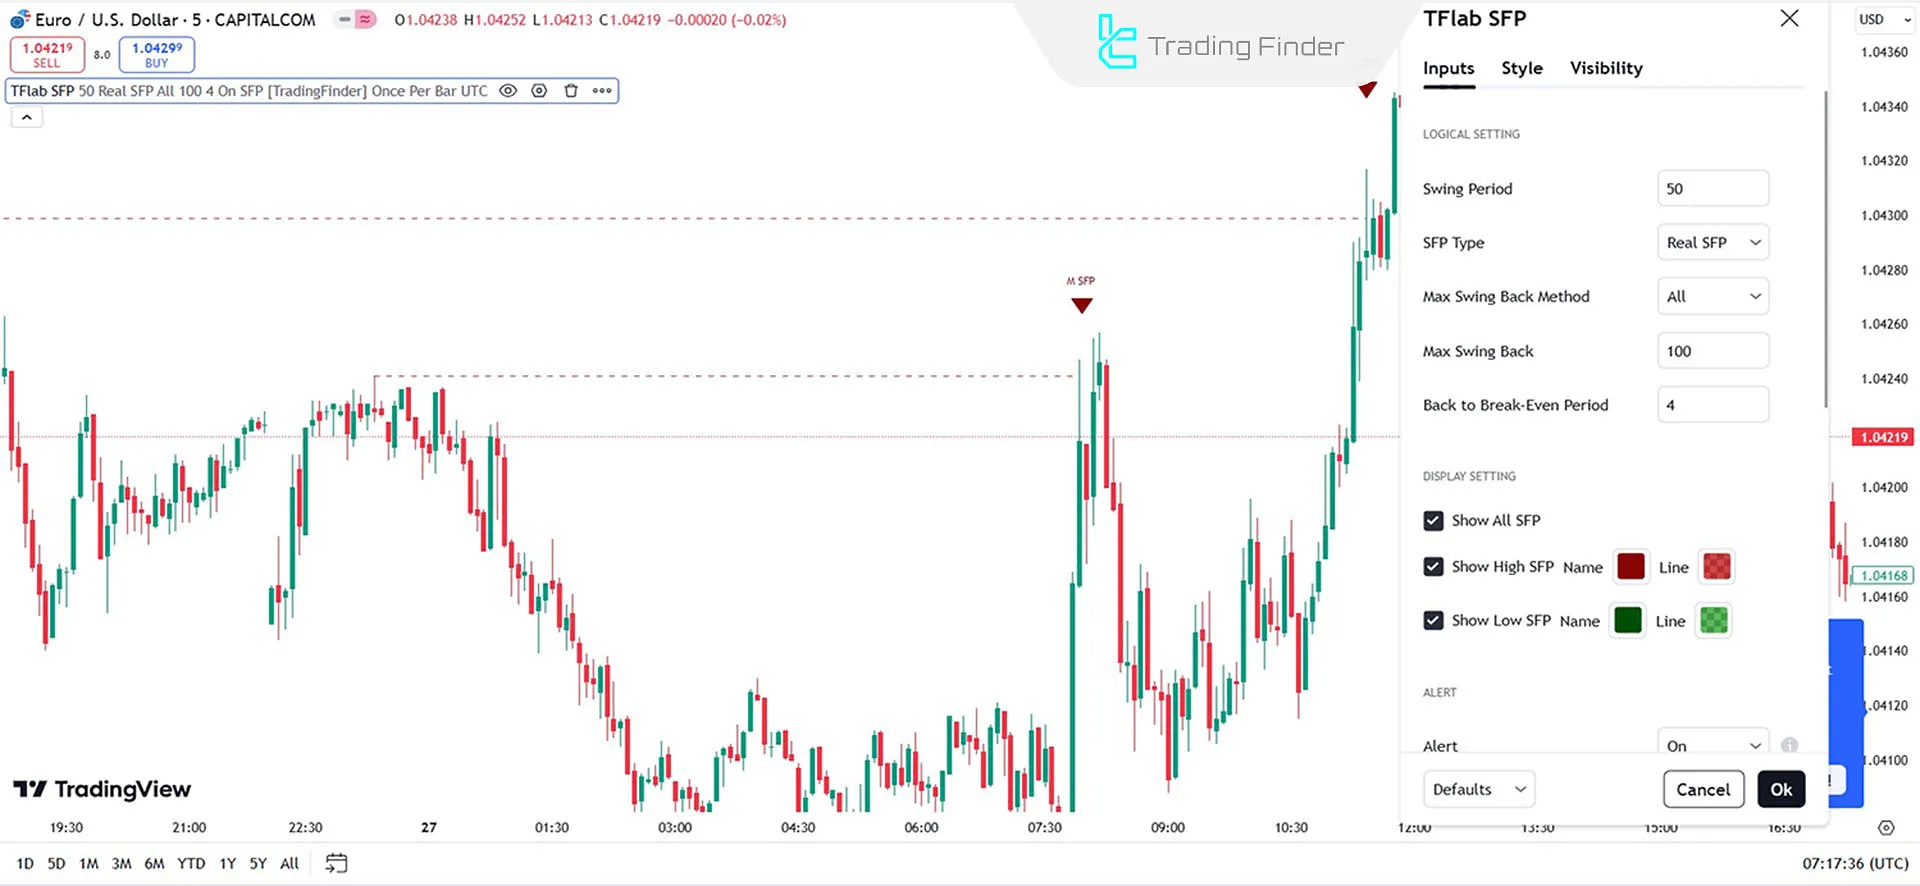
The image below explains the complete indicator settings, including [Logical Setting, Display Setting, and Alert]:

Logical Setting
- Swings Period: Determines the number of candles for identifying swings (Default: 50);
- SFP Type: Specifies the type of false breakout;
- Max Swing Back Method: Chooses the calculation method for price reversion;
- Max Swing Back: Maximum reversion distance from the breakout level;
- Back to Break-Even Period: Time period for price returning to break-even.
Display Setting
- Show All SFP: Activates the display of all false breakouts;
- Show High SFP: Displays false breakouts of highs with specific color and line (red);
- Show Low SFP: Displays false breakouts of lows with specific color and line (green).
Alert
- Alert: Configures alert status;
- Alert Name: Specifies the name for quick identification;
- Message Frequency: Sets the frequency of alert messages;
- Show Alert Time by Time Zone: Displays alert time according to the selected time zone.
Conclusion
The Swing Failure Pattern (SFP) indicator is a practical tool in technical analysis for identifying false breakouts at key price levels.
Designed for liquidity-based trading styles, including ICT and Smart Money, the SFP indicator provides green and red arrows signals, allowing traders to identify trends and suitable entry and exit points.
Swing Failure Pattern SFP TradingView PDF
Swing Failure Pattern SFP TradingView PDF
Click to download Swing Failure Pattern SFP TradingView PDFIs this indicator usable across all timeframes?
Yes, this multi-timeframe indicator is suitable for short-term and long-term analyses.
Is this indicator sufficient on its own?
Although the SFP indicator is powerful, it is recommended that it be used alongside other analytical tools and technical confirmations.


