TradingView
MetaTrader4
MetaTrader5
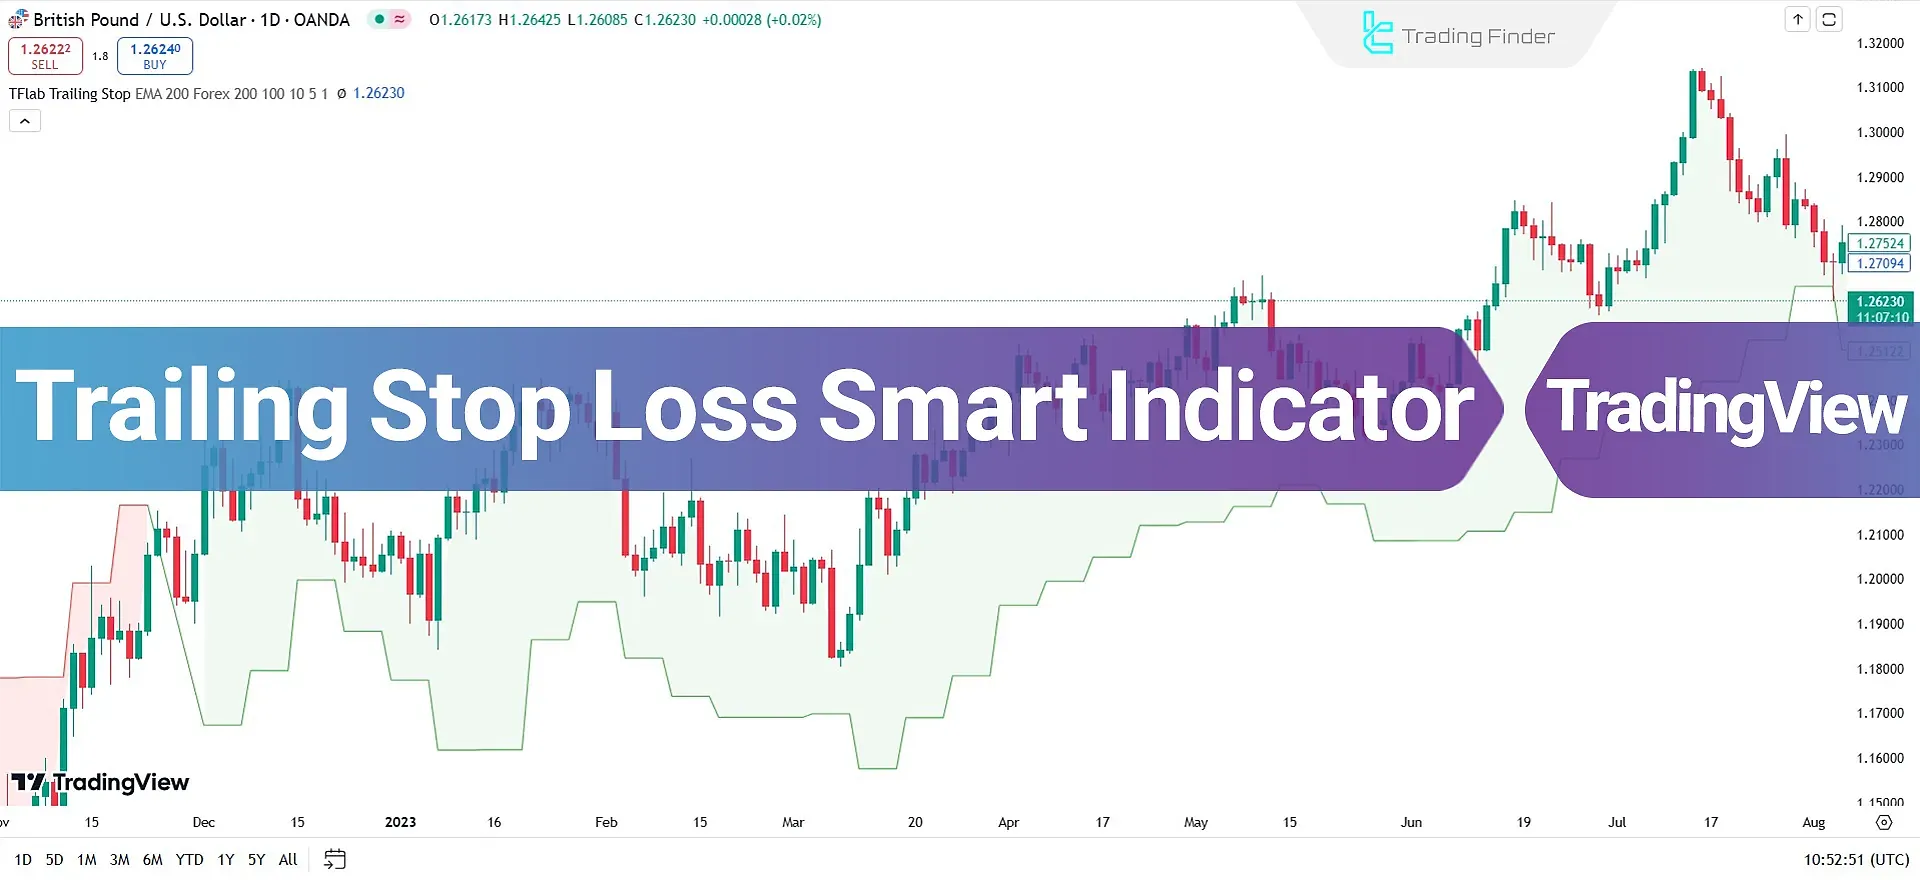
The Trailing Stop Loss Smart Indicator is one of the advanced TradingView indicators designed for risk management and market trend identification.
By integrating several key concepts such as Cumulative Volume Delta (CVD), Exponential Moving Average (EMA), and Average True Range (ATR), this indicator assists traders in making informed trading decisions.

Its primary goal is to enhance the accuracy of entry and exit decisions, minimize potential losses, and maximize profits using trailing stop-loss techniques.
Trailing Stop Loss Smart Indicator Specifications
Indicator Categories: | ICT Tradingview Indicators Money Management Tradingview Indicators Levels Tradingview Indicators |
Platforms: | Trading View Indicators |
Trading Skills: | Intermediate |
Indicator Types: | Range Tradingview Indicators |
Timeframe: | Multi-Timeframe Tradingview Indicators |
Trading Style: | Day Trading Tradingview Indicators |
Trading Instruments: | TradingView Indicators in the Forex Market Cryptocurrency Tradingview Indicators |
Indicator Overview
The Trailing Stop Loss Smart Indicator is based on three key components:
- Cumulative Volume Delta (CVD): Calculates the difference between buy (Buy) and sell (Sell) volumes to identify market pressure. Positive values (green cloud) indicate buyer strength, while negative values (red cloud) signify selling pressure;
- Exponential Moving Average (EMA): Detects the overall market trend and allows quick responses to price changes;
- Trailing Stop-Loss: Automatically adjusts stop-loss points to protect trade profits and reduce potential losses.
Indicator in an Uptrend
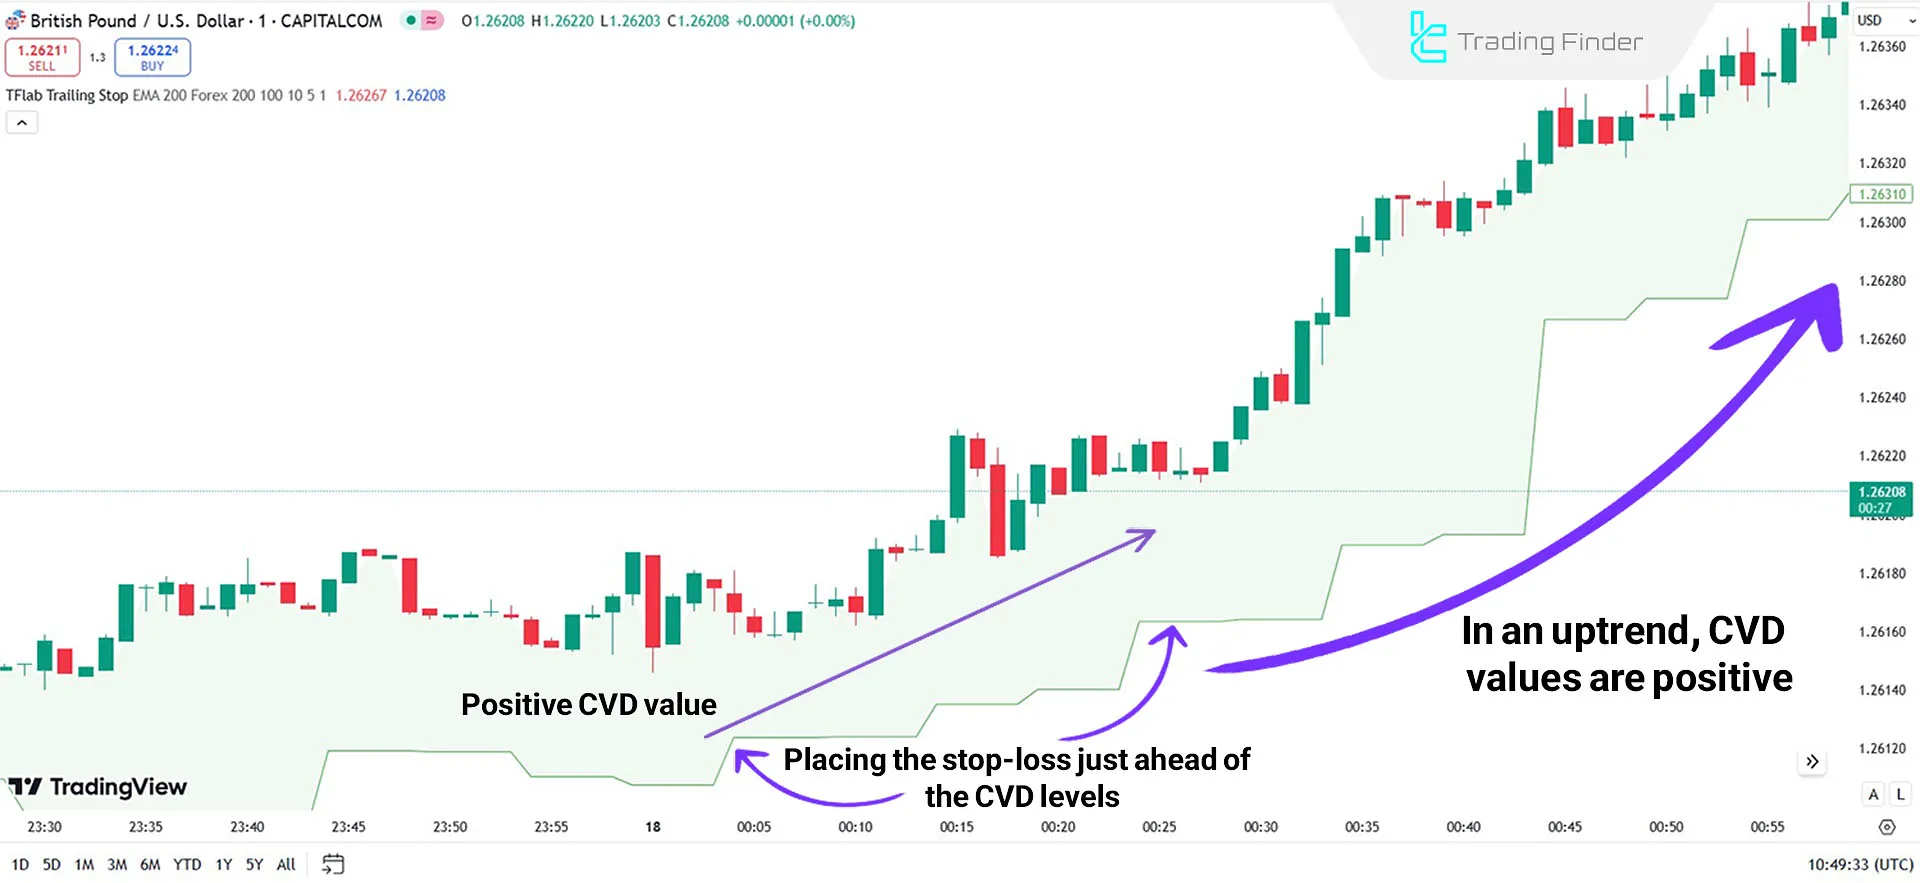
In an uptrend, when the CVD value is positive and the price is above the Exponential Moving Average, traders can enter Buy trades.
Stop-loss levels should be placed ahead of these zones to lock in profits.

Indicator in a Downtrend
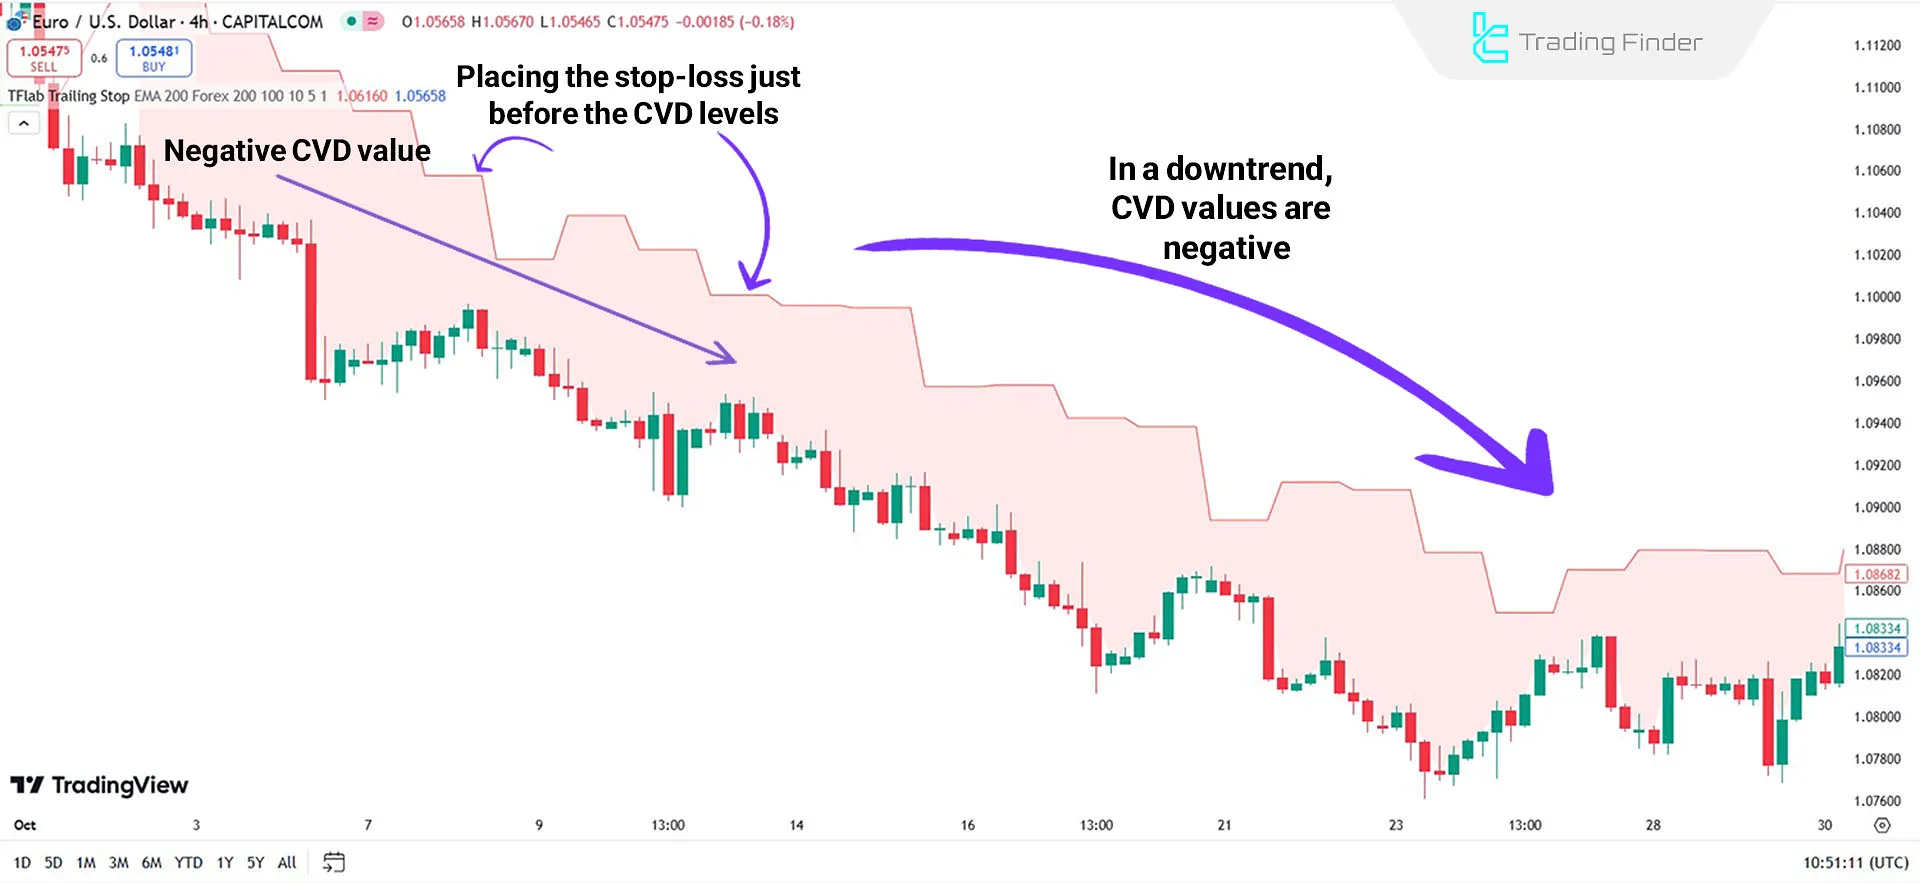
In a downtrend, the CVD value turns negative, and the price moves below the Exponential Moving Average.
This situation indicates increased selling pressure and reduced buyer strength. In this case, traders can enter Sell trades by placing stop-loss levels above these zones.

Indicator Settings

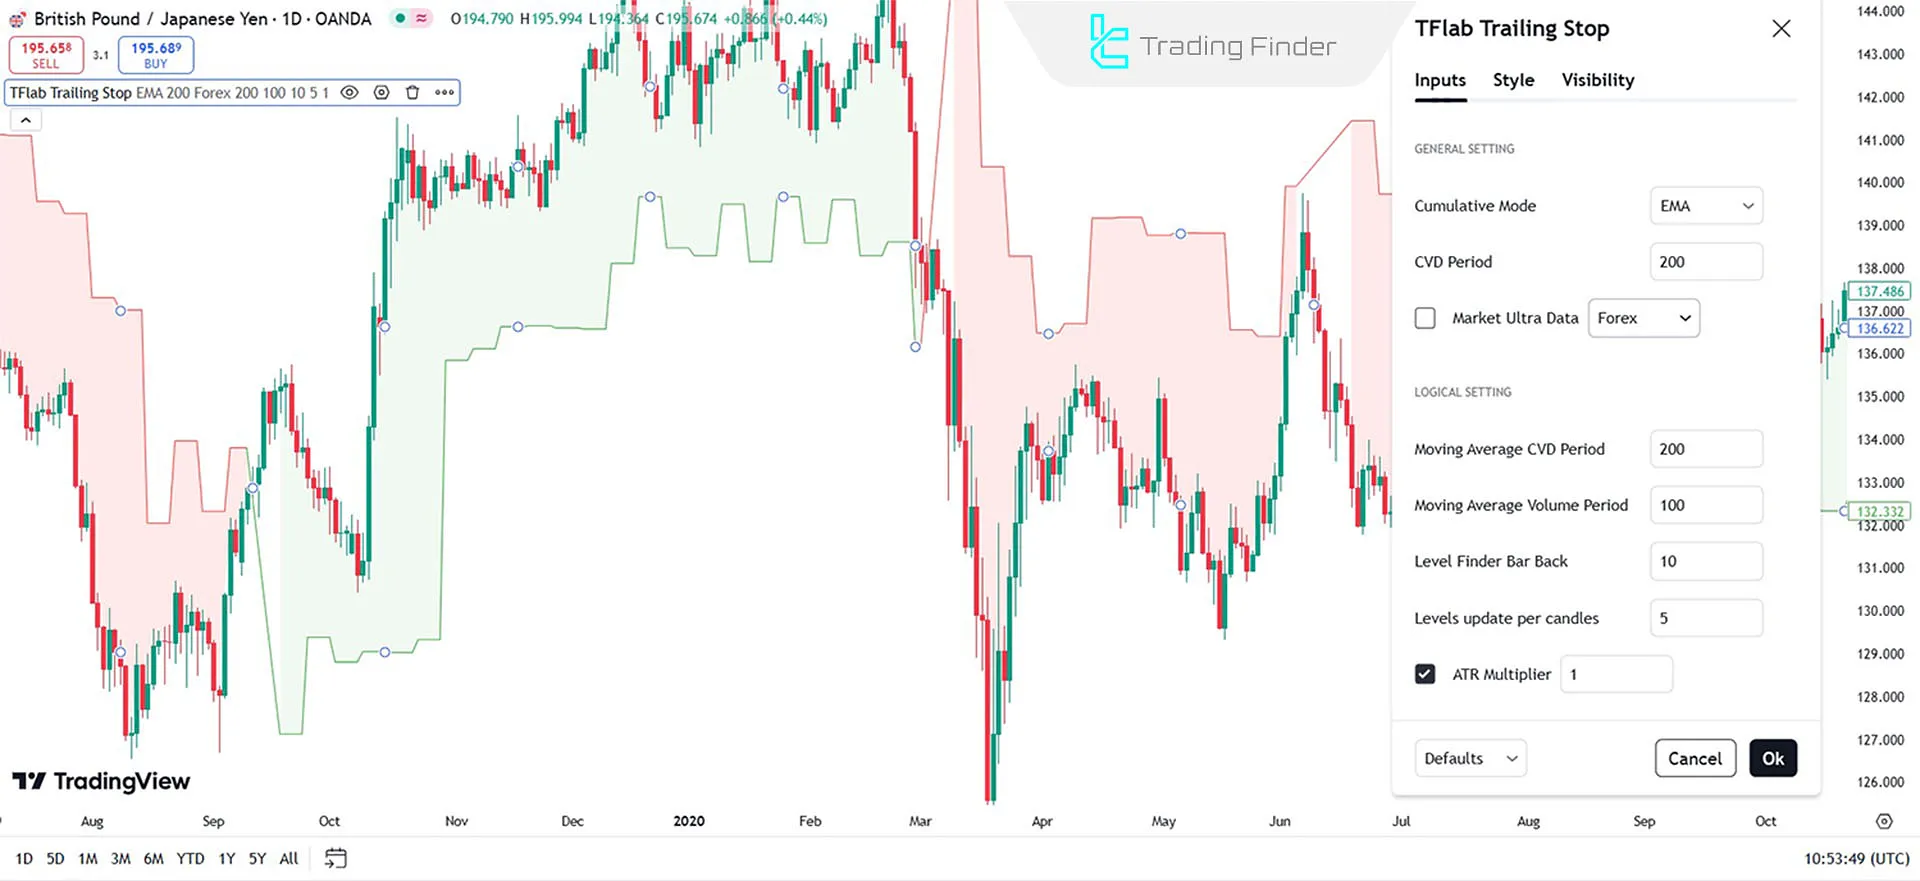
- Cumulative Mode: Calculates buy/sell volume differences in two modes;
- CVD Period: Timeframe for calculating volume delta (Default: 200);
- Market Ultra Data: Advanced display for various selected markets;
- Moving Average CVD Period: Period for the moving average of volume delta (Default: 200);
- Moving Average Volume Period: Period for the moving average of trade volumes (Default: 100);
- Level Finder Bar Back: Number of past candles for level detection (Default: 10);
- Levels Update per Candle: Updates levels after each candle (Default: 5);
- ATR Multiplier: Multiplier for average true range calculation (Default: 1).
Canclusion
The Trailing Stop Loss Smart indicator is an advanced and multifunctional tool for market trend identification.
This risk management indicator integrates volume data (CVD), trend analysis, and smart trailing stop-loss settings, providing traders with an effective solution for trading strategy.
Trailing Stop Loss Smart TradingView PDF
Trailing Stop Loss Smart TradingView PDF
Click to download Trailing Stop Loss Smart TradingView PDFWhat is the Trailing Stop Loss Smart Indicator?
The Trailing Stop Loss Smart Indicator is an advanced technical analysis tool designed for risk management and market trend identification.
Can this indicator be used in range-bound markets?
Yes, this indicator can assist in managing trades in range-bound markets by utilizing trailing stop-loss settings in addition to identifying uptrend and downtrend patterns.


