


TradingView
MetaTrader4
MetaTrader5
The True Breakout Pattern indicator is designed to identify false breakouts and issue buy/sell signals on TradingView.
It is developed based on Inner Circle Trader (ICT) and Smart Money concepts and facilitates the identification of potential price reversal zones.
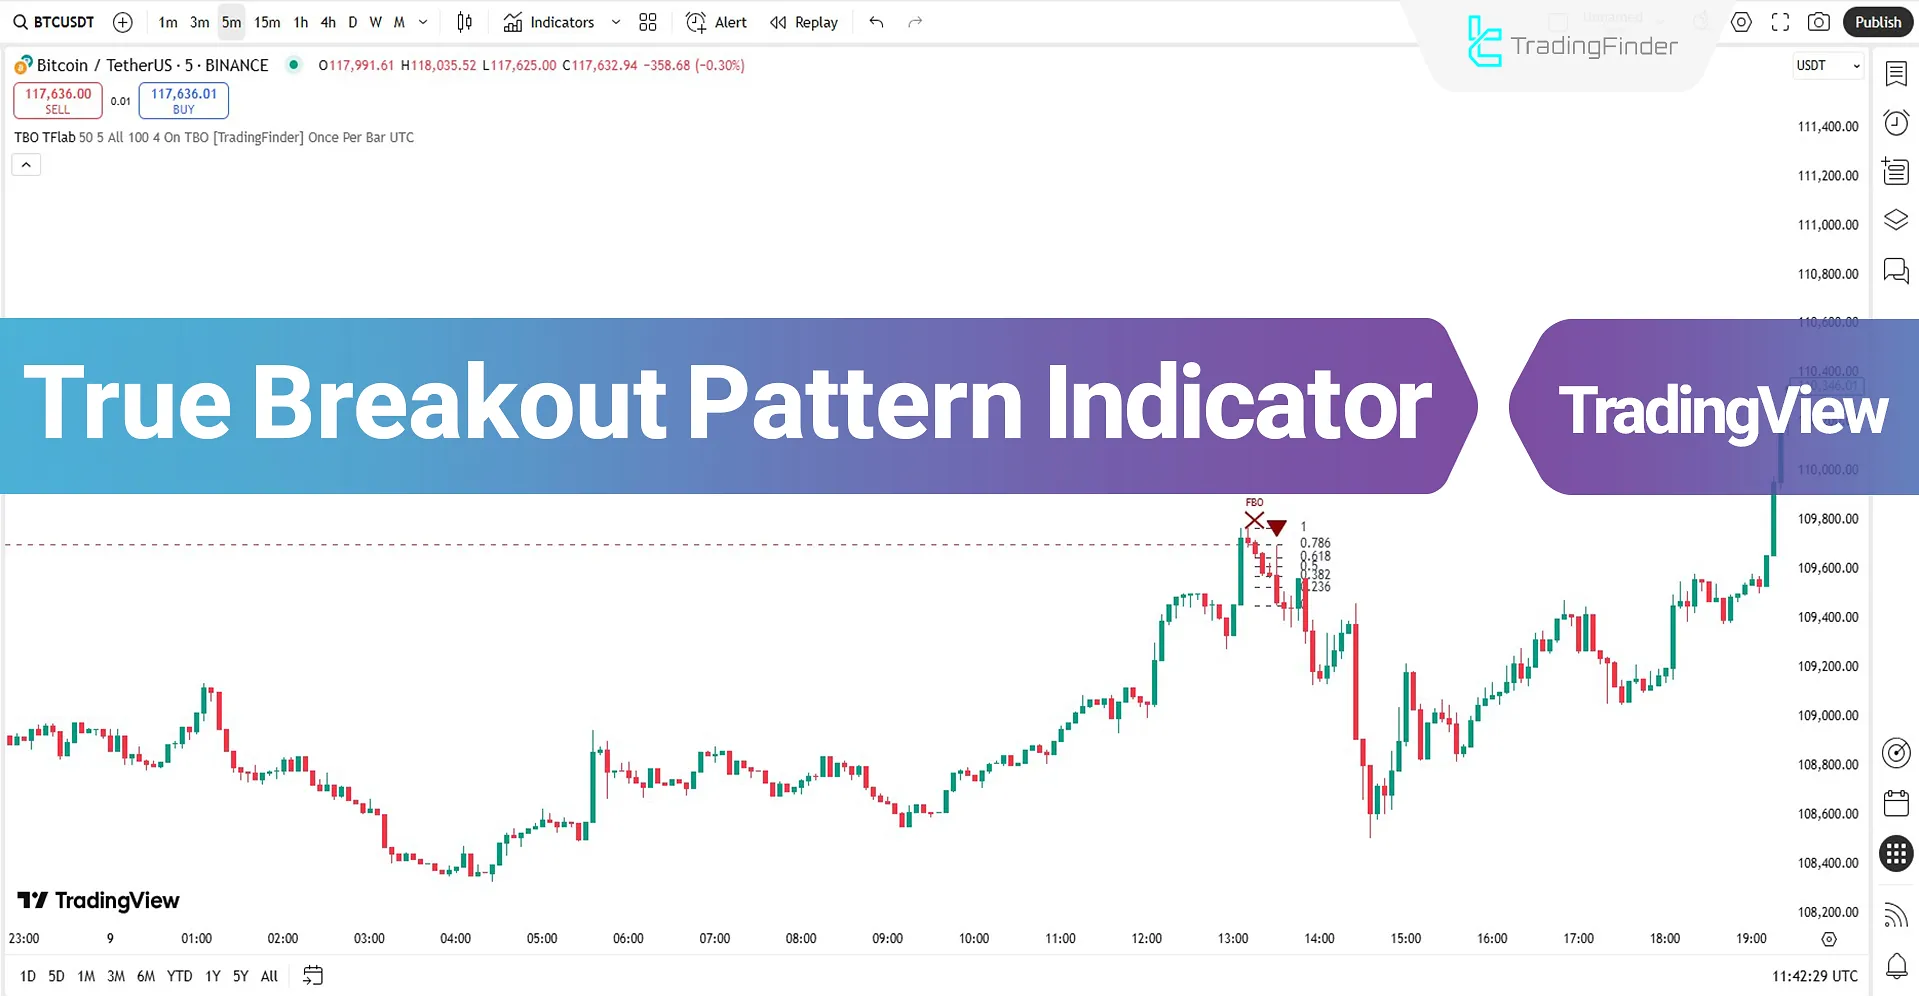
This trading tool issues signals at liquidity hunting zones using colored arrows: green for buy signals and red for sell signals, depending on the situation.
Specifications of the True Breakout Pattern Indicator
The table below outlines the specifications of the True Breakout Pattern indicator.
Indicator Categories: | ICT Tradingview Indicators Smart Money Tradingview Indicators Liquidity Tradingview Indicators |
Platforms: | Trading View Indicators |
Trading Skills: | Intermediate |
Indicator Types: | Reversal Tradingview Indicators Breakout Tradingview Indicators |
Timeframe: | Multi-Timeframe Tradingview Indicators |
Trading Style: | Day Trading Tradingview Indicators Scalper Tradingview Indicators Swing Trading Tradingview Indicators |
Trading Instruments: | TradingView Indicators in the Forex Market Cryptocurrency Tradingview Indicators Stock Tradingview Indicators |
True Breakout Pattern at a Glance
The True Breakout Pattern indicator first detects swing highs and lows and marks them as key support and resistance levels. If the price returns inside the zone within five candles after breaching a level, the breakout is considered false.
Subsequently, if the price retraces back to the 0.618, 1.0 Fibonacci levels, the indicator generates entry signals.
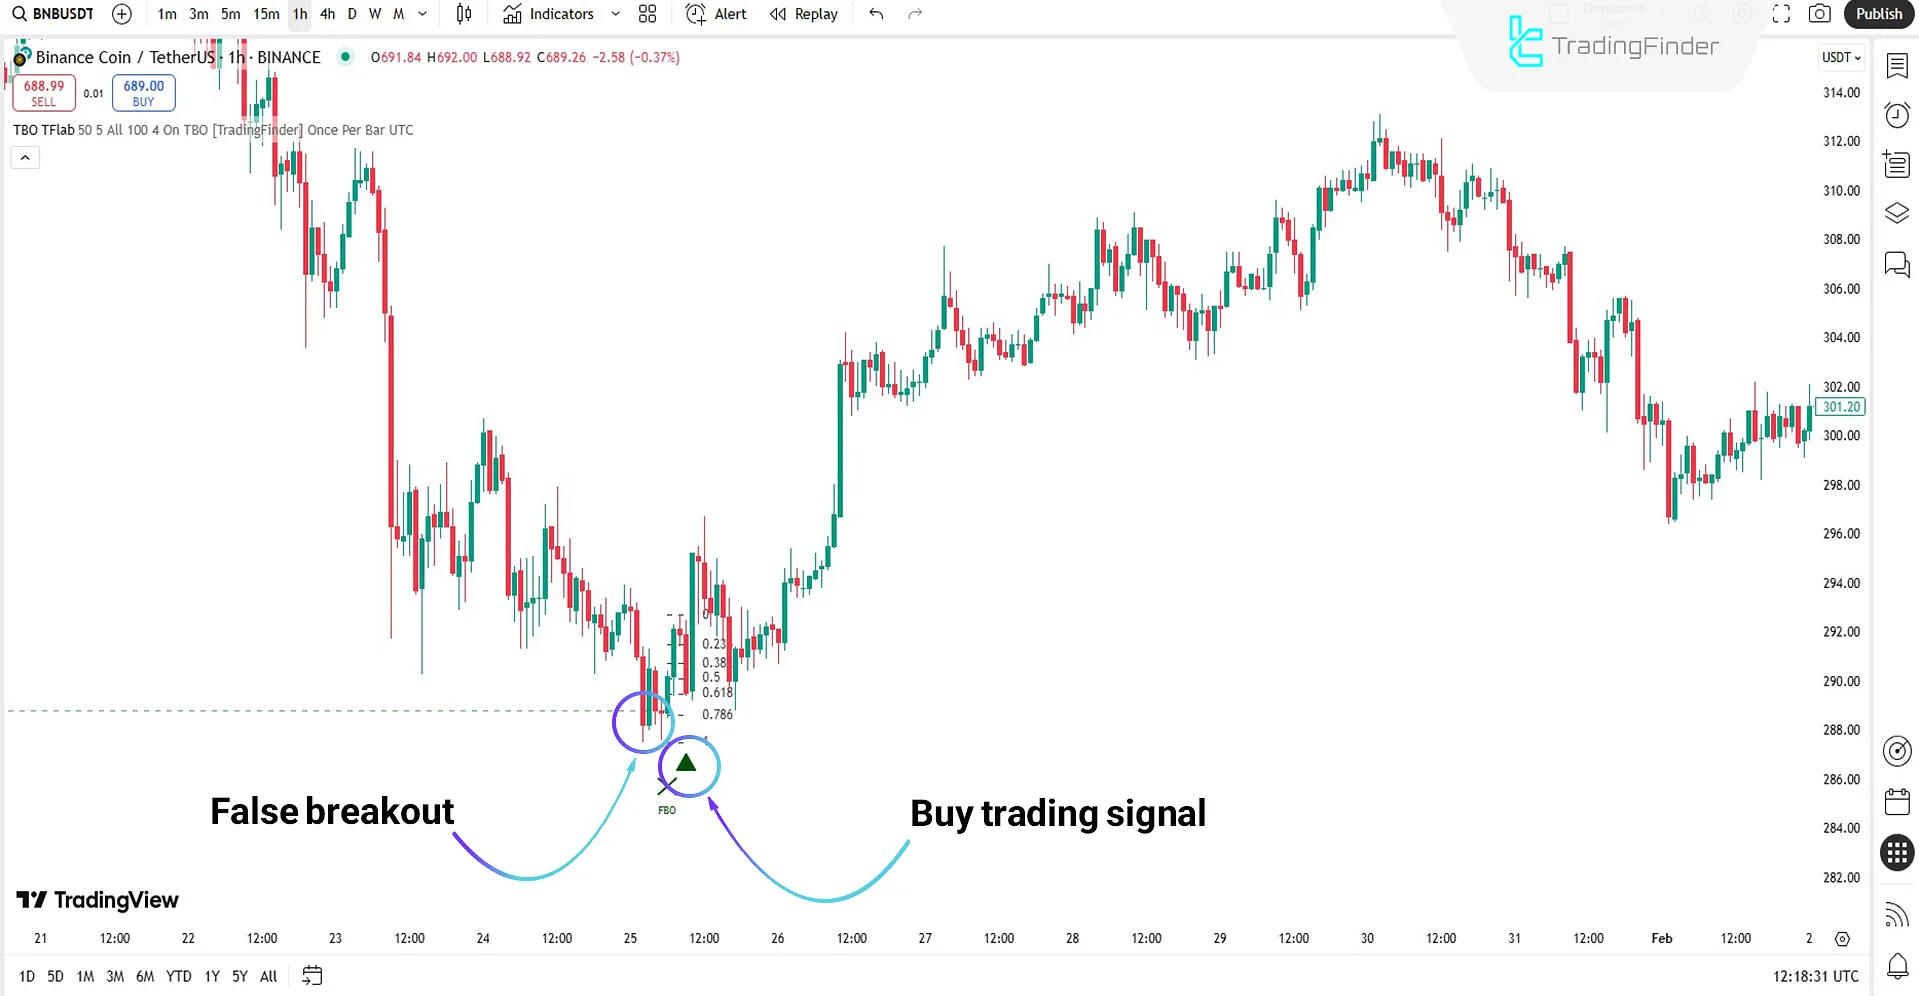
Buy Signal
Based on the Binance Coin (BNB) chart in the 1-hour timeframe, the price initially breaks below a swing low but quickly returns above the level and enters the Fibonacci retracement zone.
As shown in the chart, once these conditions are confirmed, a buy signal is issued, and the price strongly enters a bullish trend.
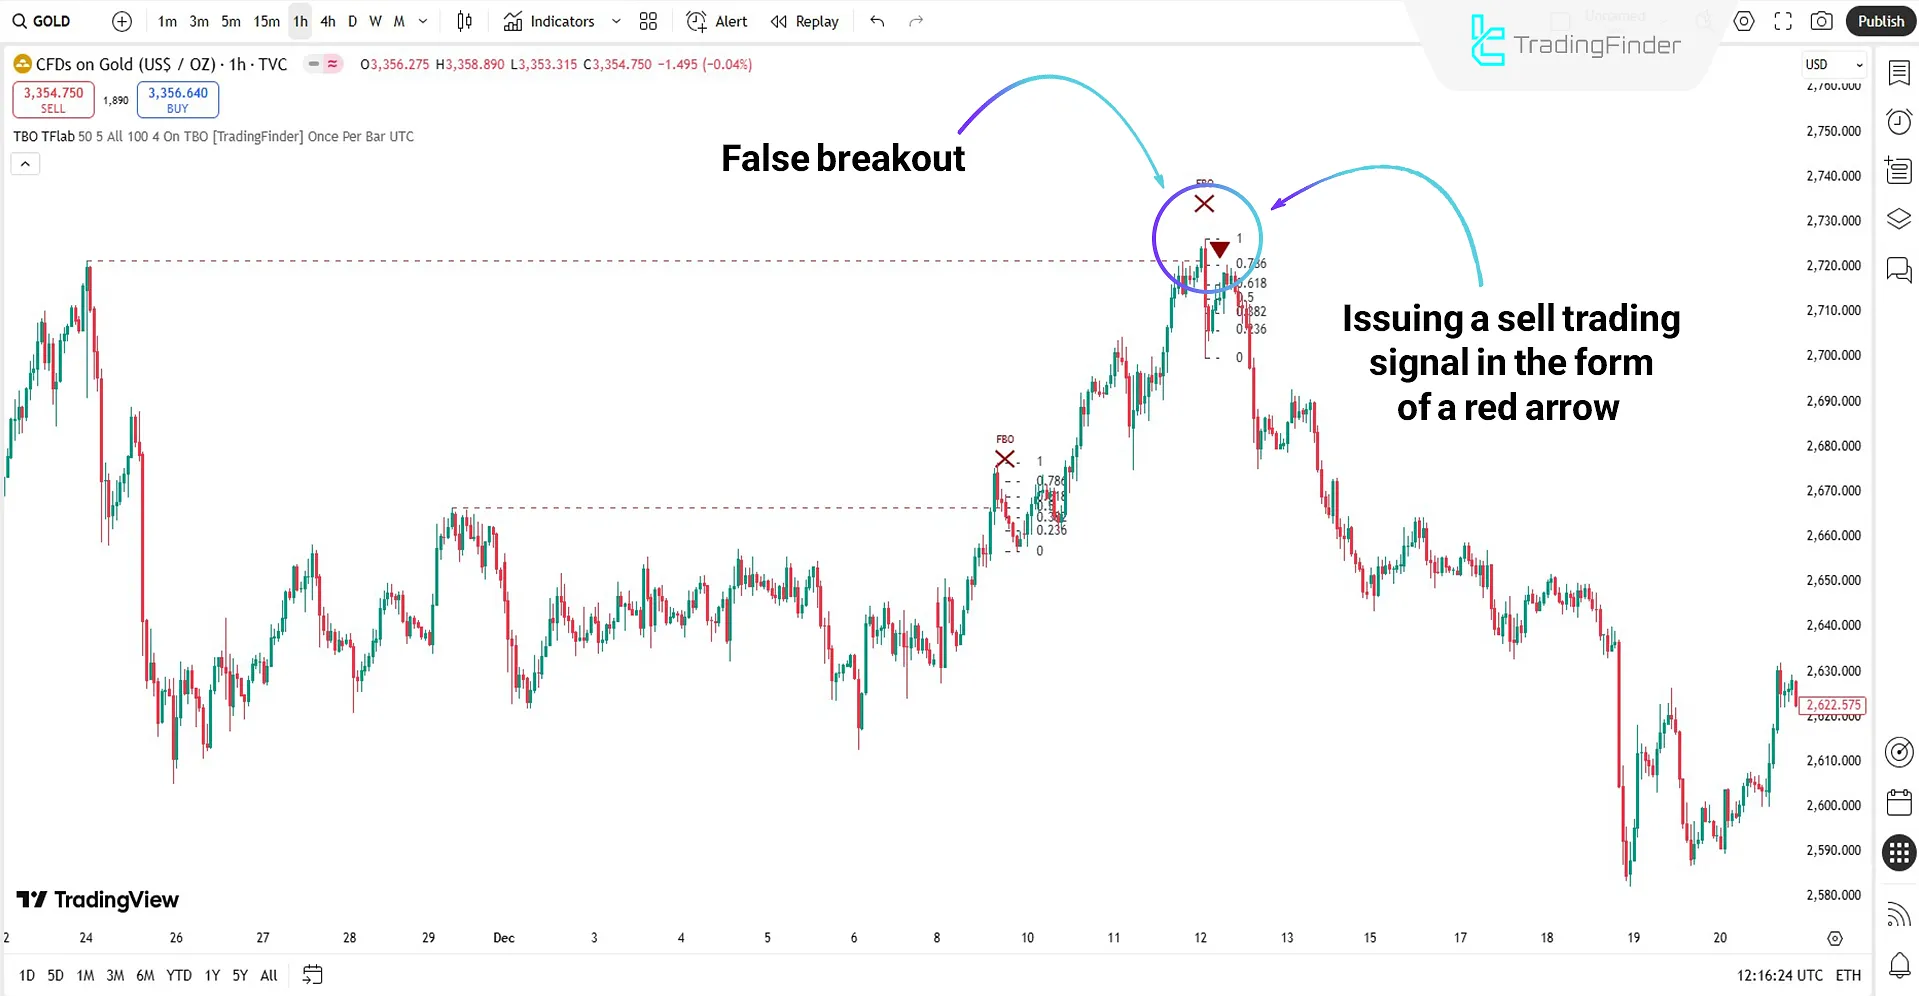
Sell Signal
According to the Gold chart analysis in the 1-hour timeframe, the price falsely breaks a swing high but swiftly returns below.
Under these circumstances, a retracement to the 0.618–1.0 Fibonacci levels confirms the bearish trend, prompting the indicator to issue a sell-entry signal.
True Breakout Pattern Indicator Settings
The settings section of the True Breakout Pattern indicator is described as follows:
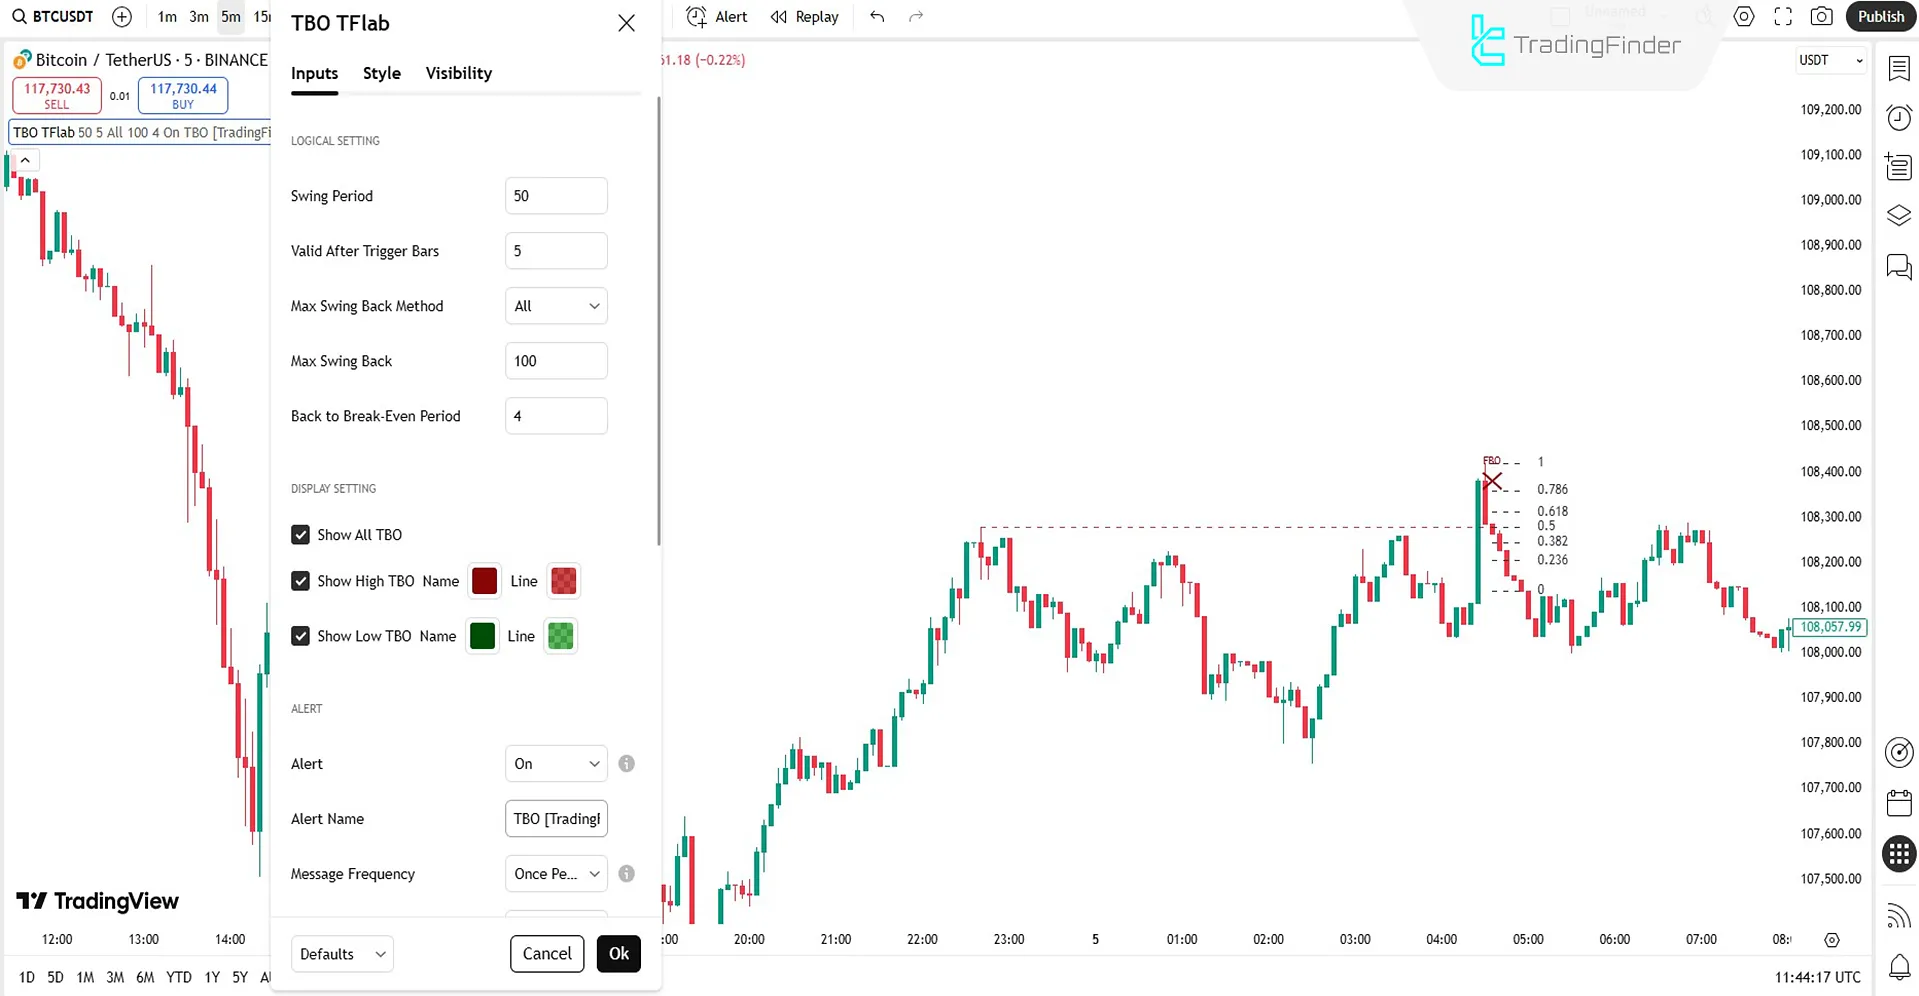
Logical Setting
- Swing Period: Time range for detecting swing highs and lows
- Valid After Trigger Bars: Maximum number of candles for the breakout to remain valid after price return
- Max Swing Back Method: Method to scan all past swings to identify structural levels
- Max Swing Back: Number of previous swings to analyze
- Back to Break-Even Period: Period for the price to return to the breakout level
Display Setting
- Show All TBO: Show all valid and invalid breakout patterns on the chart
- Show High TBO (Name / Line): Display false breakouts at highs with labels and lines
- Show Low TBO (Name / Line): Display false breakouts at lows with labels and lines
Alert Setting
- Alert: Enable trading alerts from the indicator
- Alert Name: Title of the alerts triggered during setup
- Message Frequency: Send alert only once per candle
Conclusion
The True Breakout Pattern indicator combines false breakout detection with Fibonacci retracement analysis to act as a precise tool for filtering out misleading price movements.
Its flexible settings allow for detailed behavior control. The visual simplicity and automated alerts make decision-making easier for traders.
This tool is usable in all markets, including cryptocurrency, stocks, forex market, and commodities, and significantly improves entry accuracy while reducing trading risk.
True Breakout Pattern To TradingView PDF
True Breakout Pattern To TradingView PDF
Click to download True Breakout Pattern To TradingView PDFWhich timeframes are suitable for the True Breakout Pattern indicator?
This is a multi-time frame indicator and can be used on all timeframes.
What does "FBO" mean on the chart?
"FBO" stands for False Breakout, which the indicator is designed to detect.


