![3 Bars High Low indicator for MT4 Download - Free - [TradingFinder]](https://cdn.tradingfinder.com/image/179607/13-53-fa-3-bars-high-low-mt4-1.webp)
![3 Bars High Low indicator for MT4 Download - Free - [TradingFinder] 0](https://cdn.tradingfinder.com/image/179607/13-53-fa-3-bars-high-low-mt4-1.webp)
![3 Bars High Low indicator for MT4 Download - Free - [TradingFinder] 1](https://cdn.tradingfinder.com/image/179615/13-53-fa-3-bars-high-low-mt4-2.webp)
![3 Bars High Low indicator for MT4 Download - Free - [TradingFinder] 2](https://cdn.tradingfinder.com/image/179614/13-53-fa-3-bars-high-low-mt4-3.webp)
![3 Bars High Low indicator for MT4 Download - Free - [TradingFinder] 3](https://cdn.tradingfinder.com/image/179618/13-53-fa-3-bars-high-low-mt4-4.webp)
The3 Bars High Low Indicator combines the Commodity Channel Index (CCI) and the Average True Range (ATR) to display the trend direction using a Dynamic Line.
The positioning of candlesticks relative to the indicator line determines whether the trend is bullish or bearish.
The "3 Bars High Low" indicator is one of the MetaTrader 4 indicators and, in addition to the dynamic line, plots Williams Fractal points as colored dots around the price.
3 Bars High Low Indicator Specifications
Some of the features and specifications of the indicator are outlined in the table below:
Indicator Categories: | Support & Resistance MT4 Indicators Trading Assist MT4 Indicators Levels MT4 Indicators |
Platforms: | MetaTrader 4 Indicators |
Trading Skills: | Intermediate |
Indicator Types: | Reversal MT4 Indicators |
Timeframe: | Multi-Timeframe MT4 Indicators |
Trading Style: | Intraday MT4 Indicators |
Trading Instruments: | Share Stocks MT4 Indicators Forward Market MT4 Indicators Stock Market MT4 Indicators Cryptocurrency MT4 Indicators Forex MT4 Indicators |
Overview of the Indicator 3 Bars High Low
When the price crosses the indicator line, the Dynamic Line's color changes based on the trend direction (bullish or bearish), which can be considered as an entry signal. Consecutive formations of Williams Fractal Points in one direction indicate a continuation of the trend.
Indicator Performance in an Uptrend
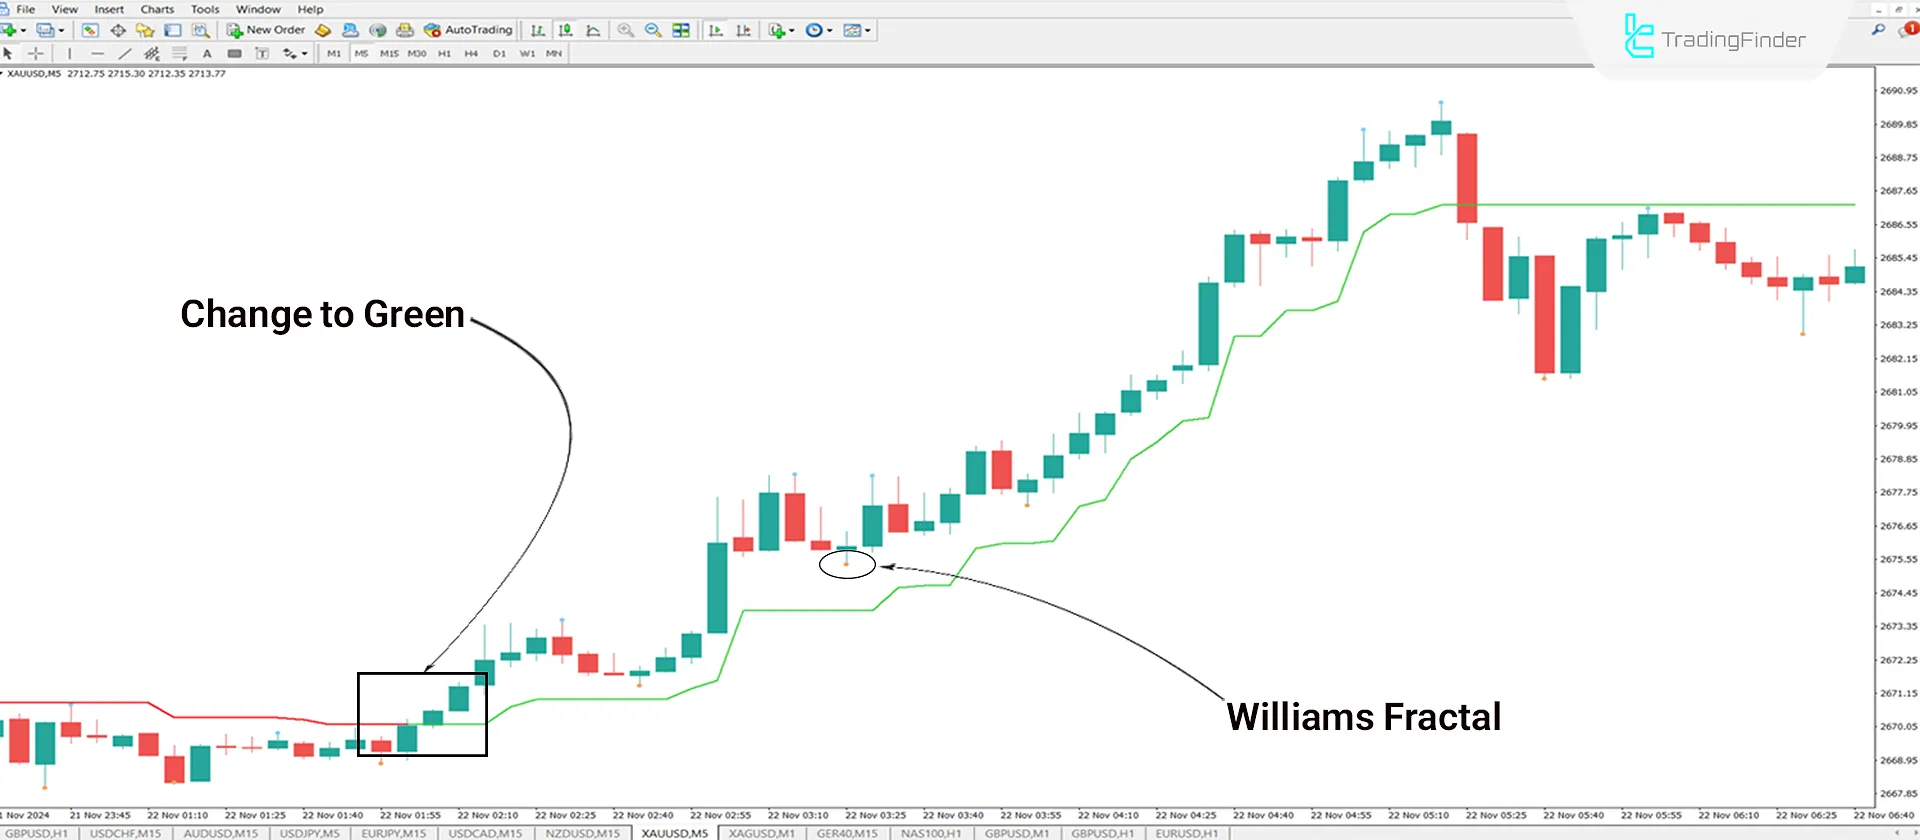
As illustrated below, the price crossing the indicator line is highlighted by a box. When the price breaks above the indicator line, the line color changes from red to green, signaling a potential Buy entry.
The colored markers above or below the candles are Williams Fractal Points.

Indicator Performance in a Downtrend
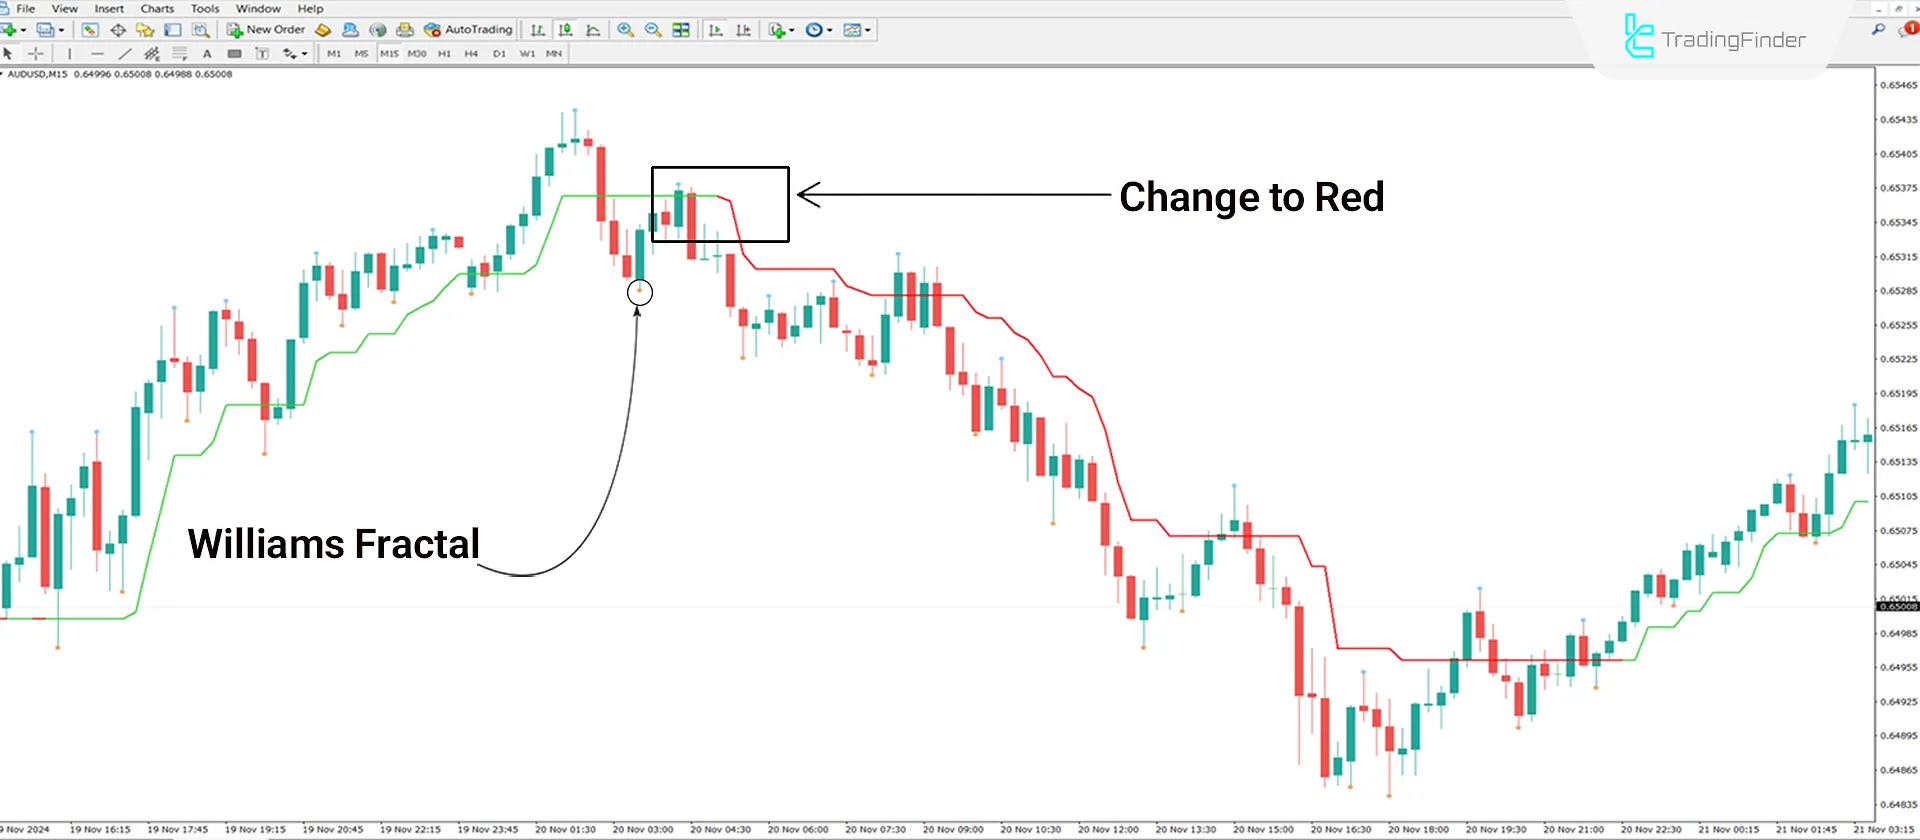
In the analysis of the AUD/USD pair on a 15 minute timeframe, the price broke below the indicator line, and the line’s color changed to red.
As long as the price moves below the indicator line and Williams Fractal Points form consecutively, the downtrend continues.

Indicator Settings
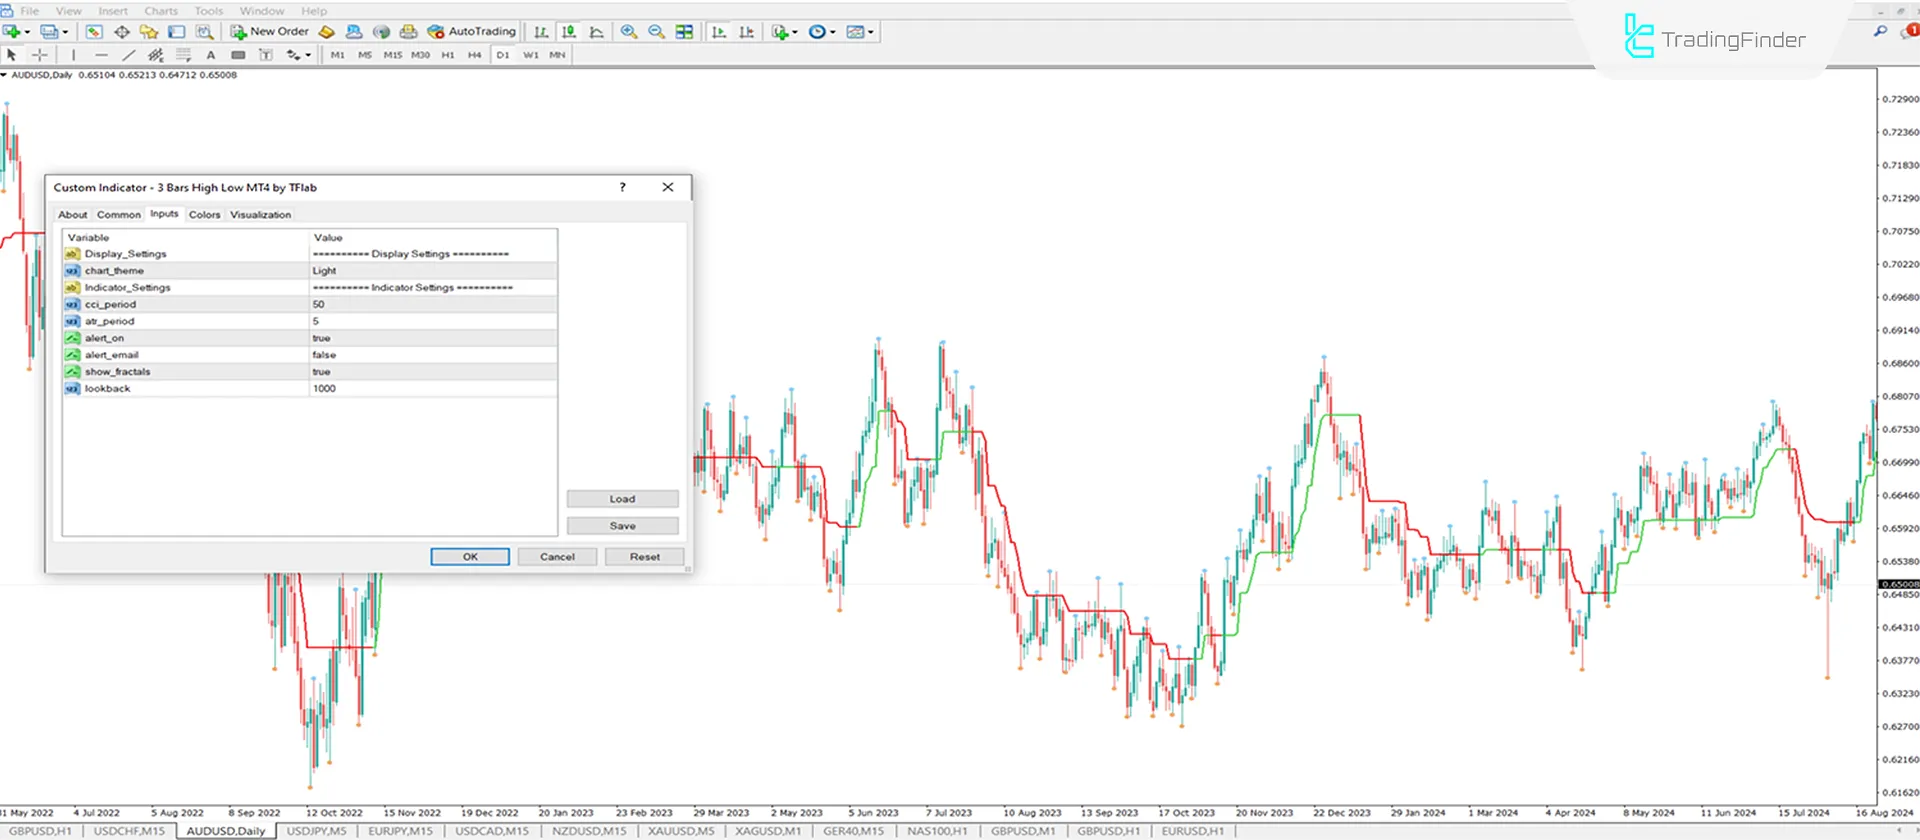
All parameters and settings of the indicator can be viewed and modified in this section:

- Chart Theme: Theme customization for the indicator;
- CCI Period: Set CCI period to 50;
- ATR Period: Set ATR period to 5;
- Alert On: Enable trend change alerts;
- Alert Email: Send alerts via email;
- Show Fractals: Display fractals on the chart;
- Lookback: Number of candles used for calculation, default is 500.
Conclusion
The 3 Bars High Low Indicator plots a Dynamic Line that identifies price fluctuations without noise. The tool changes color based on the trend direction.
The positioning and crossing of the price relative to the indicator line determine the trend direction and can also act as an entry signal. The "3 Bars High Low" is also considered a Levels Indicators tool for creating support and resistance levels and zones.
3 Bars High Low MT4 PDF
3 Bars High Low MT4 PDF
Click to download 3 Bars High Low MT4 PDFDoes this indicator work in cryptocurrency markets?
Yes, this indicator performs effectively across all markets.
Does this indicator generate entry signals?
While this indicator does not explicitly issue trading signals, the price crossing the indicator line can be considered an entry signal.


