![AMDX/XAMD Indicator ICT Style for MT4 Download - Free - [TFlab]](https://cdn.tradingfinder.com/image/248483/13-73-en-amdx-xamd-mt4-01.webp)
![AMDX/XAMD Indicator ICT Style for MT4 Download - Free - [TFlab] 0](https://cdn.tradingfinder.com/image/248483/13-73-en-amdx-xamd-mt4-01.webp)
![AMDX/XAMD Indicator ICT Style for MT4 Download - Free - [TFlab] 1](https://cdn.tradingfinder.com/image/248496/13-73-en-amdx-xamd-mt4-02.webp)
![AMDX/XAMD Indicator ICT Style for MT4 Download - Free - [TFlab] 2](https://cdn.tradingfinder.com/image/248495/13-73-en-amdx-xamd-mt4-03.webp)
![AMDX/XAMD Indicator ICT Style for MT4 Download - Free - [TFlab] 3](https://cdn.tradingfinder.com/image/248517/13-73-en-amdx-xamd-mt4-04.webp)
The (AMDX/XAMD ICT) indicator is one of the ICT indicators designed to identify potential trend movements.
This indicator, based on the power of three Strategy, uses colored boxes to classify price trend movements into three phases Accumulation (red box), Distribution (blue box), and Manipulation (green box).
Unlike the AMD ICT indicator for MT4, it also includes a phase indicating continuation or reversal (X).
AMDX/XAMD Indicator Specifications Table
The following table outlines the specifications of the AMDX/XAMD indicator.
Indicator Categories: | ICT MT4 Indicators Smart Money MT4 Indicators Liquidity MT4 Indicators |
Platforms: | MetaTrader 4 Indicators |
Trading Skills: | Advanced |
Indicator Types: | Reversal MT4 Indicators |
Timeframe: | Multi-Timeframe MT4 Indicators |
Trading Style: | Day Trading MT4 Indicators Intraday MT4 Indicators Scalper MT4 Indicators Swing Trading MT4 Indicators |
Trading Instruments: | Commodity Market MT4 Indicators Stock Market MT4 Indicators Cryptocurrency MT4 Indicators Forex MT4 Indicators |
Indicator at a Glance
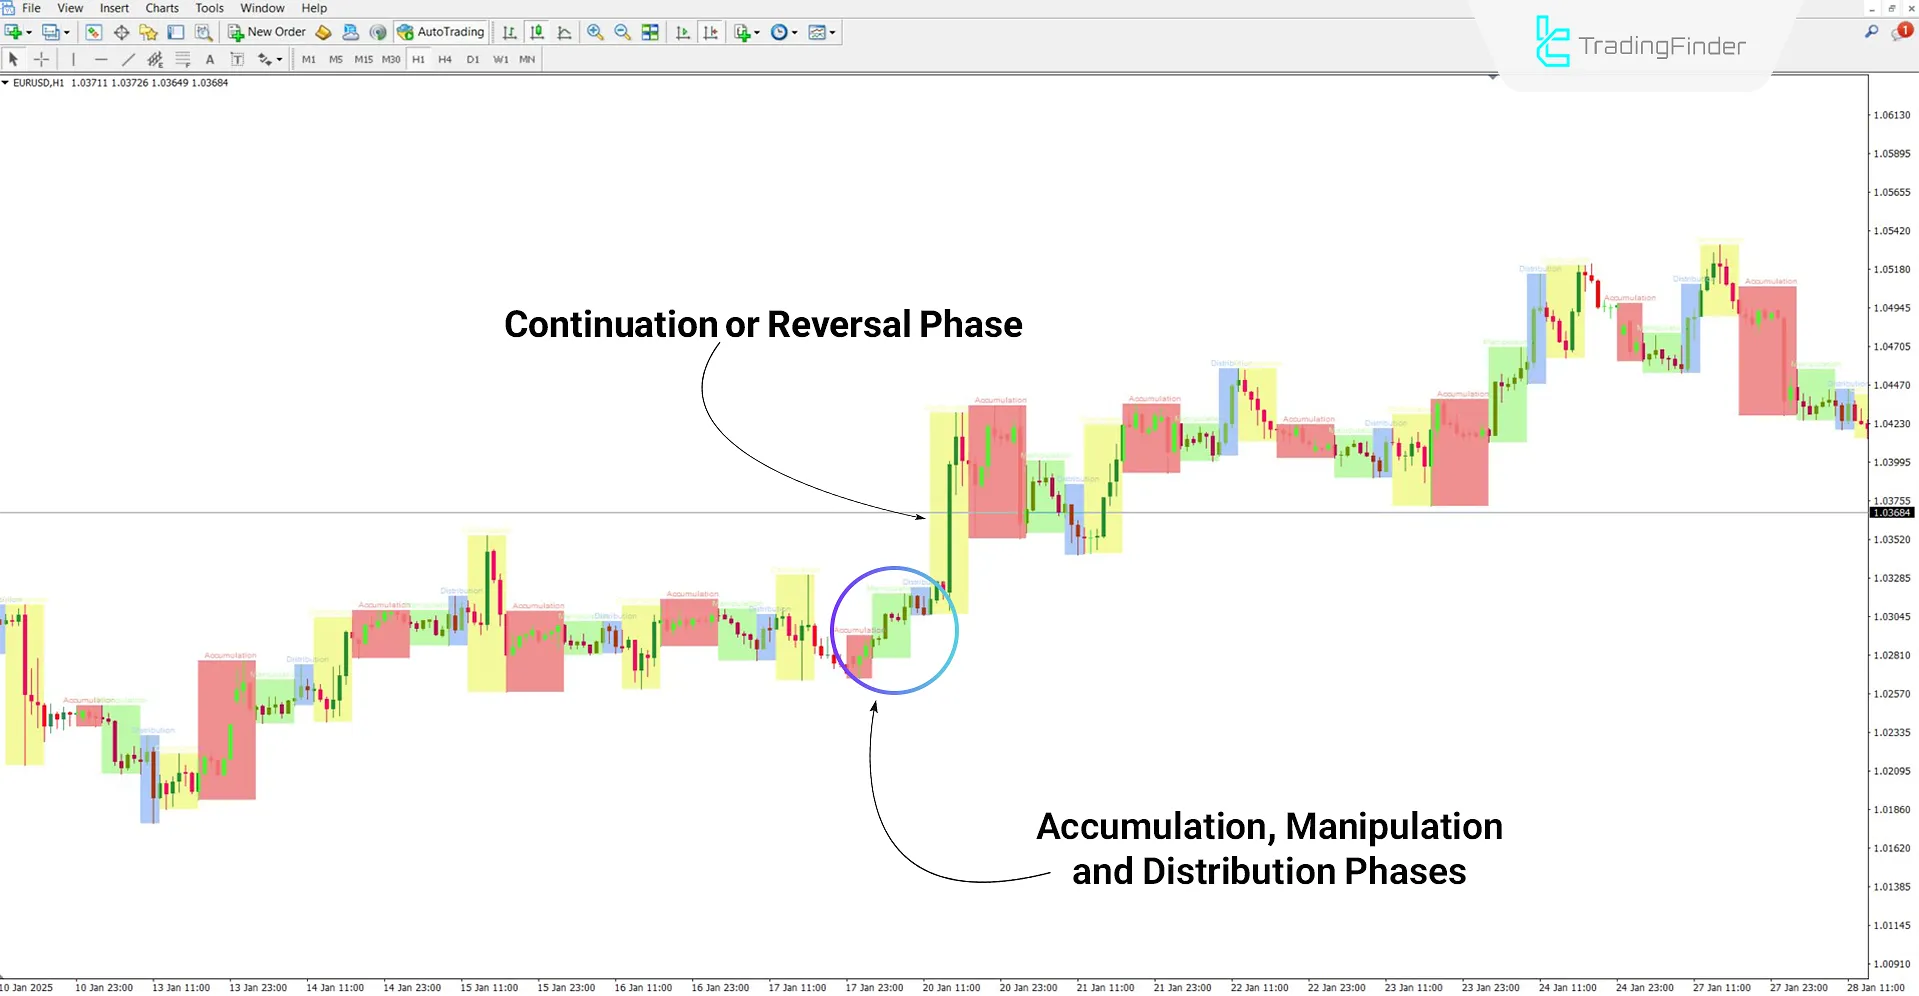
A yellow box represents the continuation or reversal (X) phase in this trading tool. Depending on user selection, this phase can be formed at the beginning or the end of time cycles. Depending on market conditions and trend movements, the X zone can act as a reversal or continuation area.
Bullish Trend Conditions
Based on the EUR/USD hourly chart, bullish trend signs appear through the three phases of accumulation, manipulation, and distribution, upon reaching the continuation or reversal phase (yellow box), buying pressure increases, pushing the price towards higher targets.
In the following example, the time cycle sequence is "AMDX," meaning the continuation or reversal phase (X) forms before the other three phases.

Bearish Trend Conditions
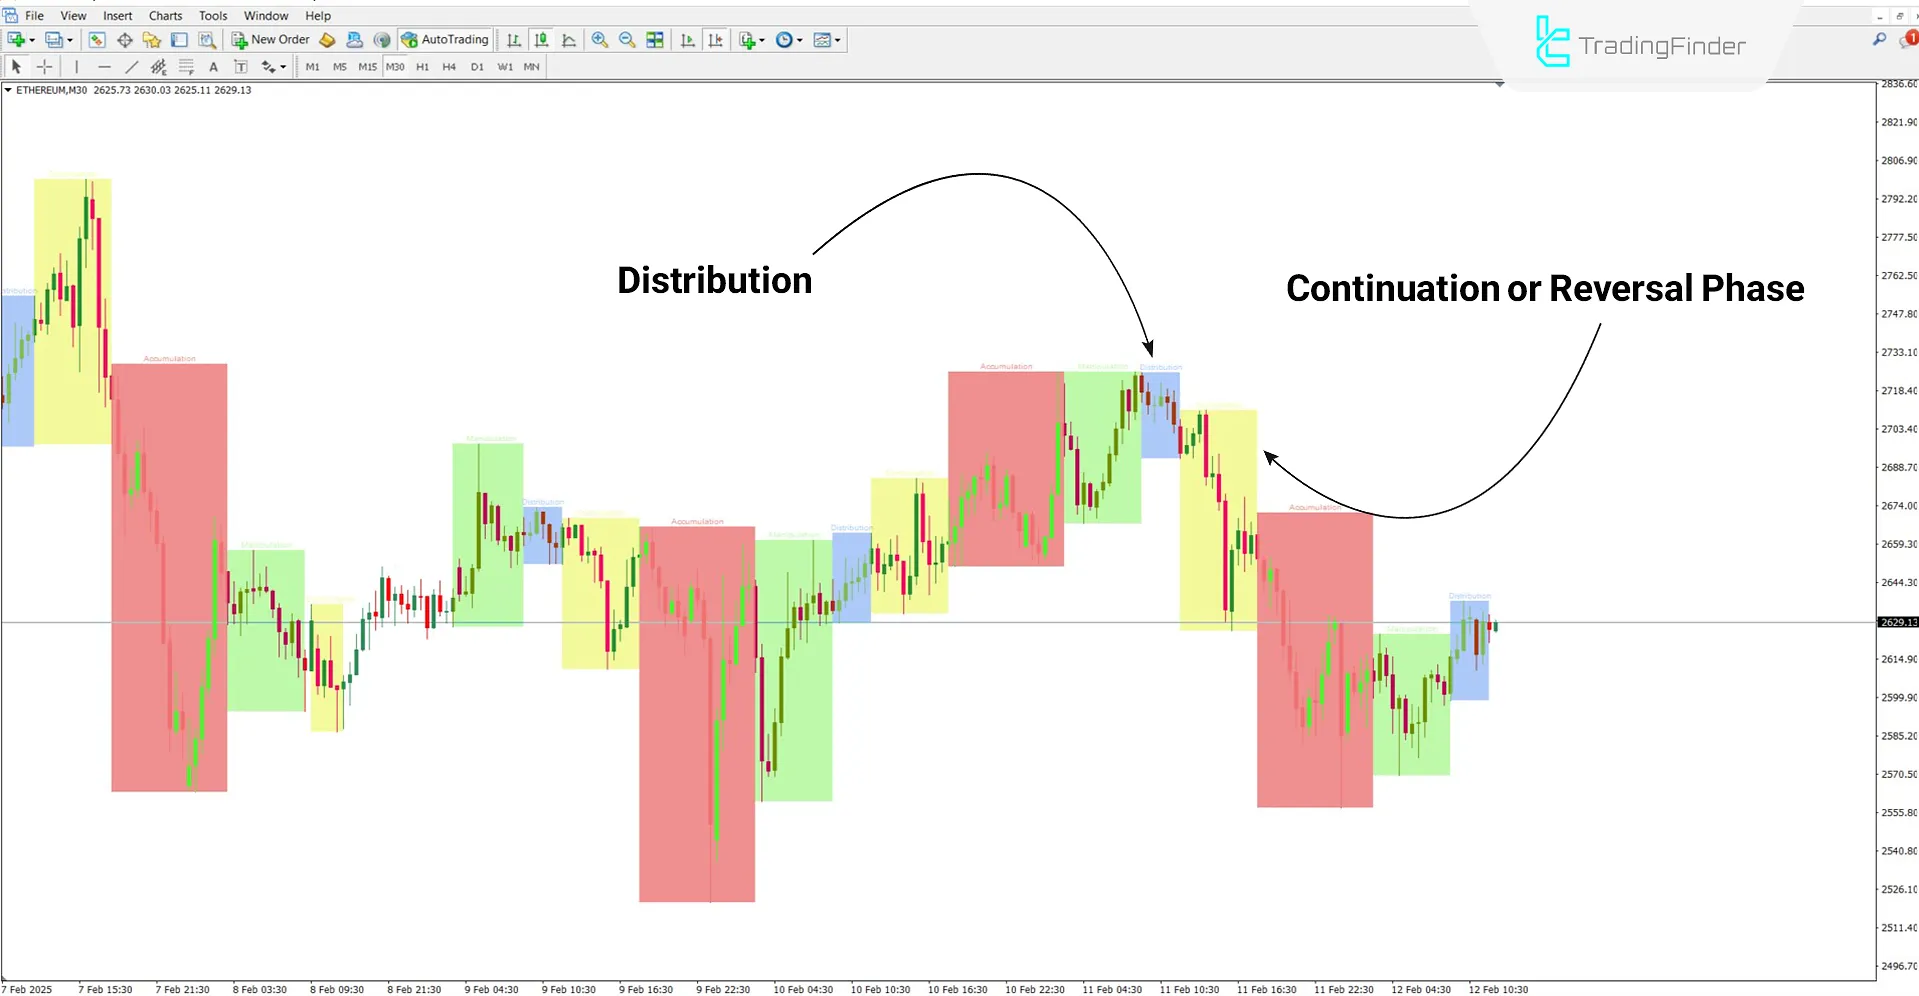
According to the 30-minute Ethereum (ETH) chart analysis, the price moves upward during the manipulation phase after a ranging movement in the accumulation phase (red box).
In the distribution phase (blue box), the trend turns bearish, and upon entering the continuation or reversal phase (X), the bearish trend is confirmed.

AMDX/XAMD Indicator Settings
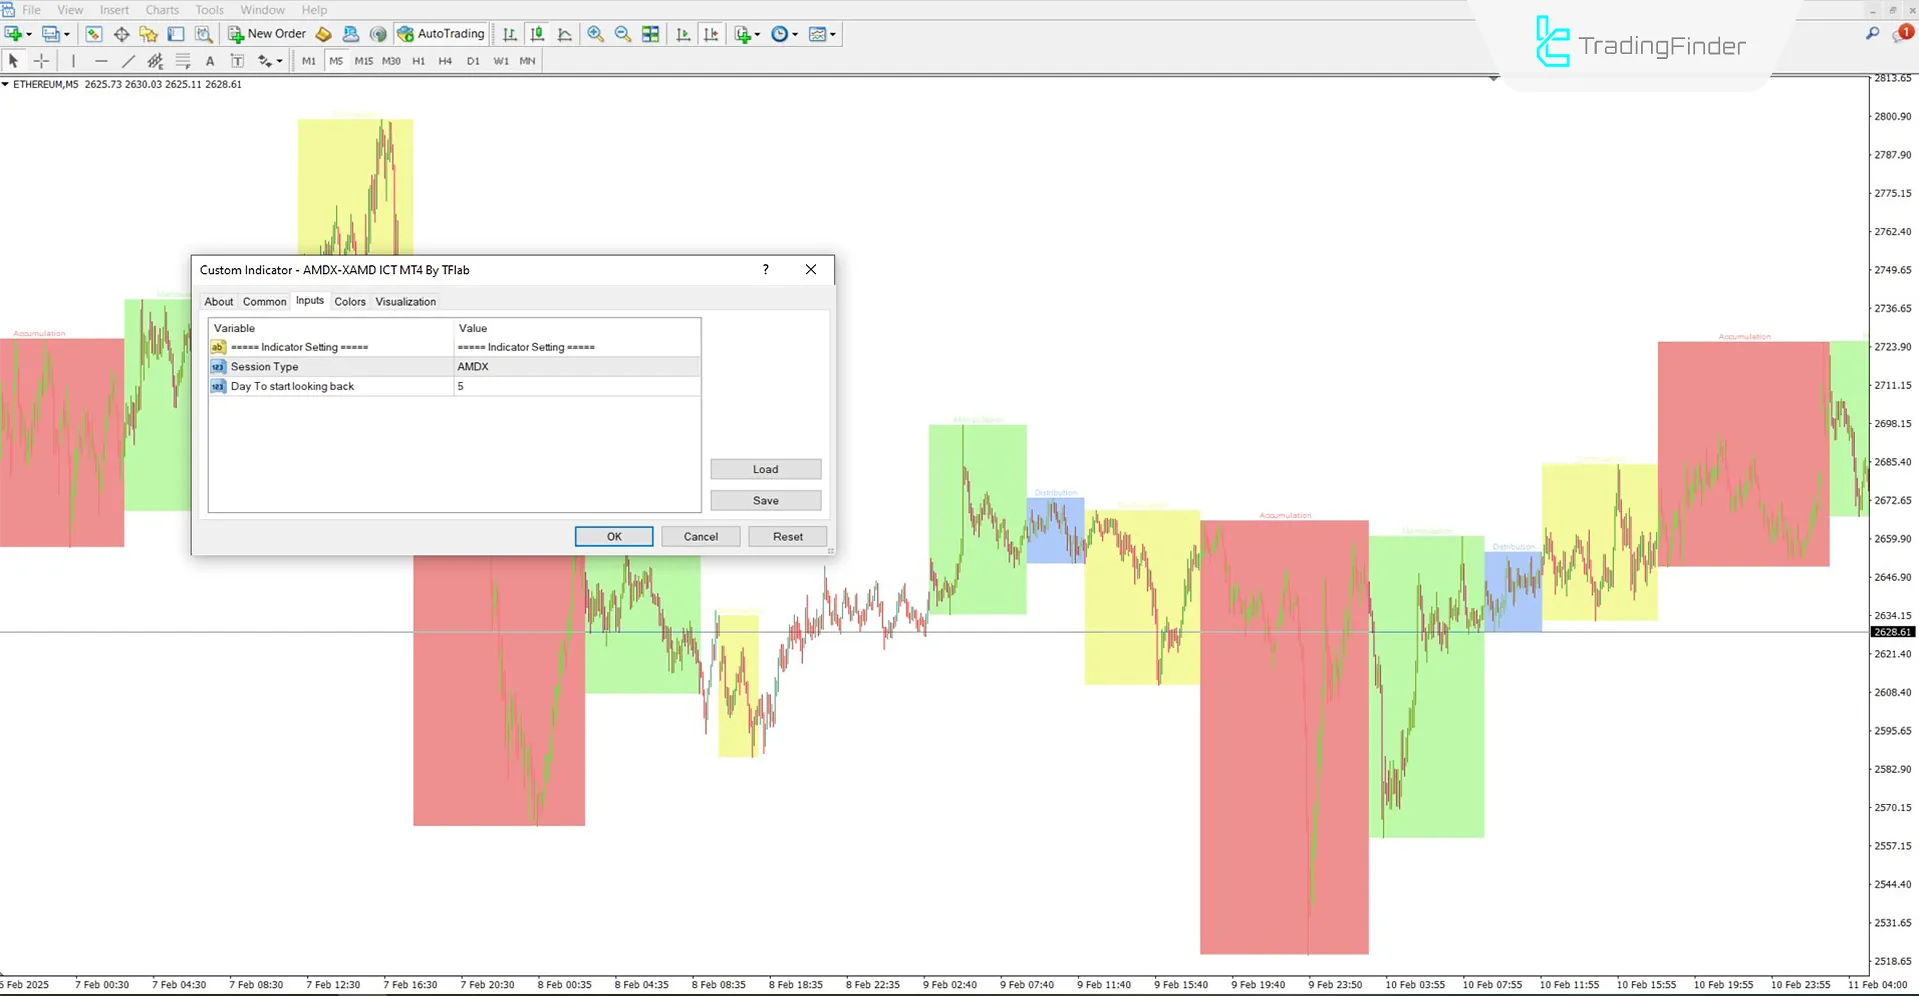
The following are the AMDX/XAMD cycle indicator settings:

- Session Type: Select session type between "AMDX" and "XAMD"
- Day to start looking back: Set the number of days for indicator calculations
Conclusion
The "AMDX/XAMD" cycle indicator is a liquidity indicator that uses colored boxes to identify trend movements.
This indicator is designed based on the ICT trading style and divides the price trend into three phases Accumulation (red box), Distribution (blue box), and Manipulation (green box).
Unlike the "AMD" version, it also displays an additional continuation or reversal (X) phase with a yellow box.
The continuation or reversal (X) zone can indicate either trend continuation or reversal, depending on market conditions.
AMDX/XAMD ICT MT4 PDF
AMDX/XAMD ICT MT4 PDF
Click to download AMDX/XAMD ICT MT4 PDFWhat is the difference between the (AMDX) and (AMD) indicators?
This indicator displays the continuation or reversal phase and the accumulation, manipulation, and distribution trading sessions.
Who is this indicator suitable for?
Traders operating on intraday timeframes with trading styles based on Smart Money or ICT.


