![ATR Levels Indicator (ATRL) for Download MetaTrader 4 - Free [TFlab]](https://cdn.tradingfinder.com/image/235848/11-11-en-atr-levels-mt4-01.webp)
![ATR Levels Indicator (ATRL) for Download MetaTrader 4 - Free [TFlab] 0](https://cdn.tradingfinder.com/image/235848/11-11-en-atr-levels-mt4-01.webp)
![ATR Levels Indicator (ATRL) for Download MetaTrader 4 - Free [TFlab] 1](https://cdn.tradingfinder.com/image/235850/11-11-en-atr-levels-mt4-02.webp)
![ATR Levels Indicator (ATRL) for Download MetaTrader 4 - Free [TFlab] 2](https://cdn.tradingfinder.com/image/235849/11-11-en-atr-levels-mt4-03.webp)
![ATR Levels Indicator (ATRL) for Download MetaTrader 4 - Free [TFlab] 3](https://cdn.tradingfinder.com/image/235847/11-11-en-atr-levels-mt4-04.webp)
The Average True Range Levels (ATRL) is one of the indicators in MetaTrader 4, designed to determine price levels. The ATRL Indicator is based on the 20-period daily Average True Range (ATR).
It is displayed by drawing 3 lines above and 3 lines below a central line. Traders can use these price levels as take-profit and stop-loss levels in their trades.
The central line of the indicator is calculated based on the 5-candle daily average, and the ATRL levels are updated every 4 hours.
ATRL Indicator Table
The table below contains the specifications of the indicator.
Indicator Categories: | Support & Resistance MT4 Indicators Volatility MT4 Indicators Levels MT4 Indicators |
Platforms: | MetaTrader 4 Indicators |
Trading Skills: | Elementary |
Indicator Types: | Range MT4 Indicators Breakout MT4 Indicators Lagging MT4 Indicators |
Timeframe: | M1-M5 Time MT4 Indicators M15-M30 Time MT4 Indicators H4-H1 Time MT4 Indicators |
Trading Style: | Day Trading MT4 Indicators Intraday MT4 Indicators Scalper MT4 Indicators |
Trading Instruments: | Cryptocurrency MT4 Indicators Forex MT4 Indicators |
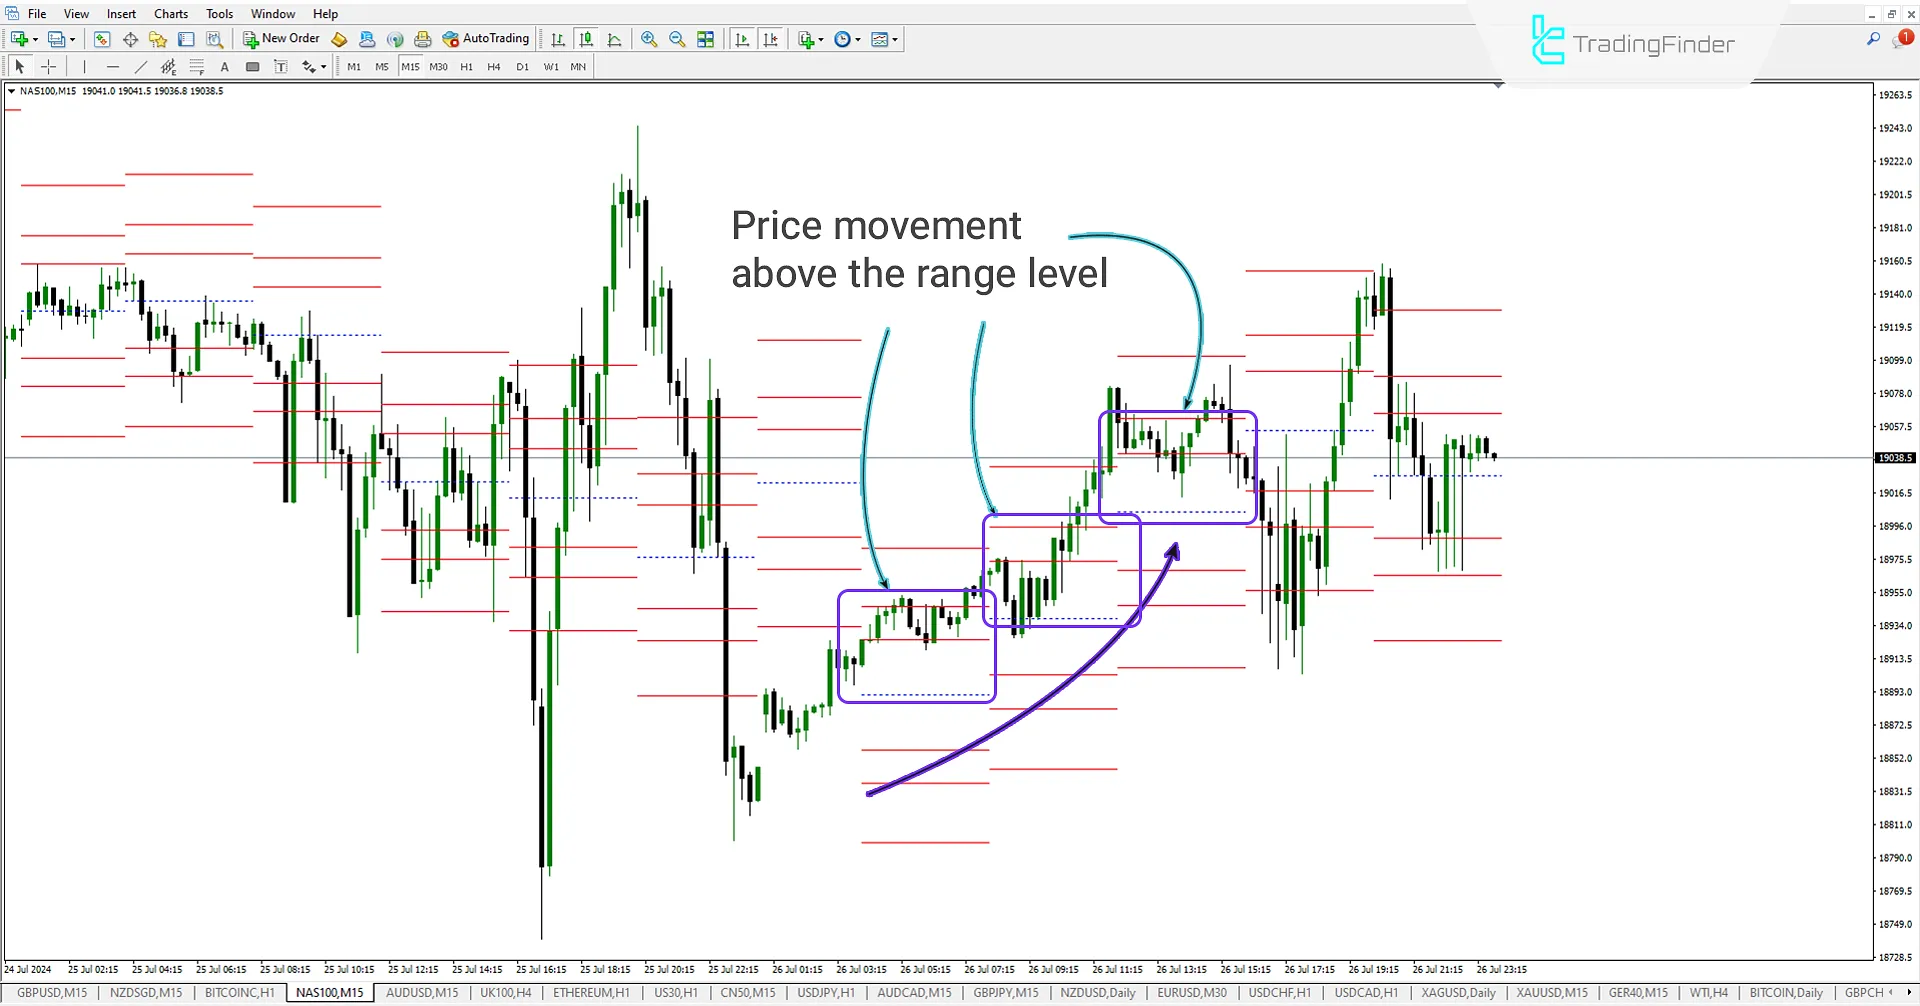
Price Movement Above the Central Level
In the 15-minute chart (NAS100), if the price moves above the central ATR level, traders can use the higher levels as target points for their trades and set their Take Profit accordingly.

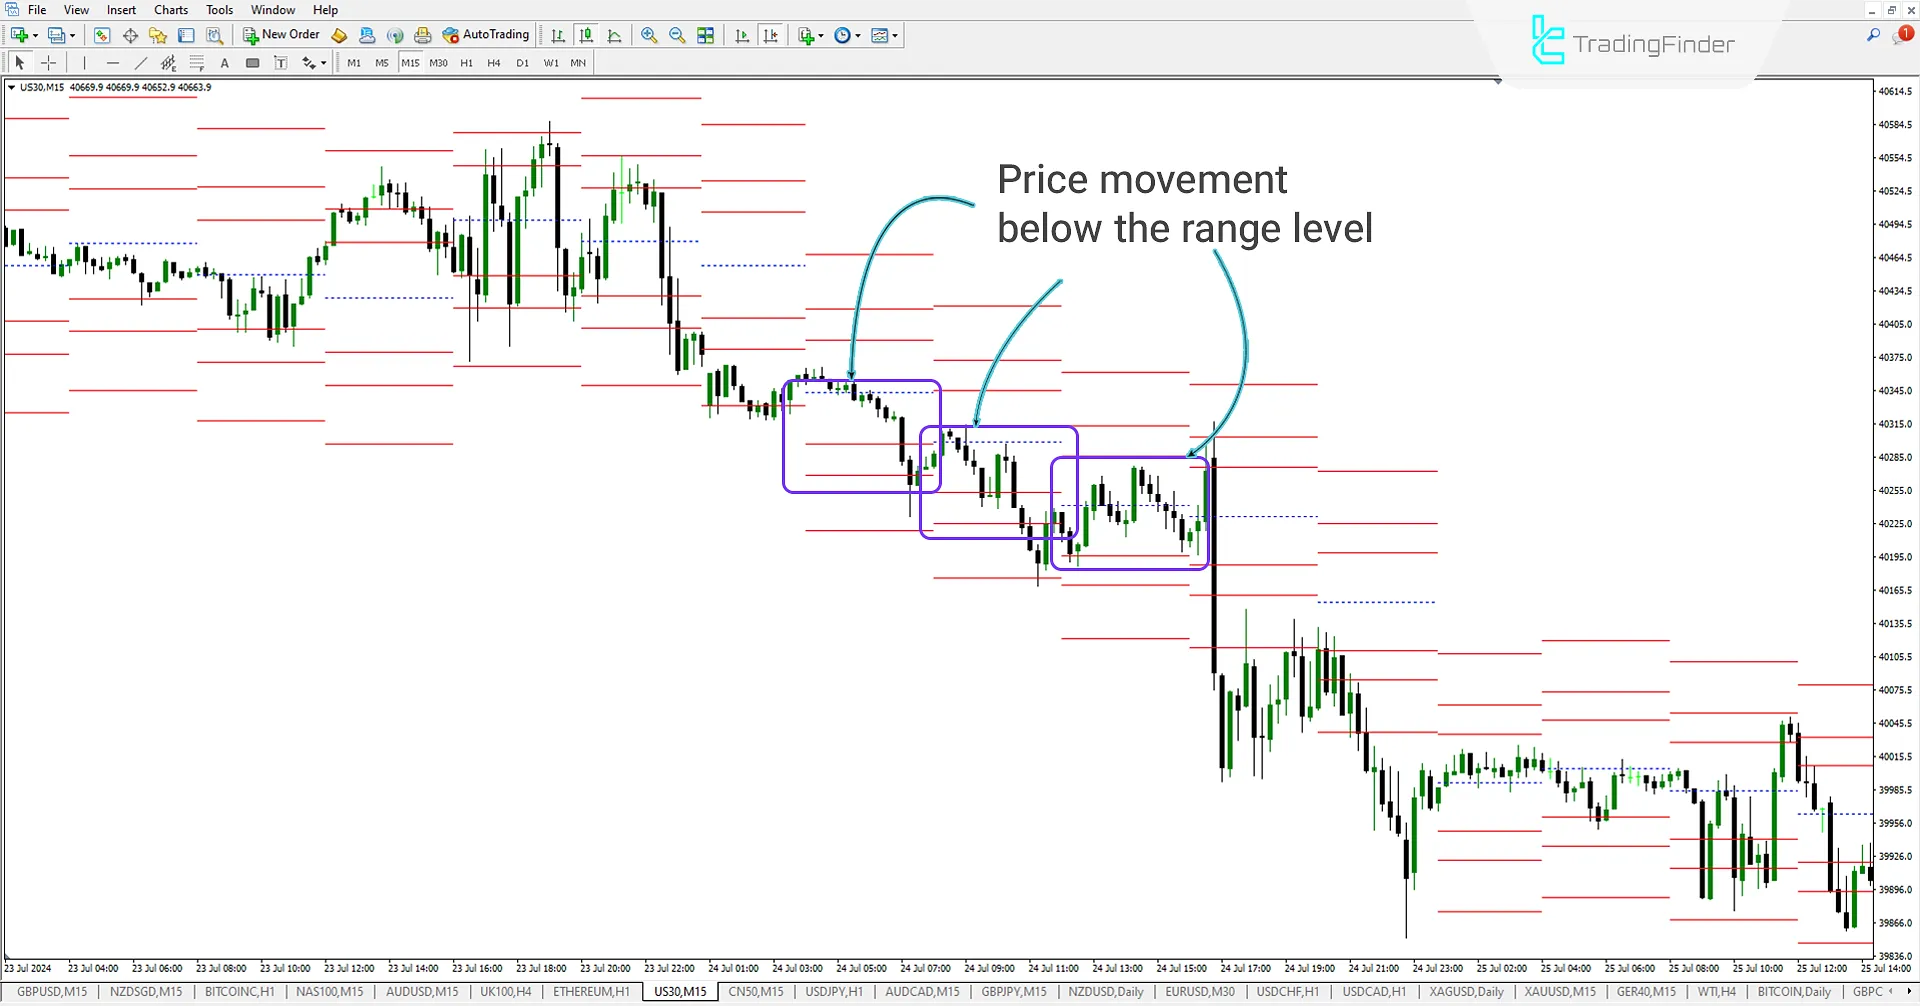
Price Movement Below the Central Level
In the 15-minute chart (US30), if the price moves below the central ATR level, traders can use the lower levels as target points (Take Profit) and the higher levels for Stop Loss in their trades.

ATRL Indicator Settings
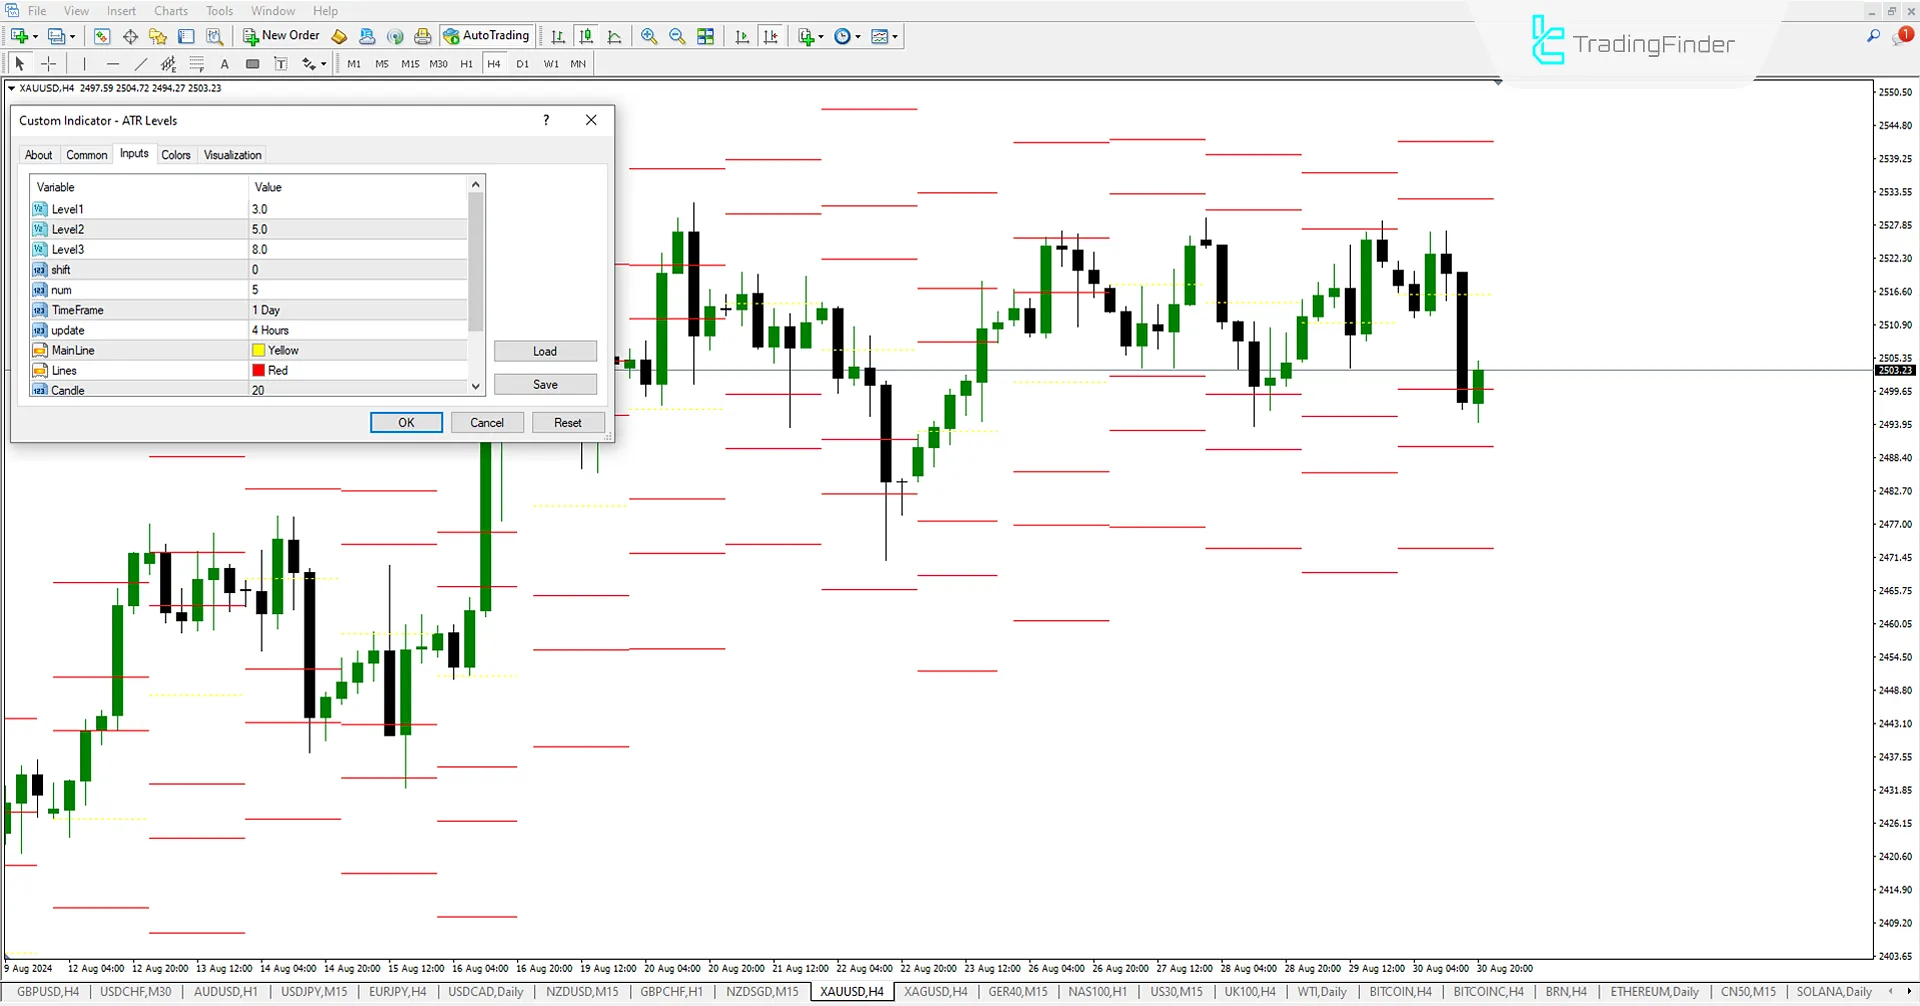
The settings for the ATRL indicator are shown in the image below:

- Level1: Distance value of the highest level from the central level
- Level2: Distance value of the second level from the central level
- Level3: Distance value of the lowest level from the central level
- Shift: Update lines based on the number of past candles
- Num: Number of candles for calculation
- Timeframe: Timeframe basis for calculation
- Update: Set the update interval
- Main Line: Color of the central level
- Lines: Color of the levels
- Candle: Set the number of candles to display levels
- Group: ATR Indicator settings
- ATR Period: ATR indicator timeframe
Conclusion
The Average True Range Levels (ATRL) Indicator assists traders in analyzing price volatility. When the price is above the central line in the ATRL Indicator, the market is considered bullish, and the upper levels act as resistance.
Conversely, when the price is below the central line, the market is considered bearish, and the lower levels act as support. Traders looking for support and resistance levels in MT4 can enhance their trading strategies by using this indicator.
ATR Levels MT4 PDF
ATR Levels MT4 PDF
Click to download ATR Levels MT4 PDFWho is the ATRL Indicator suitable for?
This indicator is suitable for traders who identify price levels and use these critical levels to take profit or stop loss points. It is also ideal for traders who want to determine support and resistance levels.
Is the ATRL Indicator available only for MetaTrader 4?
No, the ATRL Indicator is available for MetaTrader 4 and MetaTrader 5. Traders can visit the top of the page to download the MetaTrader 5 version.


