![Automatic Support & Resistance Indicator for MT4 Download – Free – [TradingFinder]](https://cdn.tradingfinder.com/image/314168/11-72-en-automatic-support-resistance-mt4-01.webp)
![Automatic Support & Resistance Indicator for MT4 Download – Free – [TradingFinder] 0](https://cdn.tradingfinder.com/image/314168/11-72-en-automatic-support-resistance-mt4-01.webp)
![Automatic Support & Resistance Indicator for MT4 Download – Free – [TradingFinder] 1](https://cdn.tradingfinder.com/image/314166/11-72-en-automatic-support-resistance-mt4-02.webp)
![Automatic Support & Resistance Indicator for MT4 Download – Free – [TradingFinder] 2](https://cdn.tradingfinder.com/image/314165/11-72-en-automatic-support-resistance-mt4-03.webp)
![Automatic Support & Resistance Indicator for MT4 Download – Free – [TradingFinder] 3](https://cdn.tradingfinder.com/image/314167/11-72-en-automatic-support-resistance-mt4-04.webp)
The Automatic Support & Resistance Indicator is one of the support & resistance in MetaTrader 4, designed to intelligently identify key support and resistance levels.
By analyzing frequently tested price zones, this indicator highlights support areas in green and resistance areas in brown on the chart.
Professional traders utilize this tool to identify market reversal points and define trading zones. By providing precise price behavior analysis, this indicator enables traders to execute trading strategies with greater confidence.
The primary application of this tool is to identify high-potential market zones, significantly enhancing trade success rates.
Automatic Support & Resistance Indicator Table
Below are the general specifications of the Automatic Support & Resistance Indicator:
Indicator Categories: | Price Action MT4 Indicators Support & Resistance MT4 Indicators Supply & Demand MT4 Indicators |
Platforms: | MetaTrader 4 Indicators |
Trading Skills: | Elementary |
Indicator Types: | Range MT4 Indicators Entry and Exit MT4 Indicators Reversal MT4 Indicators |
Timeframe: | Multi-Timeframe MT4 Indicators |
Trading Style: | Day Trading MT4 Indicators Intraday MT4 Indicators Scalper MT4 Indicators |
Trading Instruments: | Share Stocks MT4 Indicators Indices Market MT4 Indicators Stock Market MT4 Indicators Forex MT4 Indicators |
Support Zone in an Uptrend
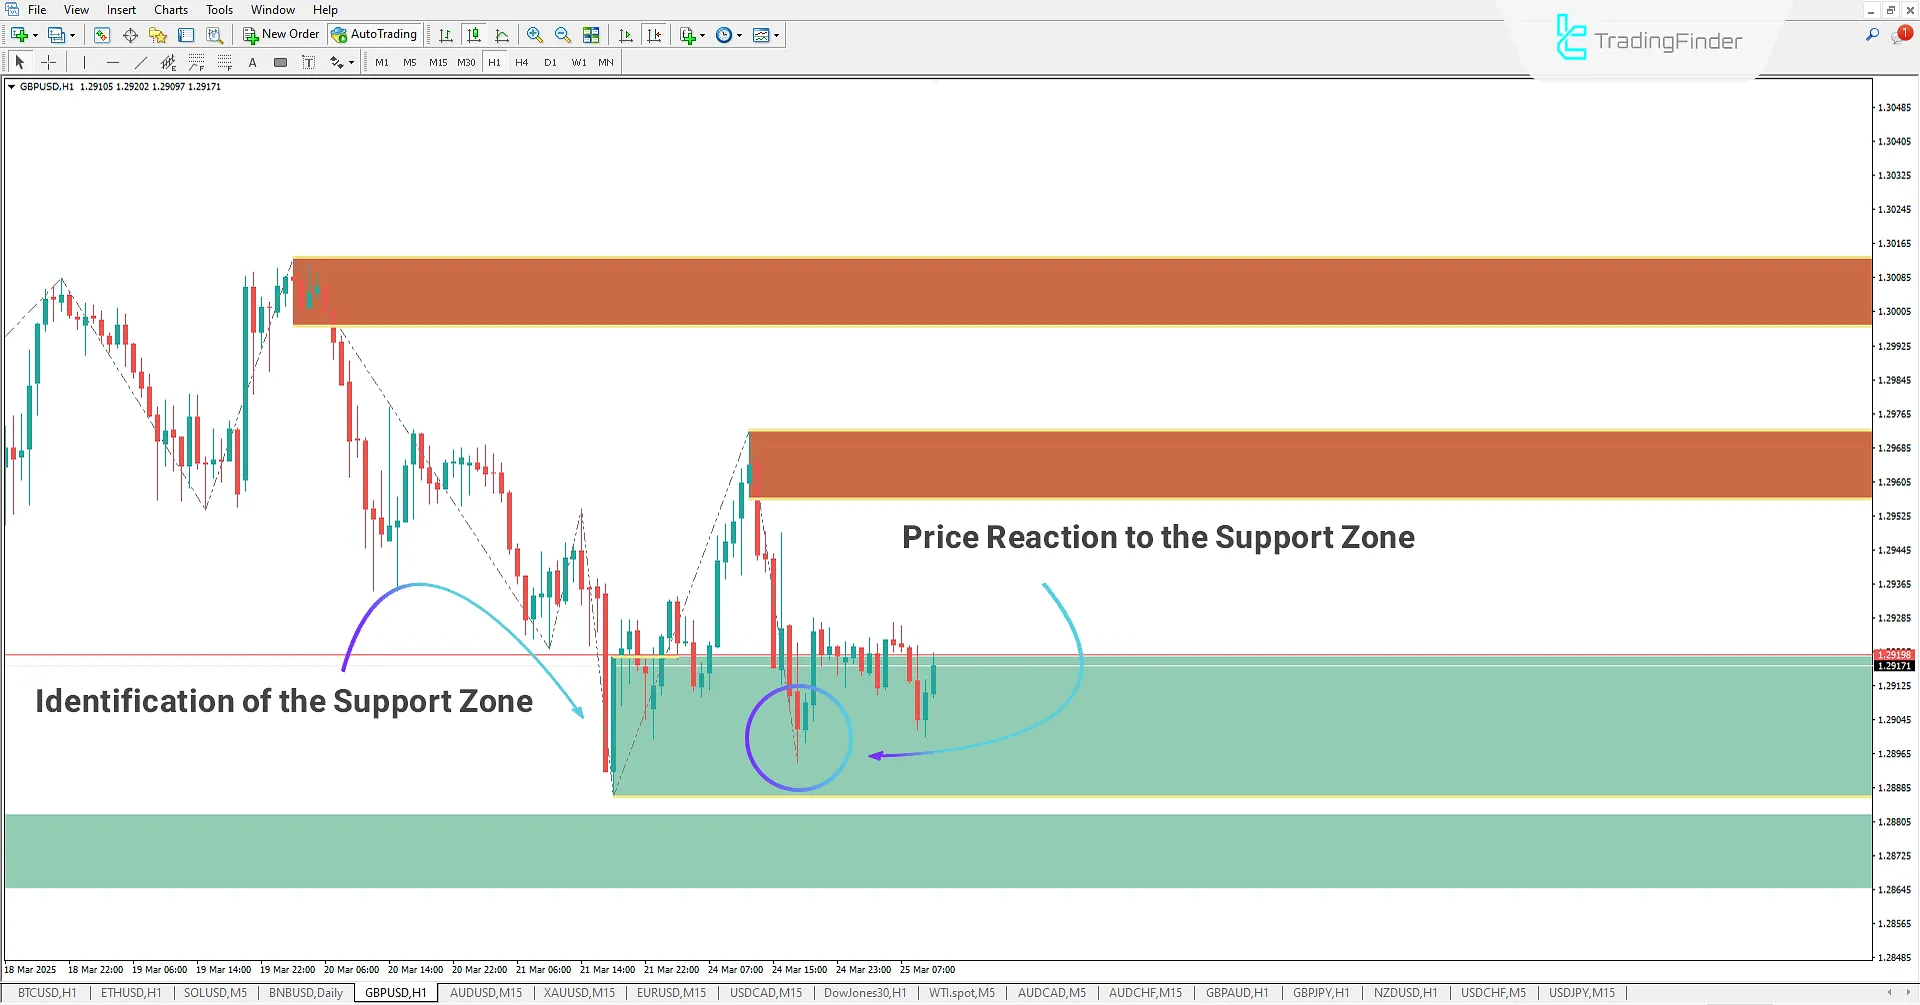
On the 1-hour timeframe of the GBP/USD currency pair, the Automatic Support & Resistance Indicator identifies a major support zone, highlighted with a green box on the chart.
When the price exits this zone and retests it, the box color changes from dark green to light green, indicating that the market has tested this support level.
This intelligent feature enables traders to spot price growth areas and identify optimal buying opportunities.

Resistance Zone in a Downtrend
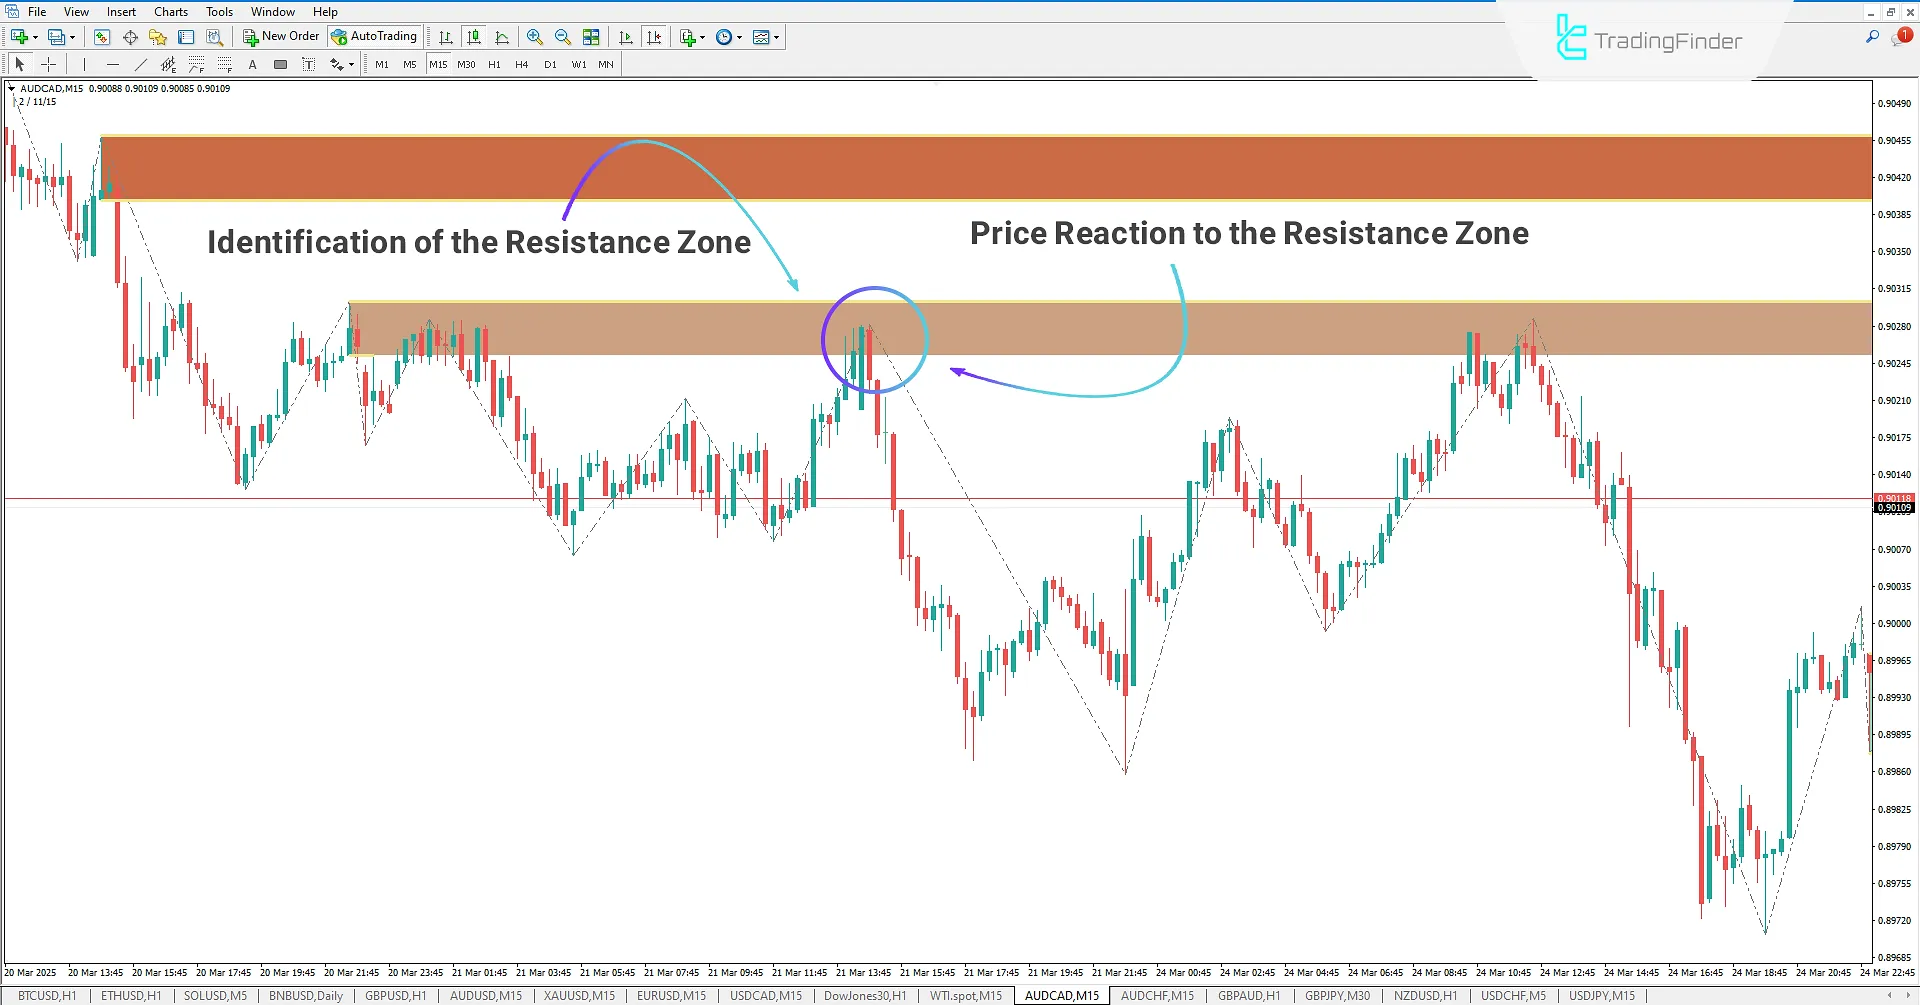
On the 15-minute chart of the AUD/CAD currency pair, the indicator detects a key resistance level.
After the price breaks out and pulls back, the box color changes from dark brown to light brown, indicating that the resistance level has been tested.
This color change signals a potential downtrend formation. Professional traders combine this signal with price action patterns to identify high-probability sell opportunities.

Automatic Support & Resistance Indicator Settings
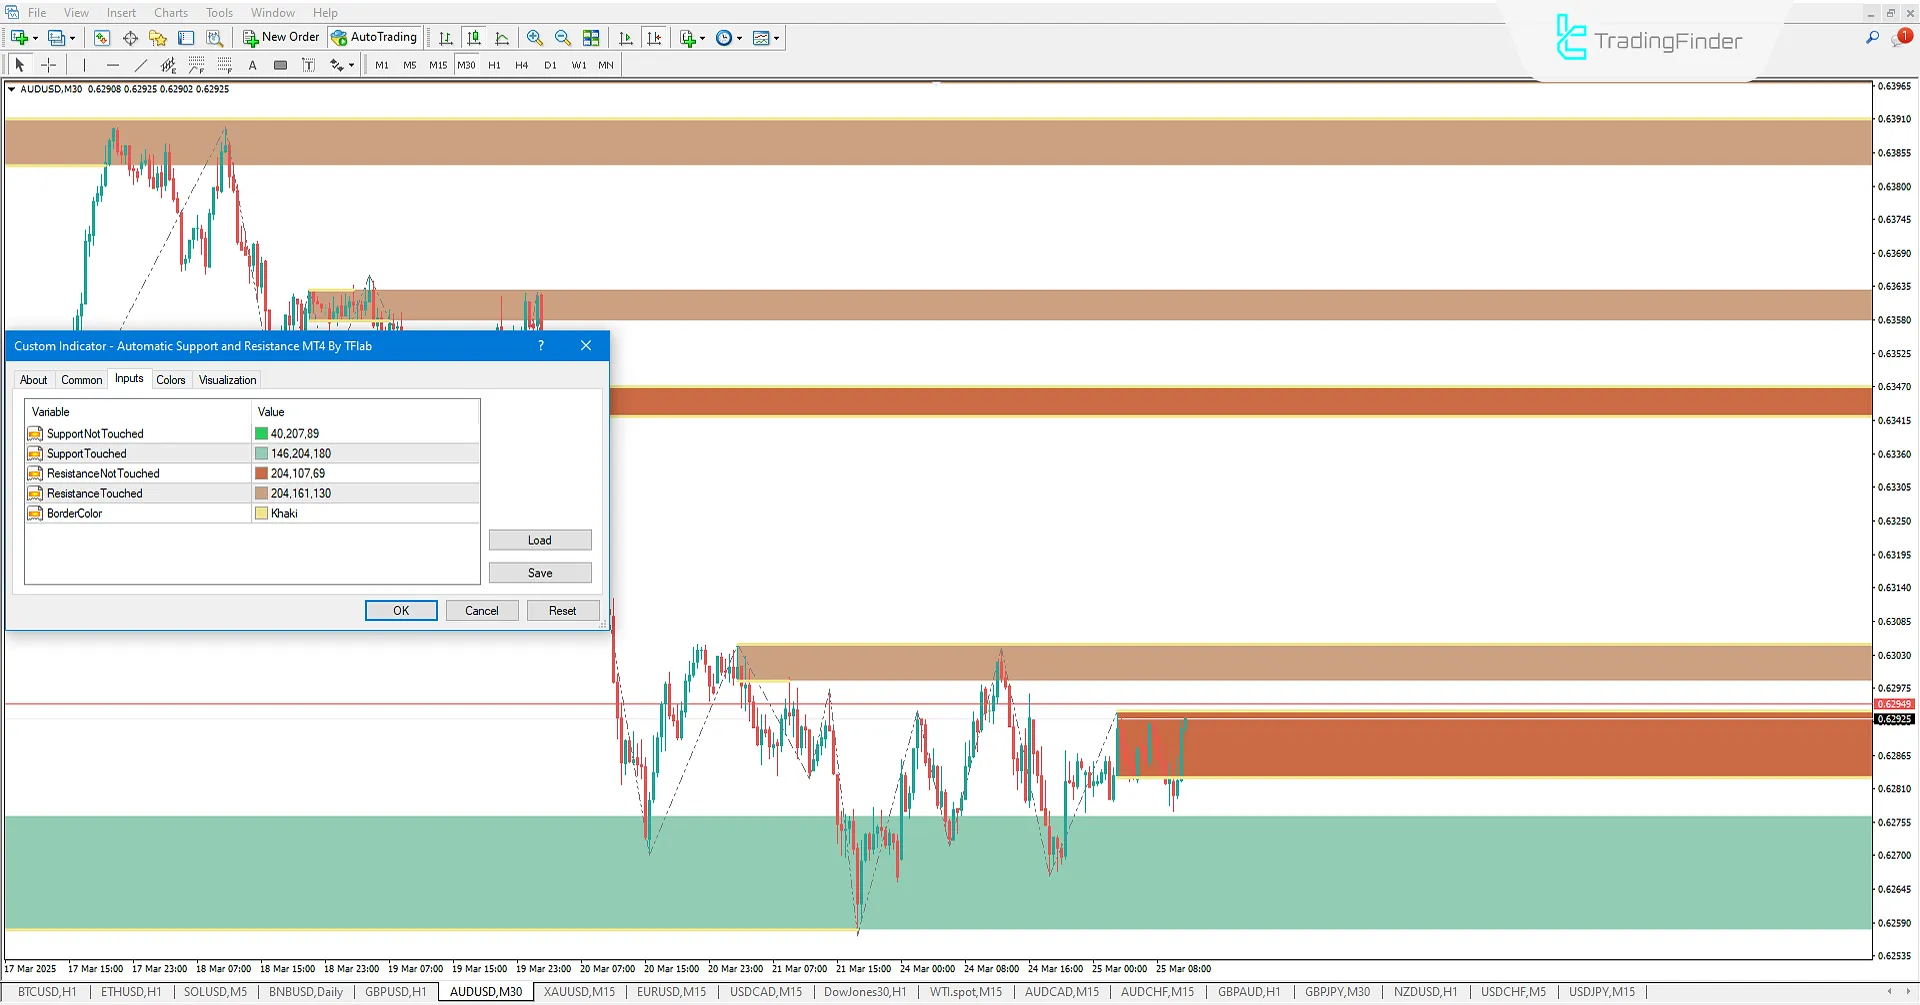
Below are the settings for the Automatic Support & Resistance Indicator in MetaTrader 4:

- Support Not Touched: Adjust the color of untouched support zones;
- Support Touched: Adjust the color of tested support zones;
- Resistance Not Touched: Adjust the color of untouched resistance zones;
- Resistance Touched: Adjust the color of tested resistance zones;
- Border Color: Set the color of the box borders.
Conclusion
The Automatic Support & Resistance Indicator is one of the MetaTrader 4 indicators that intelligently identifies key price zones.
By detecting high-potential support and resistance areas, this tool provides a specialized market structure analysis.
Price action traders can use these signals to pinpoint optimal entry and exit points.
Automatic Support Resistance MT4 PDF
Automatic Support Resistance MT4 PDF
Click to download Automatic Support Resistance MT4 PDFWhat is the Automatic Support & Resistance Indicator?
The Automatic Support & Resistance Indicator is a MetaTrader 4 tool that intelligently identifies and displays key support and resistance levels on the chart.
How does this indicator identify support and resistance levels?
This indicator analyzes price zones and marks support areas in green and resistance areas in brown or red. Additionally, color intensity changes based on price interaction with various levels.
Hello guys I love your indicators they help a lot just like automatic support and resistance, but there is always some option you forcing on us just like a zigzag that I can't remove , you must understand we have our own templates and other indicators we use ,can you please have a option to remove the zig zag ,thank you
Hi, i passed it to our developer. its possible, we will do that.


