![Chandelier Indicator for MetaTrader 4 Download – Free – [TFlab]](https://cdn.tradingfinder.com/image/393470/13-129-en-chandelier-mt4-01.webp)
![Chandelier Indicator for MetaTrader 4 Download – Free – [TFlab] 0](https://cdn.tradingfinder.com/image/393470/13-129-en-chandelier-mt4-01.webp)
![Chandelier Indicator for MetaTrader 4 Download – Free – [TFlab] 1](https://cdn.tradingfinder.com/image/393471/13-129-en-chandelier-mt4-02.webp)
![Chandelier Indicator for MetaTrader 4 Download – Free – [TFlab] 2](https://cdn.tradingfinder.com/image/393469/13-129-en-chandelier-mt4-03.webp)
![Chandelier Indicator for MetaTrader 4 Download – Free – [TFlab] 3](https://cdn.tradingfinder.com/image/393468/13-129-en-chandelier-mt4-04.webp)
On July 20, 2025, in version 2, alert/notification and signal functionality was added to this indicator
The Chandelier Indicator is designed to display a trailing stop in the MT4. This practical tool in technical analysis creates levels above and below the price using the Average True Range (ATR) indicator.
Additionally, this indicator draws vertical lines to highlight phase shifts in price trends, such as transitions from bullish to bearish and vice versa.
Chandelier Indicator Specifications Table
The table below outlines the specifications and features of the Chandelier Indicator:
Indicator Categories: | Support & Resistance MT4 Indicators Trading Assist MT4 Indicators Levels MT4 Indicators |
Platforms: | MetaTrader 4 Indicators |
Trading Skills: | Elementary |
Indicator Types: | Reversal MT4 Indicators |
Timeframe: | Multi-Timeframe MT4 Indicators |
Trading Style: | Day Trading MT4 Indicators Scalper MT4 Indicators Swing Trading MT4 Indicators |
Trading Instruments: | Share Stocks MT4 Indicators Forward Market MT4 Indicators Indices Market MT4 Indicators Commodity Market MT4 Indicators Stock Market MT4 Indicators Cryptocurrency MT4 Indicators Forex MT4 Indicators |
Overview of the Chandelier Indicator
The Chandelier Indicator features two parallel dynamiclines that define a range of price fluctuations. It also draws vertical lines on the chart to signal a change in trend direction.
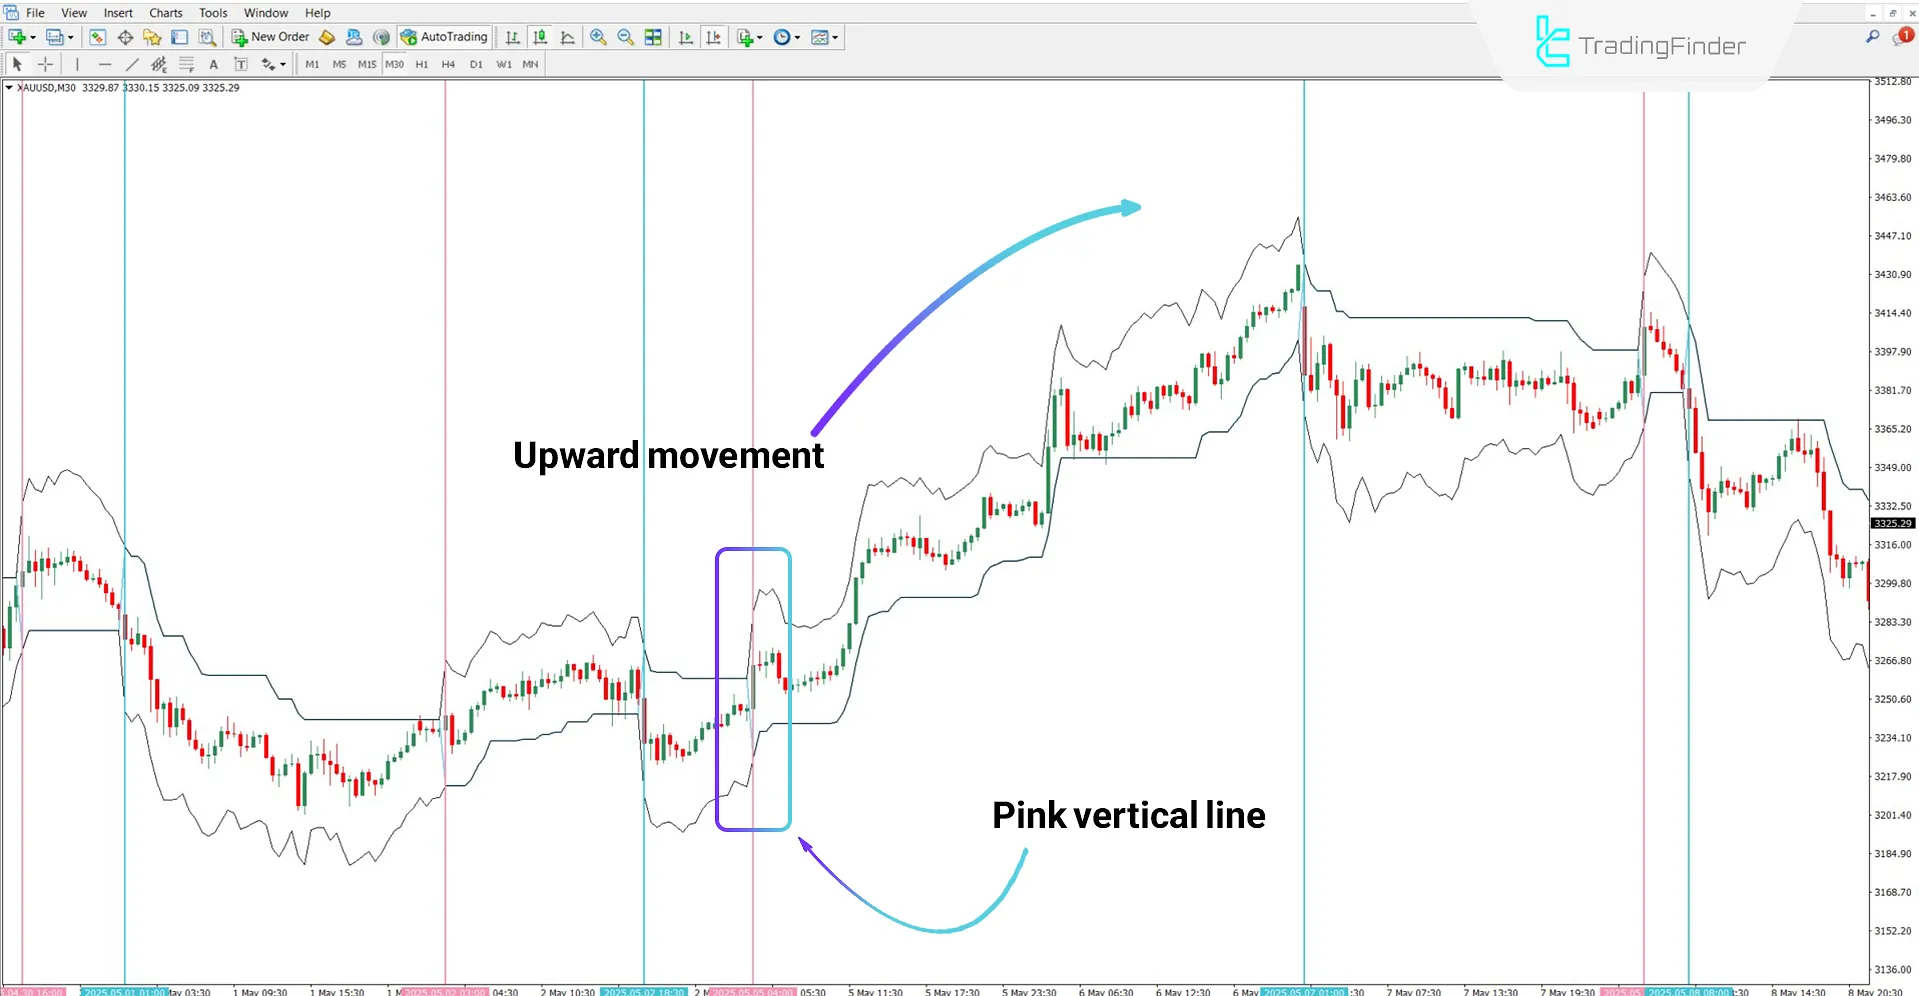
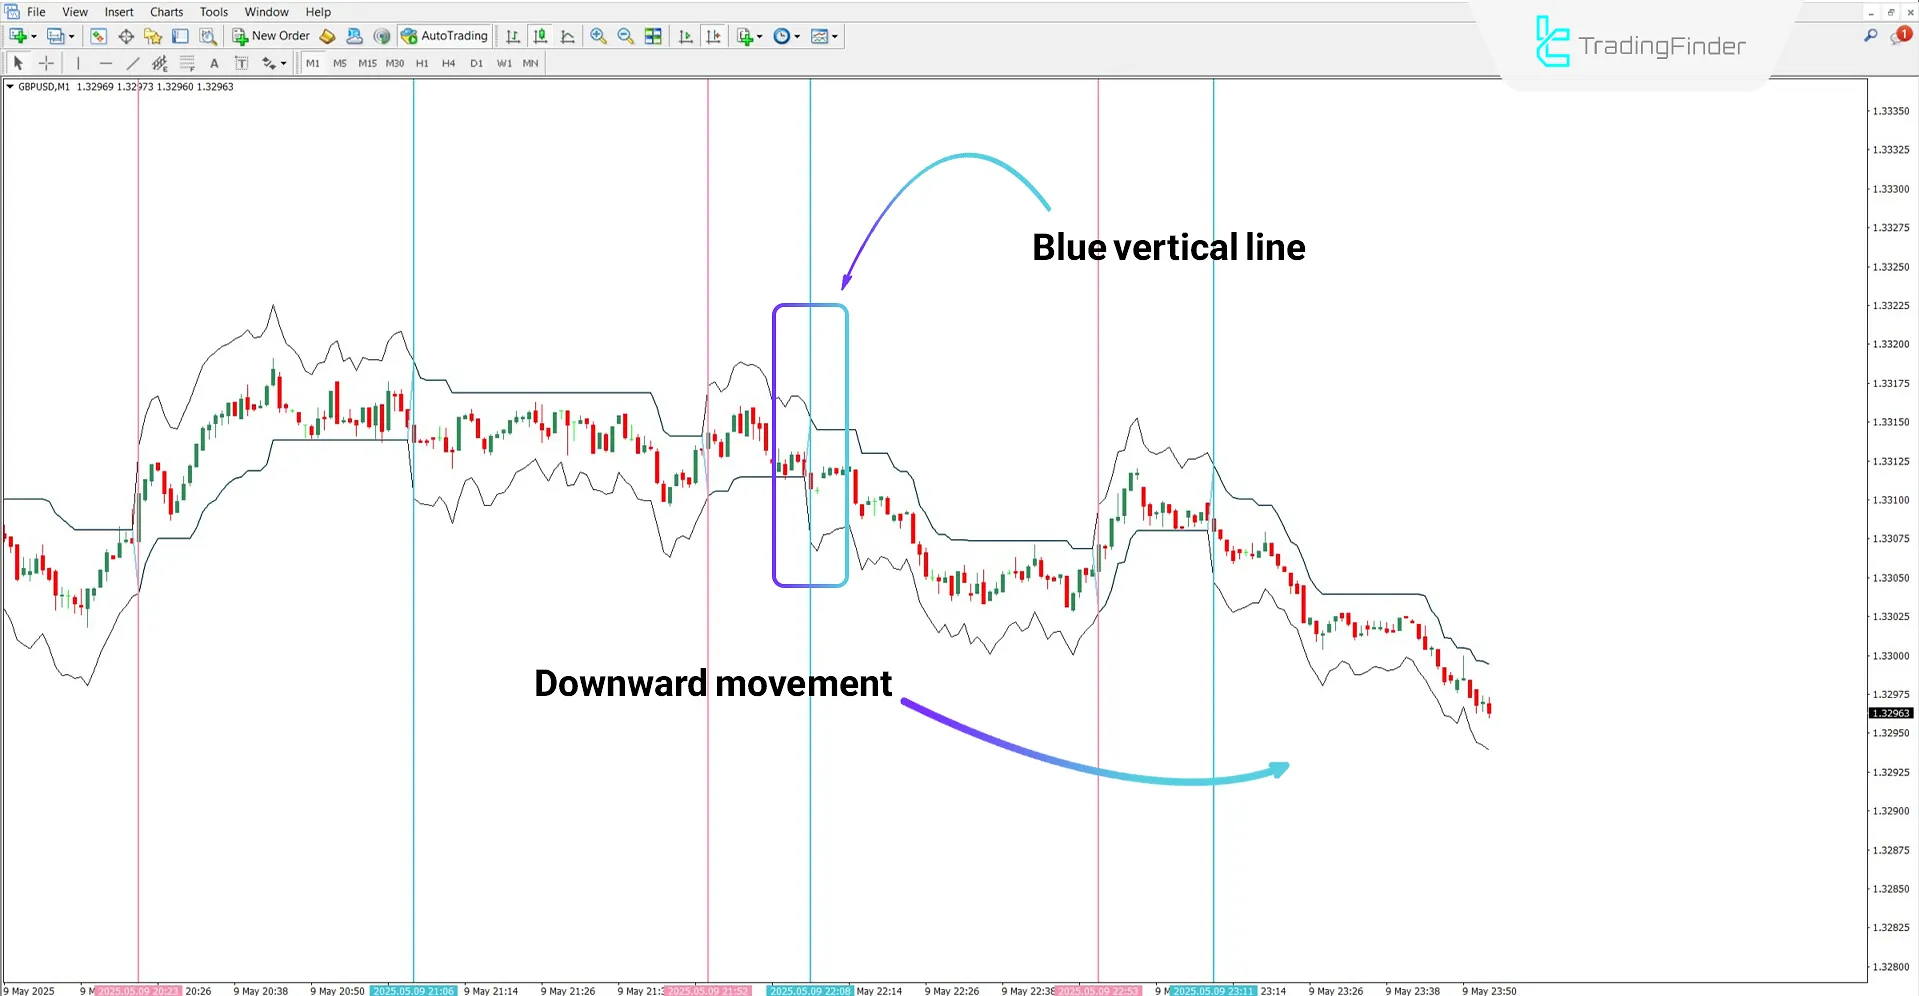
A pink vertical line signals the beginning of a bullish trend, while a blue vertical line marks the start of a bearish trend. During these conditions, the dynamic lines act as support and resistance levels.
Bullish Trend Analysis
In the example chart of Gold to US Dollar (XAU/USD) on a 30-minute timeframe, the Chandelier Indicator highlights a shift from a bearish to a bullish trend with a pink vertical line.
Under these conditions, the dynamic line below the price acts as a support zone, and the area beneath it becomes ideal for placing stop loss levels.

Bearish Trend Analysis
In the chart ofGBP/USD on a 1-minute timeframe, a transition from range bound to bearish movement is identified with a blue vertical line. According to the chart, the dynamic line above the price acts as resistance, providing an appropriate place for the stop loss.

Chandelier Indicator Settings
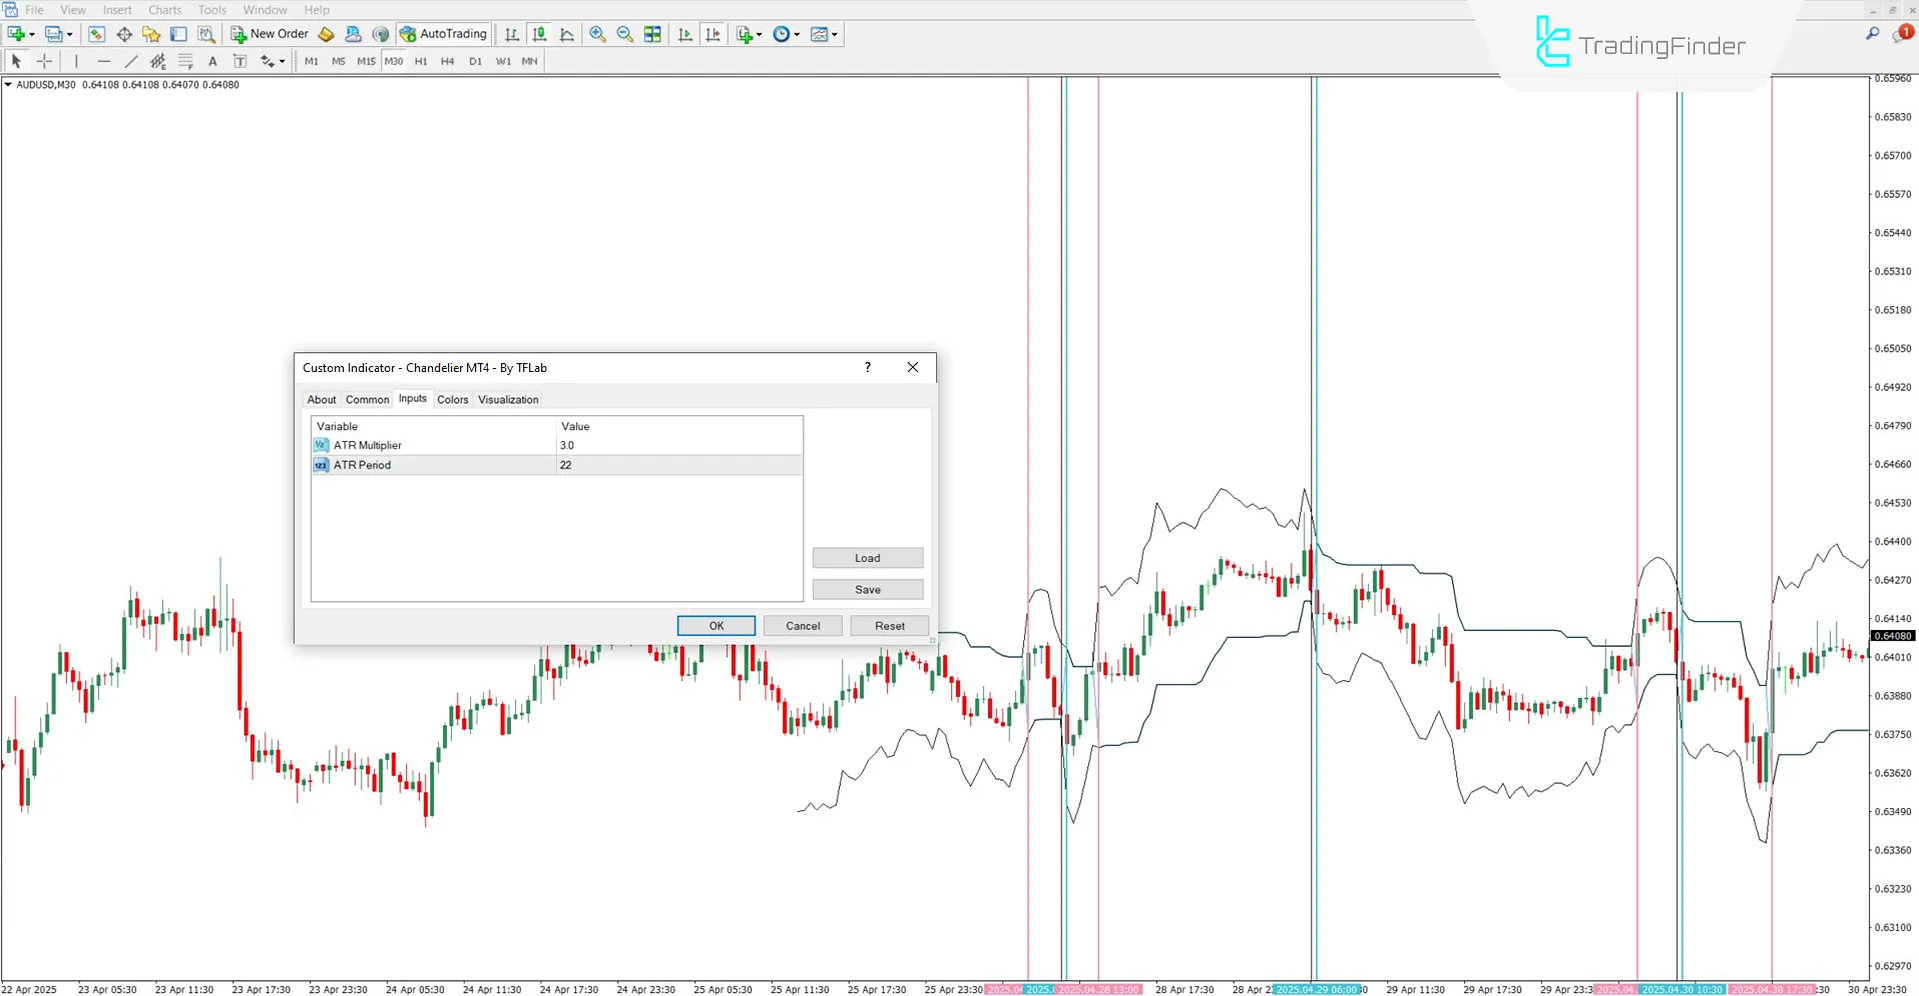
The image below shows the settings of the Chandelier Indicator:

- ATR Multiplier: Calculates the distance between high and low based on ATR
- ATR Period: Defines the number of candles used to calculate the ATR period
Conclusion
Using its dynamic and vertical lines, the Chandelier Indicator displays optimal entry and exit points for trades. Additionally, it serves as a Trailing Stop tool.
The vertical lines of this trading tool clearly indicate changes in trend direction and enhance the accuracy of market analysis.
Chandelier MT4 PDF
Chandelier MT4 PDF
Click to download Chandelier MT4 PDFDoes the Chandelier Indicator generate entry and exit signals?
No, this indicator does not directly generate trading signals.
How does the dynamic channel of the Chandelier Indicator differ from the Bollinger Bands?
Bollinger Bands operate based on standard deviation, whereas this indicator uses the Average True Range (ATR).


