![CISD - CSD + High & Low ICT Indicator in MT4 Download - Free - [TFlab]](https://cdn.tradingfinder.com/image/252531/13-77-en-cisd-csd-high-low-mt4-01.webp)
![CISD - CSD + High & Low ICT Indicator in MT4 Download - Free - [TFlab] 0](https://cdn.tradingfinder.com/image/252531/13-77-en-cisd-csd-high-low-mt4-01.webp)
![CISD - CSD + High & Low ICT Indicator in MT4 Download - Free - [TFlab] 1](https://cdn.tradingfinder.com/image/252534/13-77-en-cisd-csd-high-low-mt4-02.webp)
![CISD - CSD + High & Low ICT Indicator in MT4 Download - Free - [TFlab] 2](https://cdn.tradingfinder.com/image/252532/13-77-en-cisd-csd-high-low-mt4-03.webp)
![CISD - CSD + High & Low ICT Indicator in MT4 Download - Free - [TFlab] 3](https://cdn.tradingfinder.com/image/252535/13-77-en-cisd-csd-high-low-mt4-04.webp)
The CISD - CSD + High and Low Indicator is a liquidity indicator based on the ICT trading style , and Liquidity Concepts in Forex designed to show potential trend reversal points.
This indicator utilizes the CISD (Critical Institutional Supply and Demand) concept to issue signals for trade entries based on the highest (High) and lowest (Low) price points in a specific timeframe. It also displays CISD on daily, weekly, and monthly timeframes.
CISD + High & Low Indicator Specifications Table
The specifications and features of the CISD – CSD + High and Low Indicator are displayed in the table below.
Indicator Categories: | ICT MT4 Indicators Smart Money MT4 Indicators Signal & Forecast MT4 Indicators |
Platforms: | MetaTrader 4 Indicators |
Trading Skills: | Advanced |
Indicator Types: | Reversal MT4 Indicators |
Timeframe: | Multi-Timeframe MT4 Indicators |
Trading Style: | Day Trading MT4 Indicators |
Trading Instruments: | Stock Market MT4 Indicators Cryptocurrency MT4 Indicators Forex MT4 Indicators |
CISD – CSD Indicator at a Glance
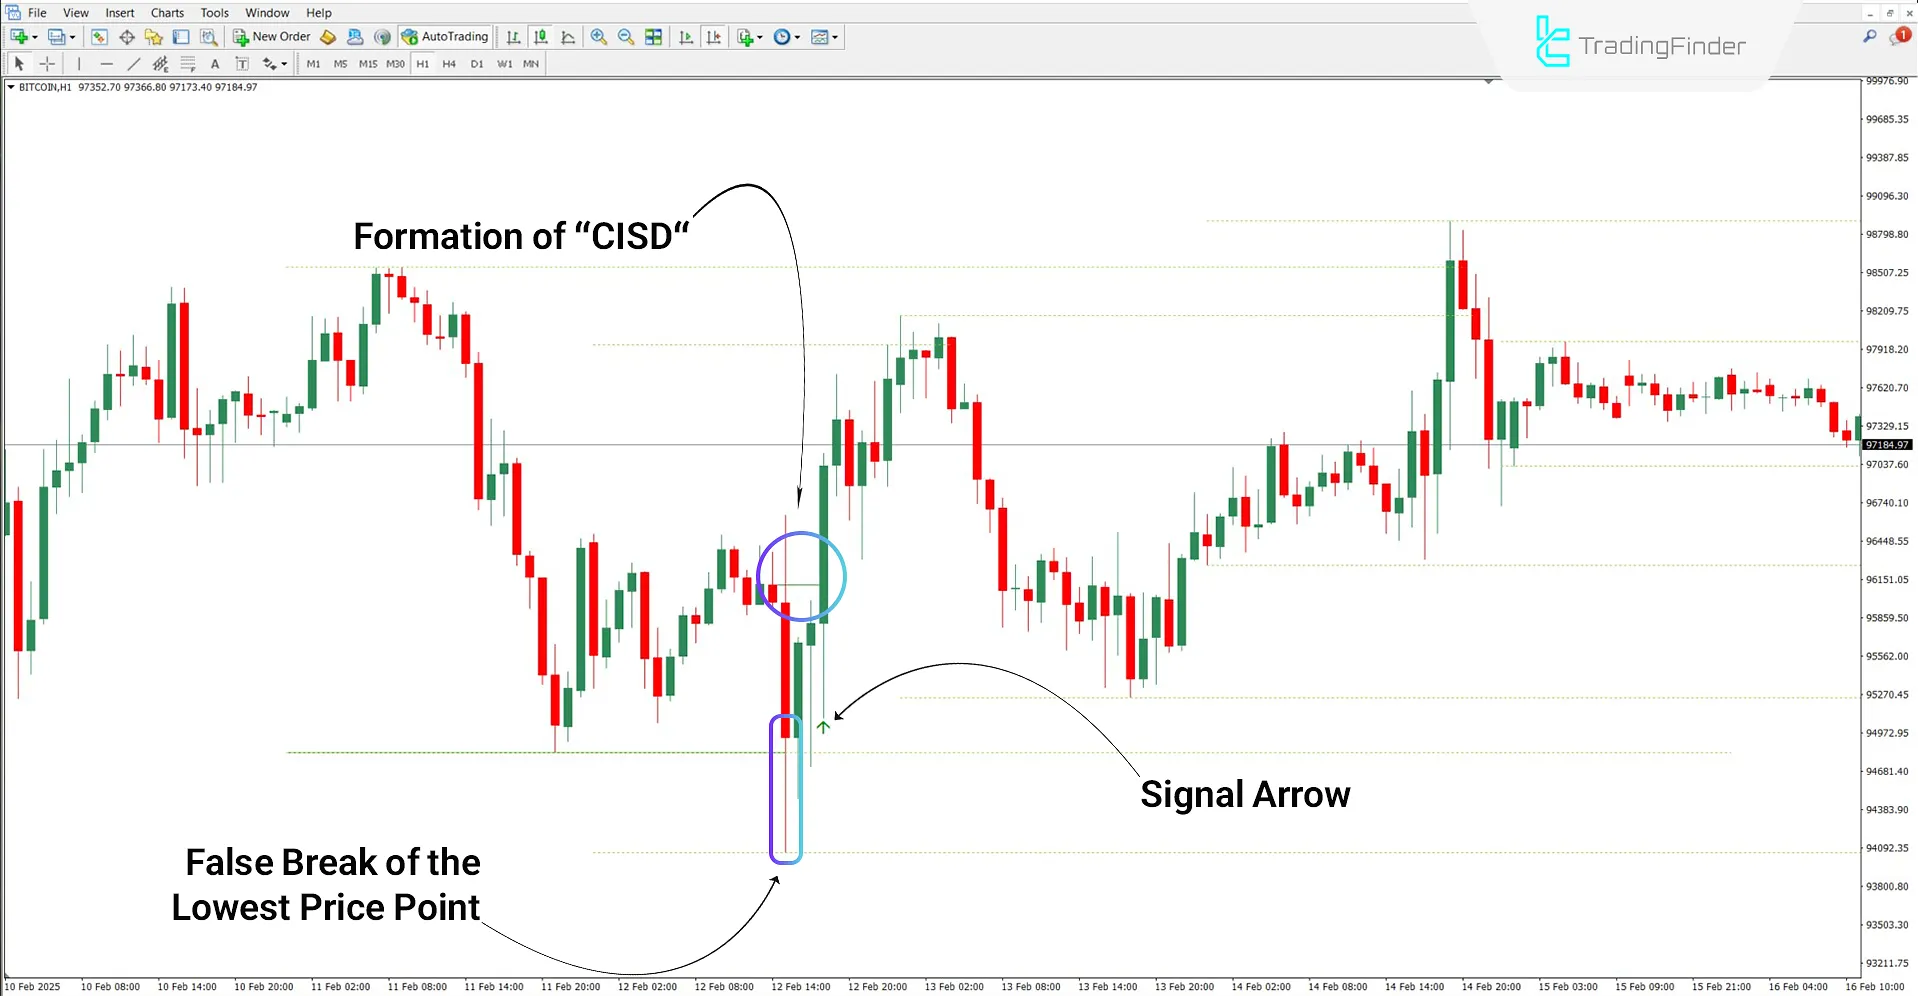
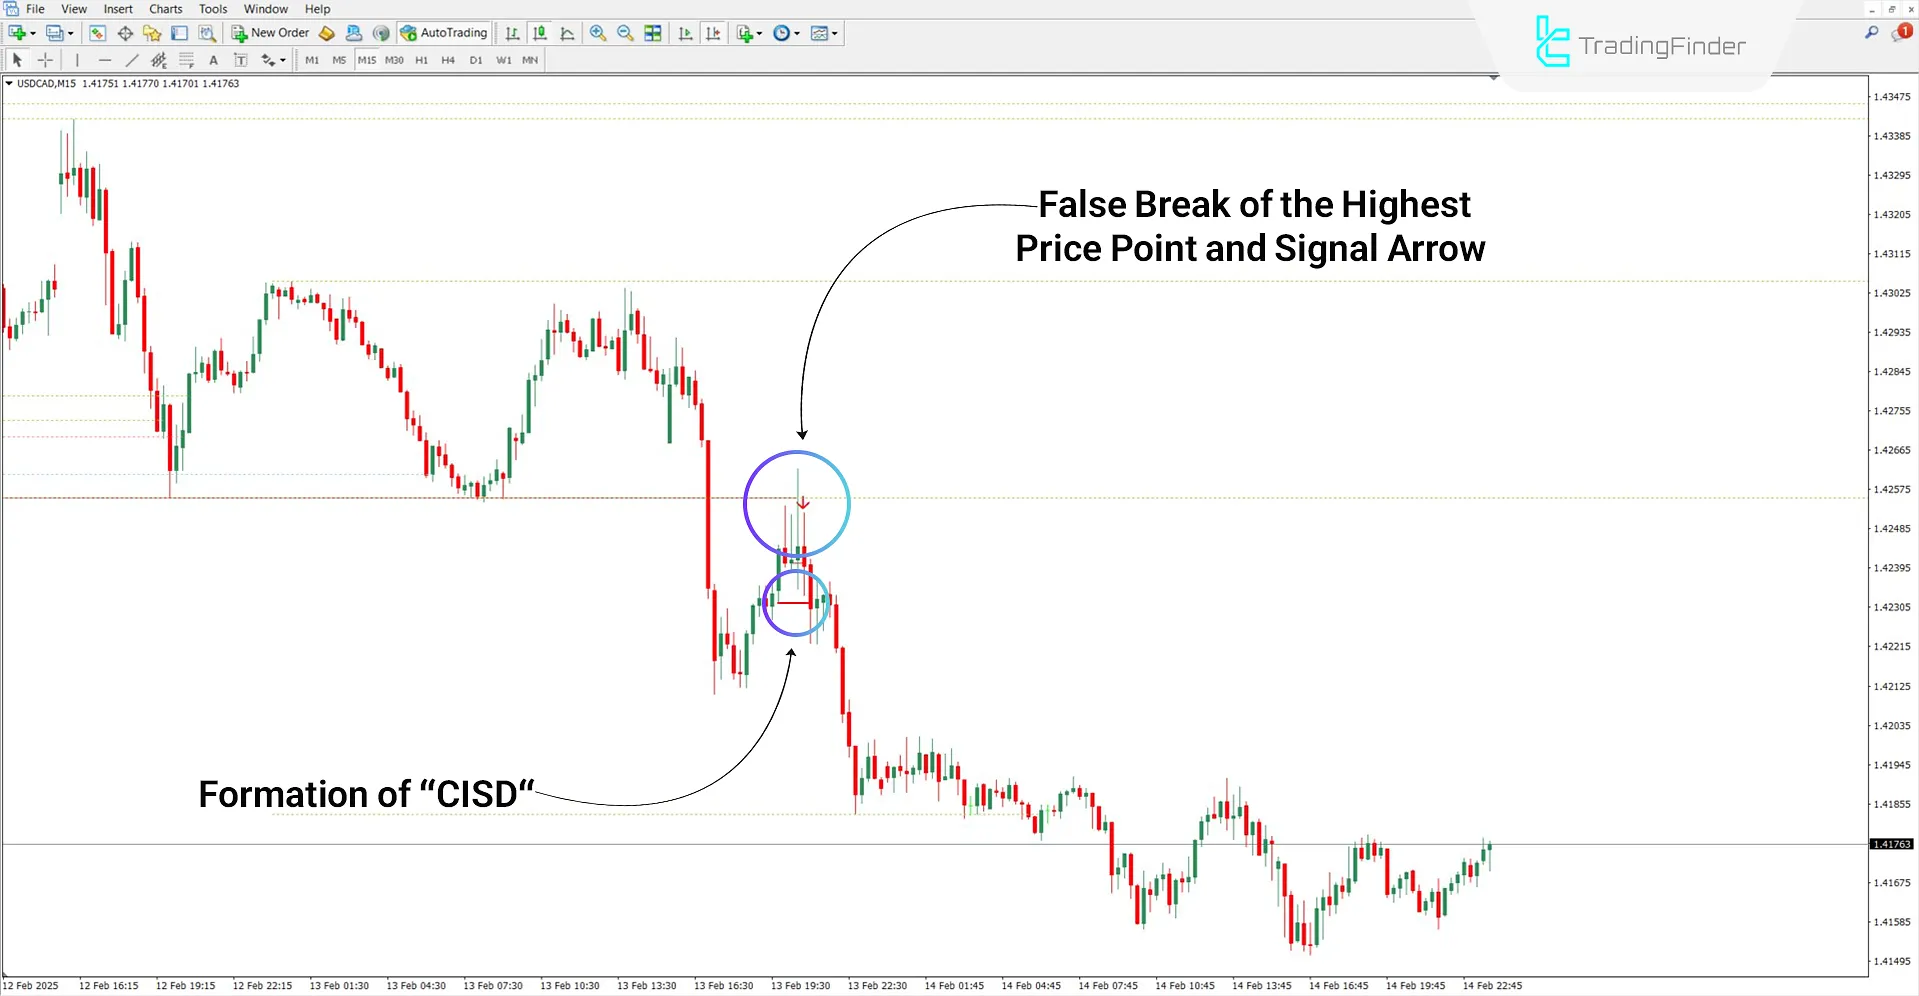
The highest and lowest price points are drawn on the chart using colored dashed lines. If the price forms a CISD after a false break of the High or Low levels, the indicator uses a signal arrow to mark the trade entry point.
Entering Buy Trades
In the 1-hour chart analysis of Bitcoin (BTC), the trendline initially creates a false break of the Low price point.
As shown in the image, if the price returns and forms a CISD, the indicator displays it with a green arrow, signaling a buy trade entry.

Entering Sell Trades
The 15-minute chart analysis of the USD/CAD currency pair demonstrates how the CISD – CSD + High and Low Indicator works.
As shown, after a false break of the High price point, the indicator identifies the formation of CISD and displays it with a red arrow, signaling a sell trade entry.

CISD + High and Low Indicator Settings
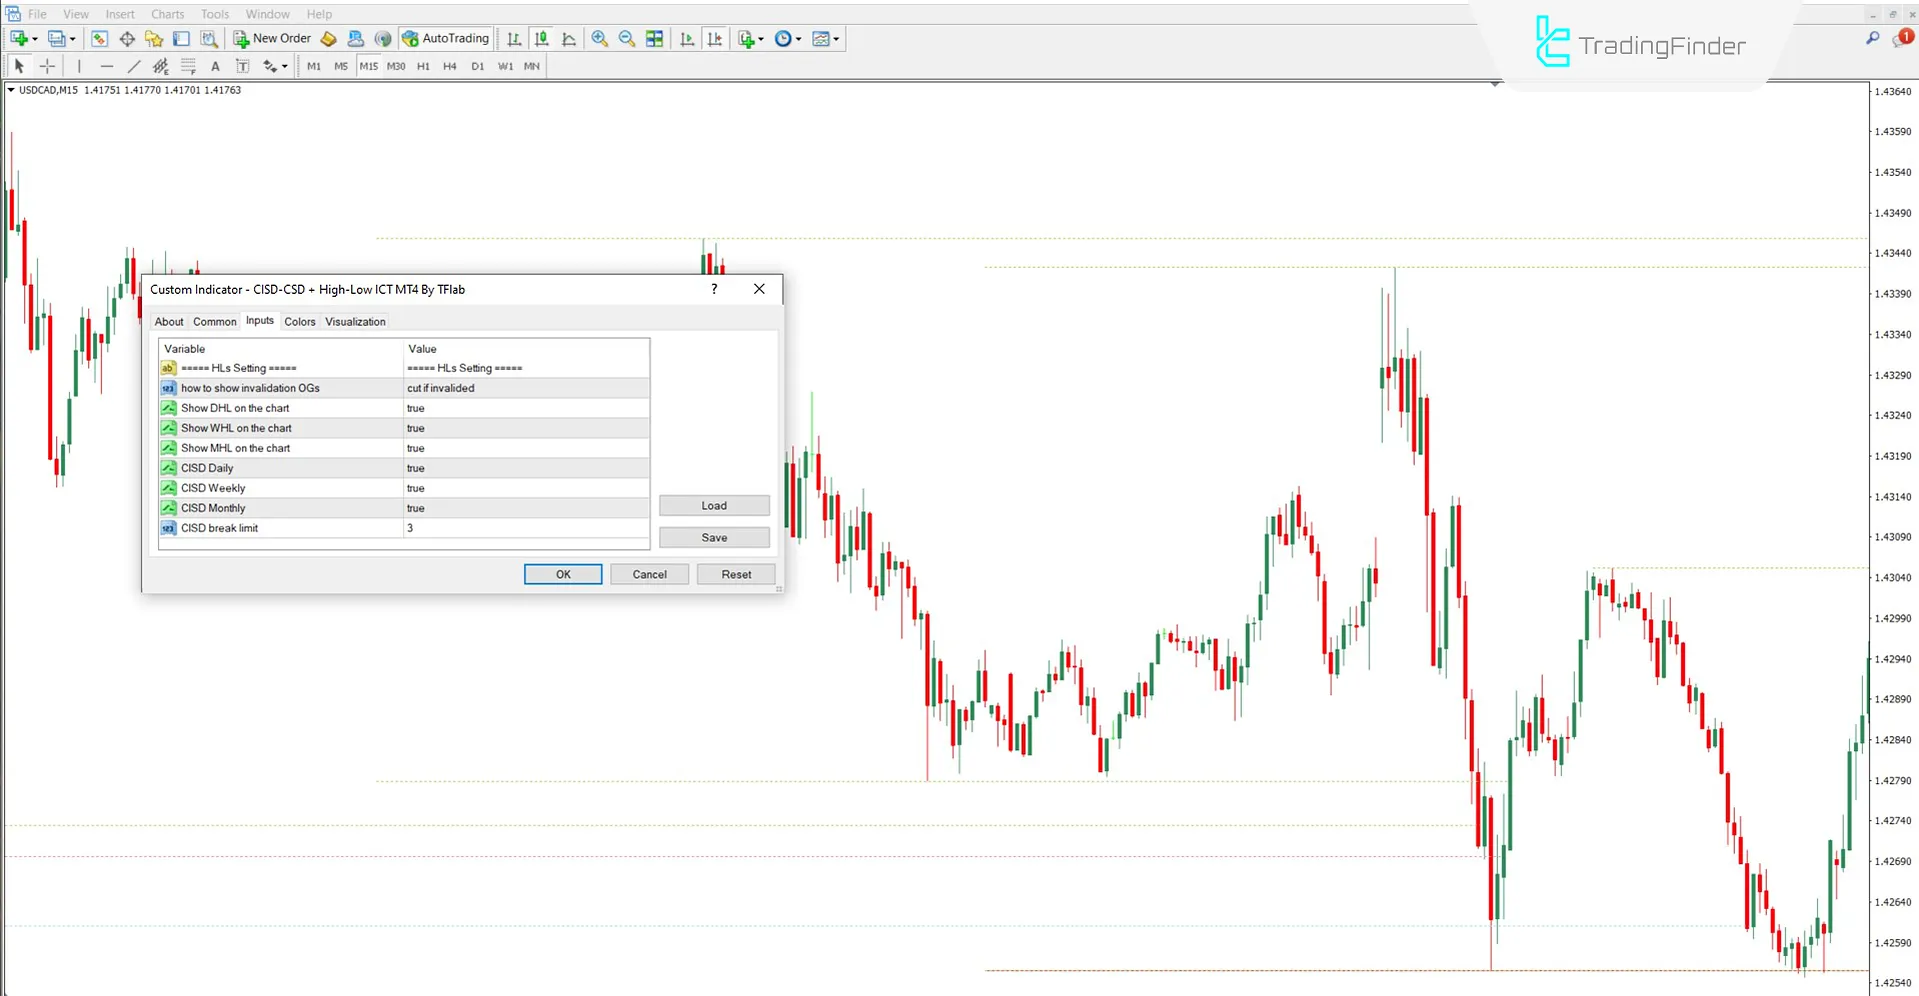
The following items pertain to the settings of the CISD – CSD + High and Low Indicator:

- How to show invalidation OGs: Displaying invalid zones
- Show DHL on the chart: Display daily timeframe high and low points
- Show WHL on the chart: Display weekly timeframe high and low points
- Show MHL on the chart: Display monthly timeframe high and low points
- CISD Daily: Display daily CISD
- CISD Weekly: Display weekly CISD
- CISD Monthly: Display monthly CISD
- CISD break limit: Set the limit for CISD level breaks
Conclusion
The CISD - CSD + High and Low Indicator, one of the signal and forecasting indicators, provides trade entry signals by drawing High and Low lines and identifying CISD levels.
This indicator, which relies on the CISD trading style, facilitates the analysis of supply and demand levels and price reversal zones.
CISD CSD High Low MT4 PDF
CISD CSD High Low MT4 PDF
Click to download CISD CSD High Low MT4 PDFWhat do the signal arrows indicate?
The arrows represent CISD and are considered trade entry signals.
Is this indicator usable for the crypto market?
Yes, this indicator is fully compatible with all markets, including cryptocurrencies.


