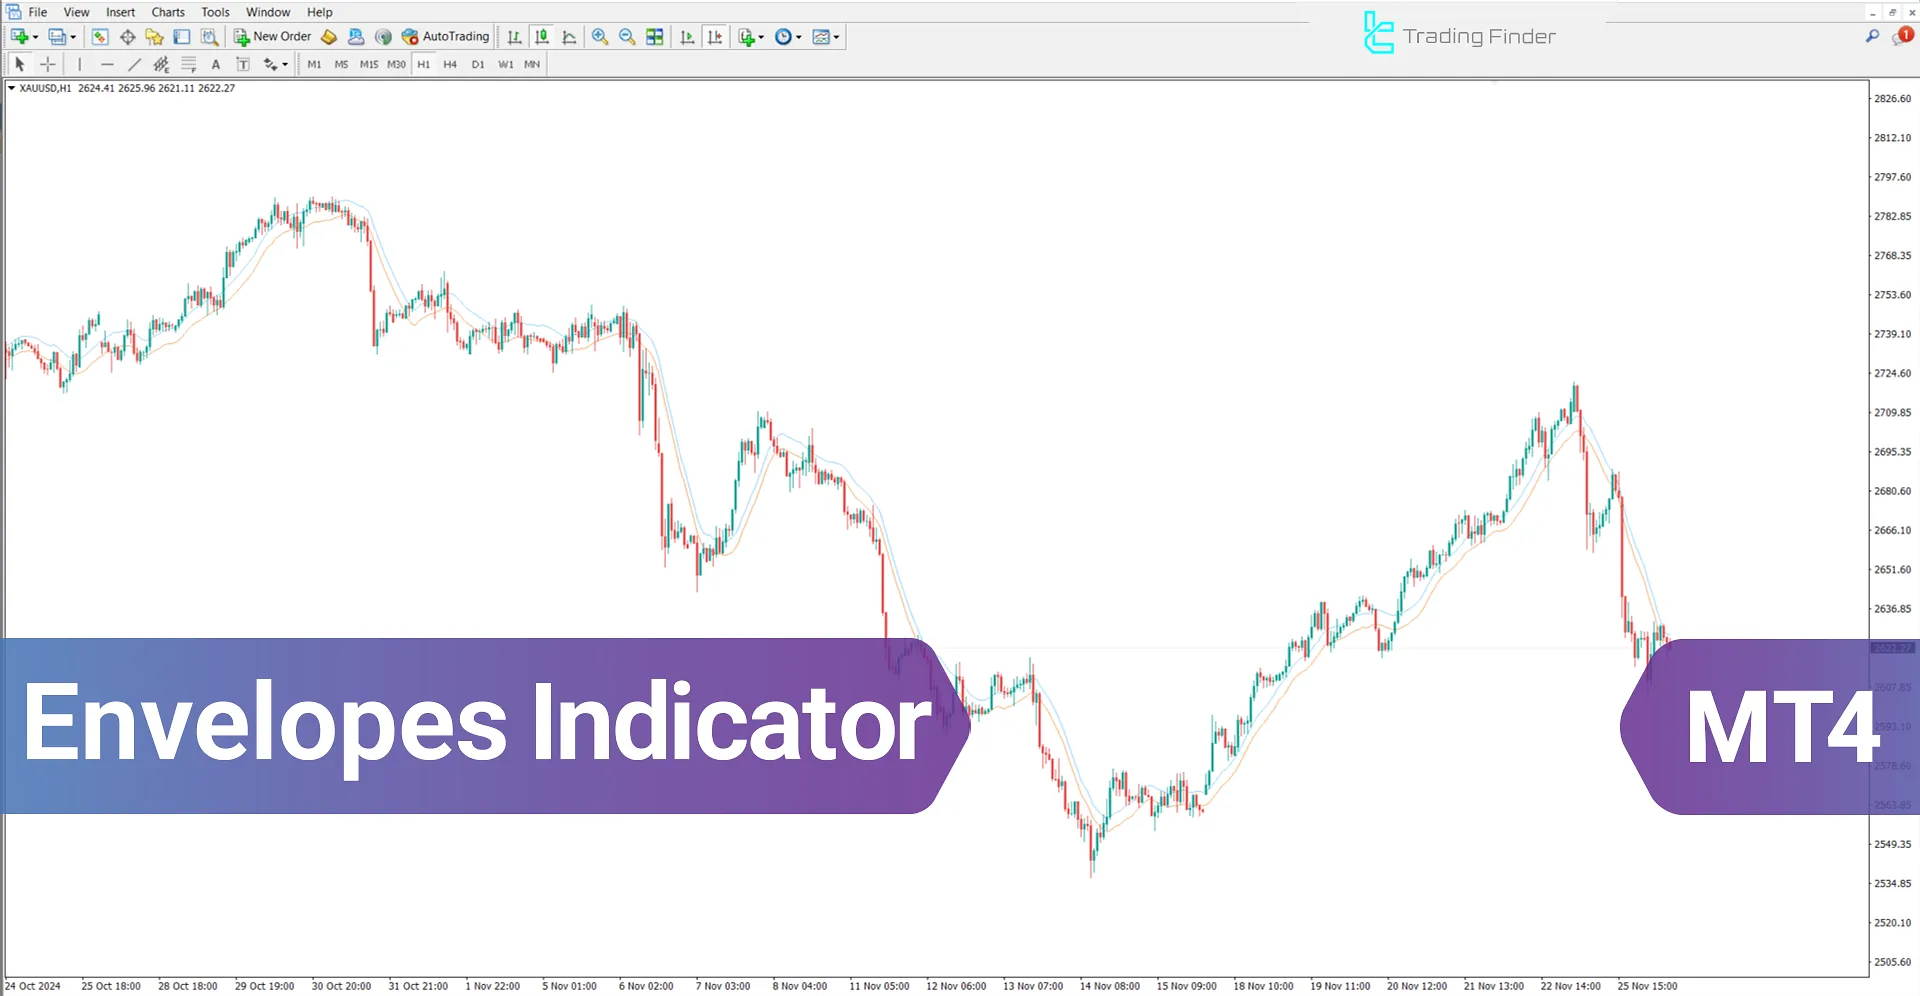


The Envelopes Indicator is a technical analysis tool used in financial markets to identify support and resistance zones and detect trend reversals.
This Volatility MT4 indicator is formed by two lines with a fixed percentage deviation around a moving average. The blue and red lines help identify overbought and oversold levels.
Envelopes Indicator Specifications Table
Table provides an overview of the capabilities of the Envelopes indicator on the MetaTrader 4 platform:
Indicator Categories: | Volatility MT4 Indicators Bands & Channels MT4 Indicators Levels MT4 Indicators |
Platforms: | MetaTrader 4 Indicators |
Trading Skills: | Intermediate |
Indicator Types: | Range MT4 Indicators Breakout MT4 Indicators |
Timeframe: | Multi-Timeframe MT4 Indicators |
Trading Style: | Intraday MT4 Indicators |
Trading Instruments: | Share Stocks MT4 Indicators Indices Market MT4 Indicators Commodity Market MT4 Indicators Stock Market MT4 Indicators Cryptocurrency MT4 Indicators Forex MT4 Indicators |
Indicator Overview
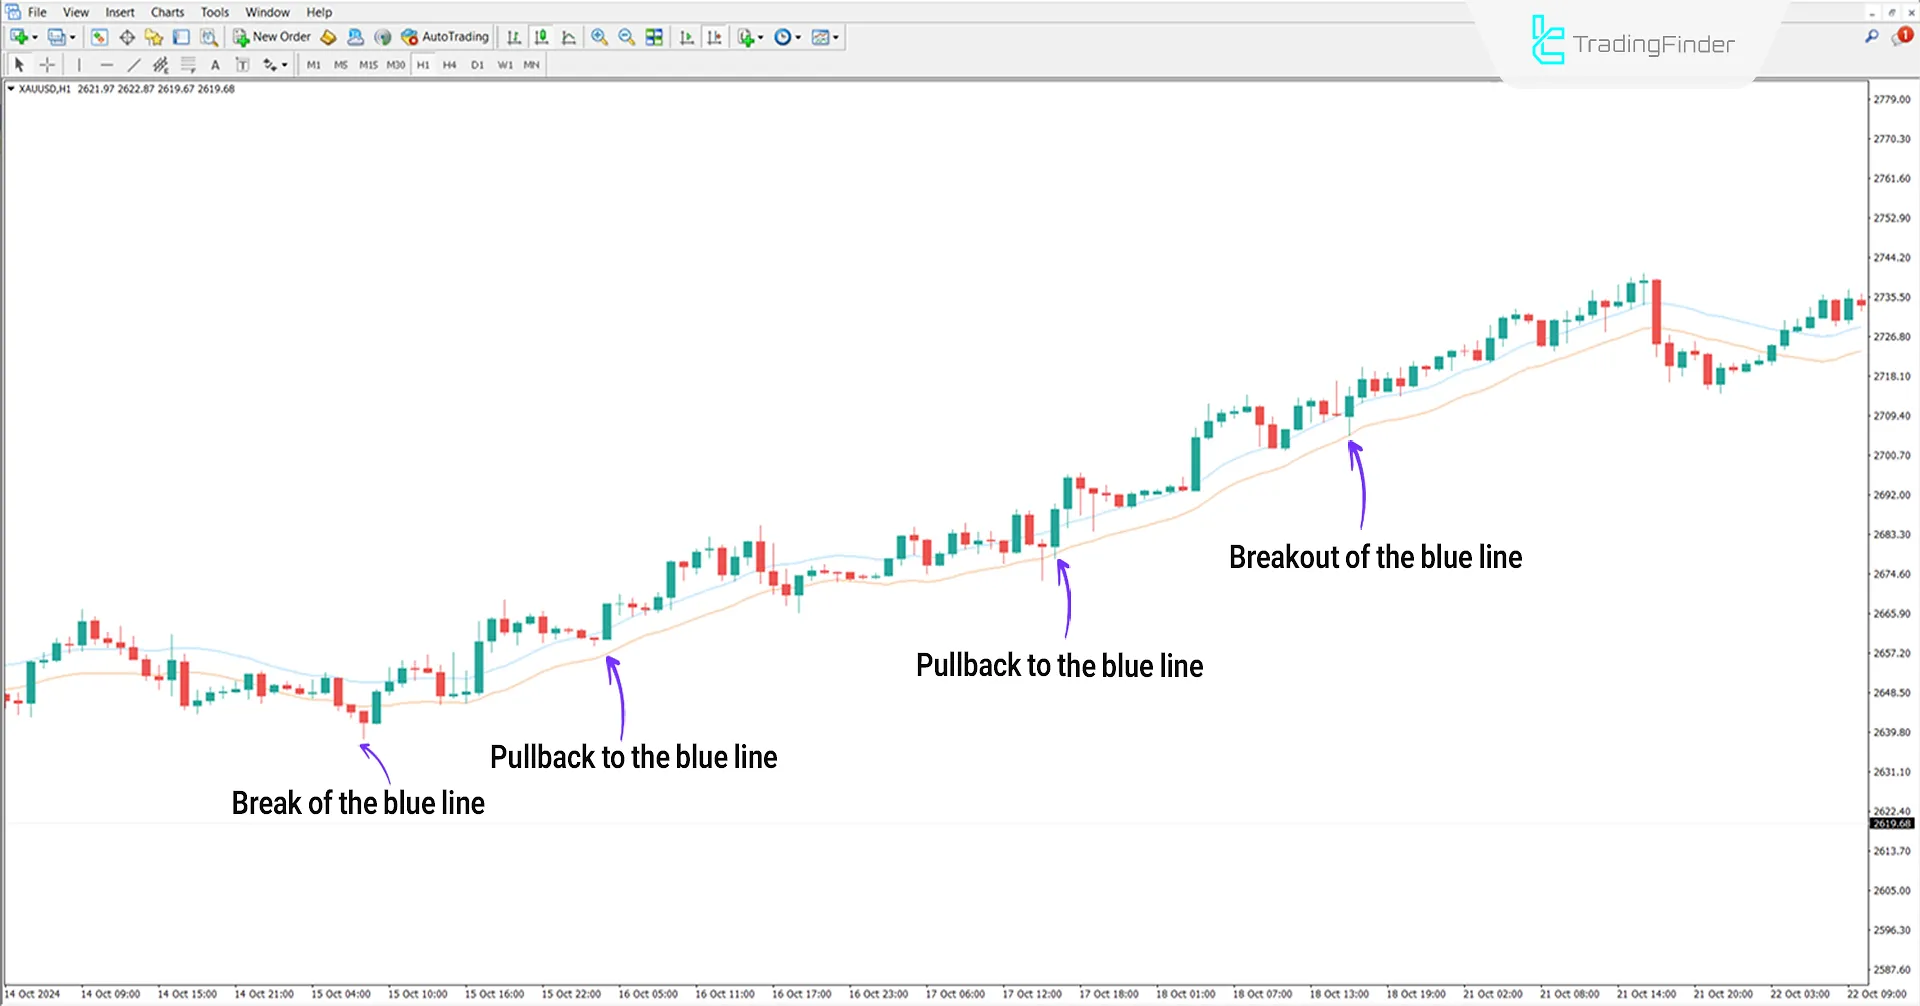
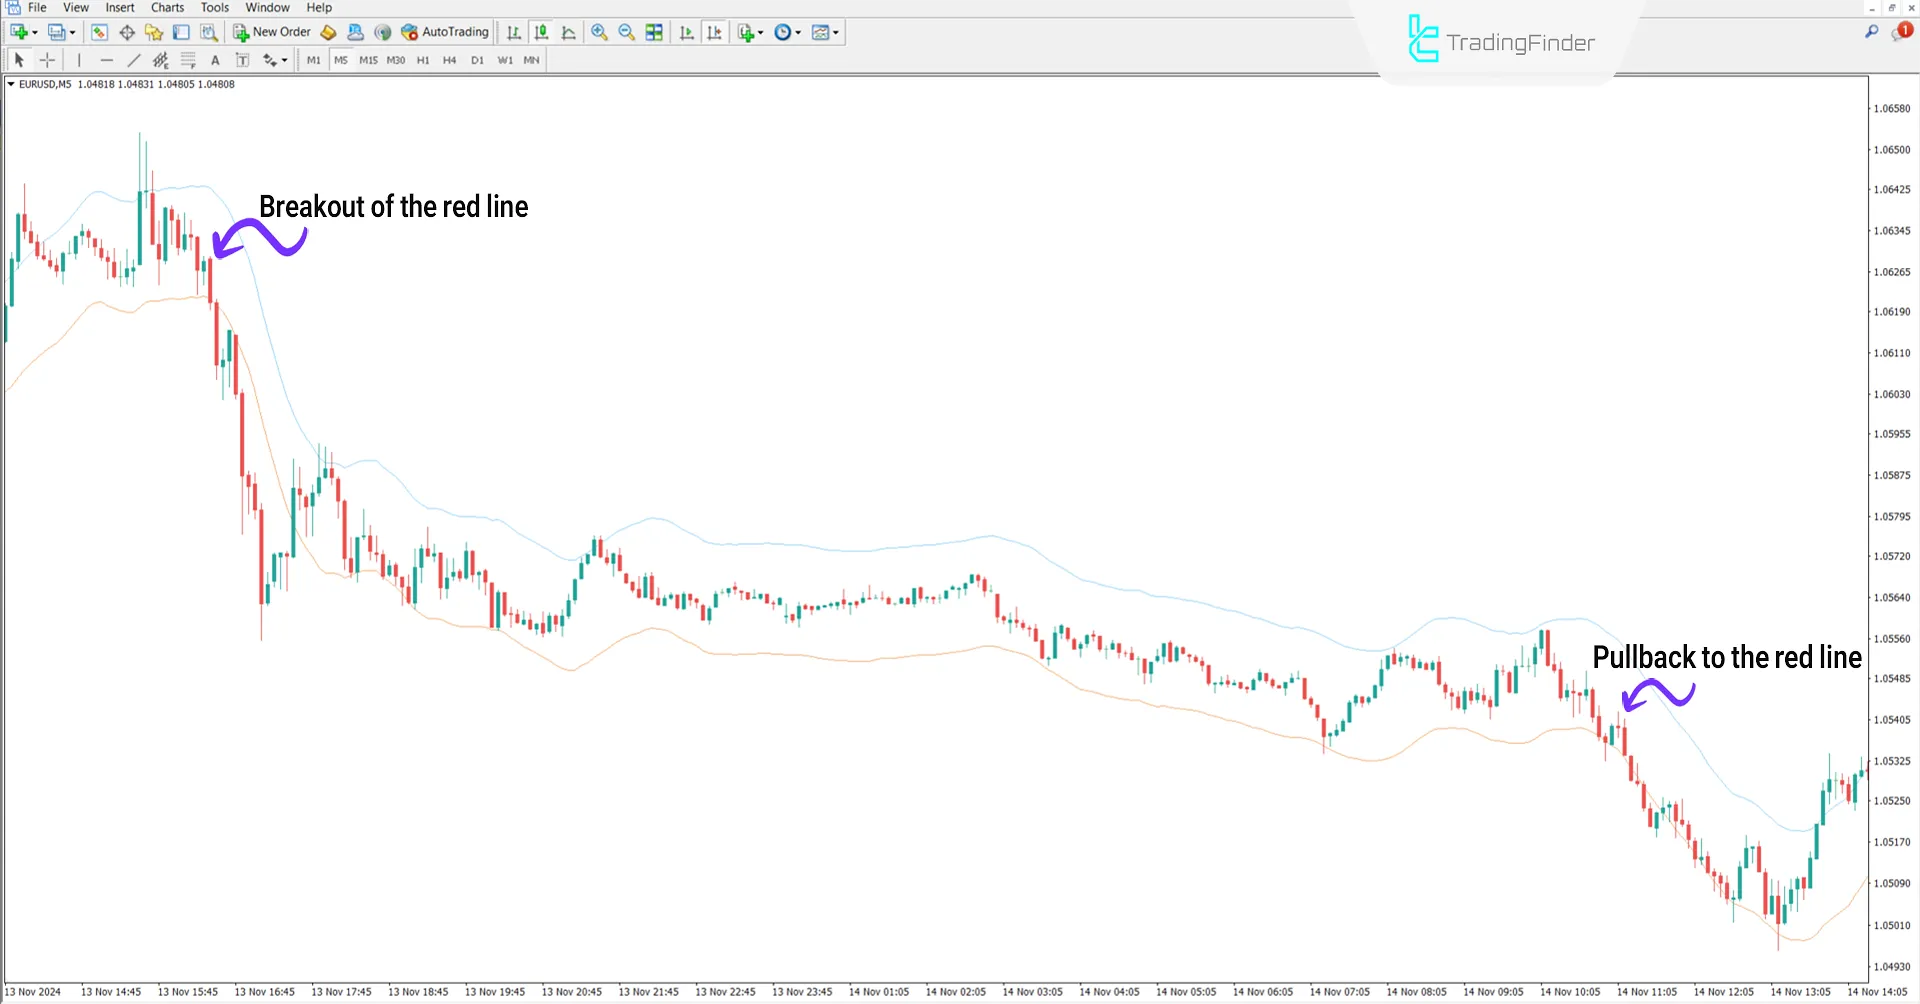
The Buy and Sell conditions in the Envelopes Indicator occur when the price crosses the red or blue lines. If the price breaks these lines and then reverses back, the likelihood of a trend reversal increases.
Uptrend Conditions
The chart below shows the price of Gold (XAU/USD) on the 1-hour timeframe. A breakout or return to the blue line can provide Entry Signals for traders.

Downtrend Conditions
The image below shows the price chart of the EUR/USD pair on the 5-minute timeframe. The indicator provides Entry Signals when the price breaks or reverses to the red line.

Indicator Settings
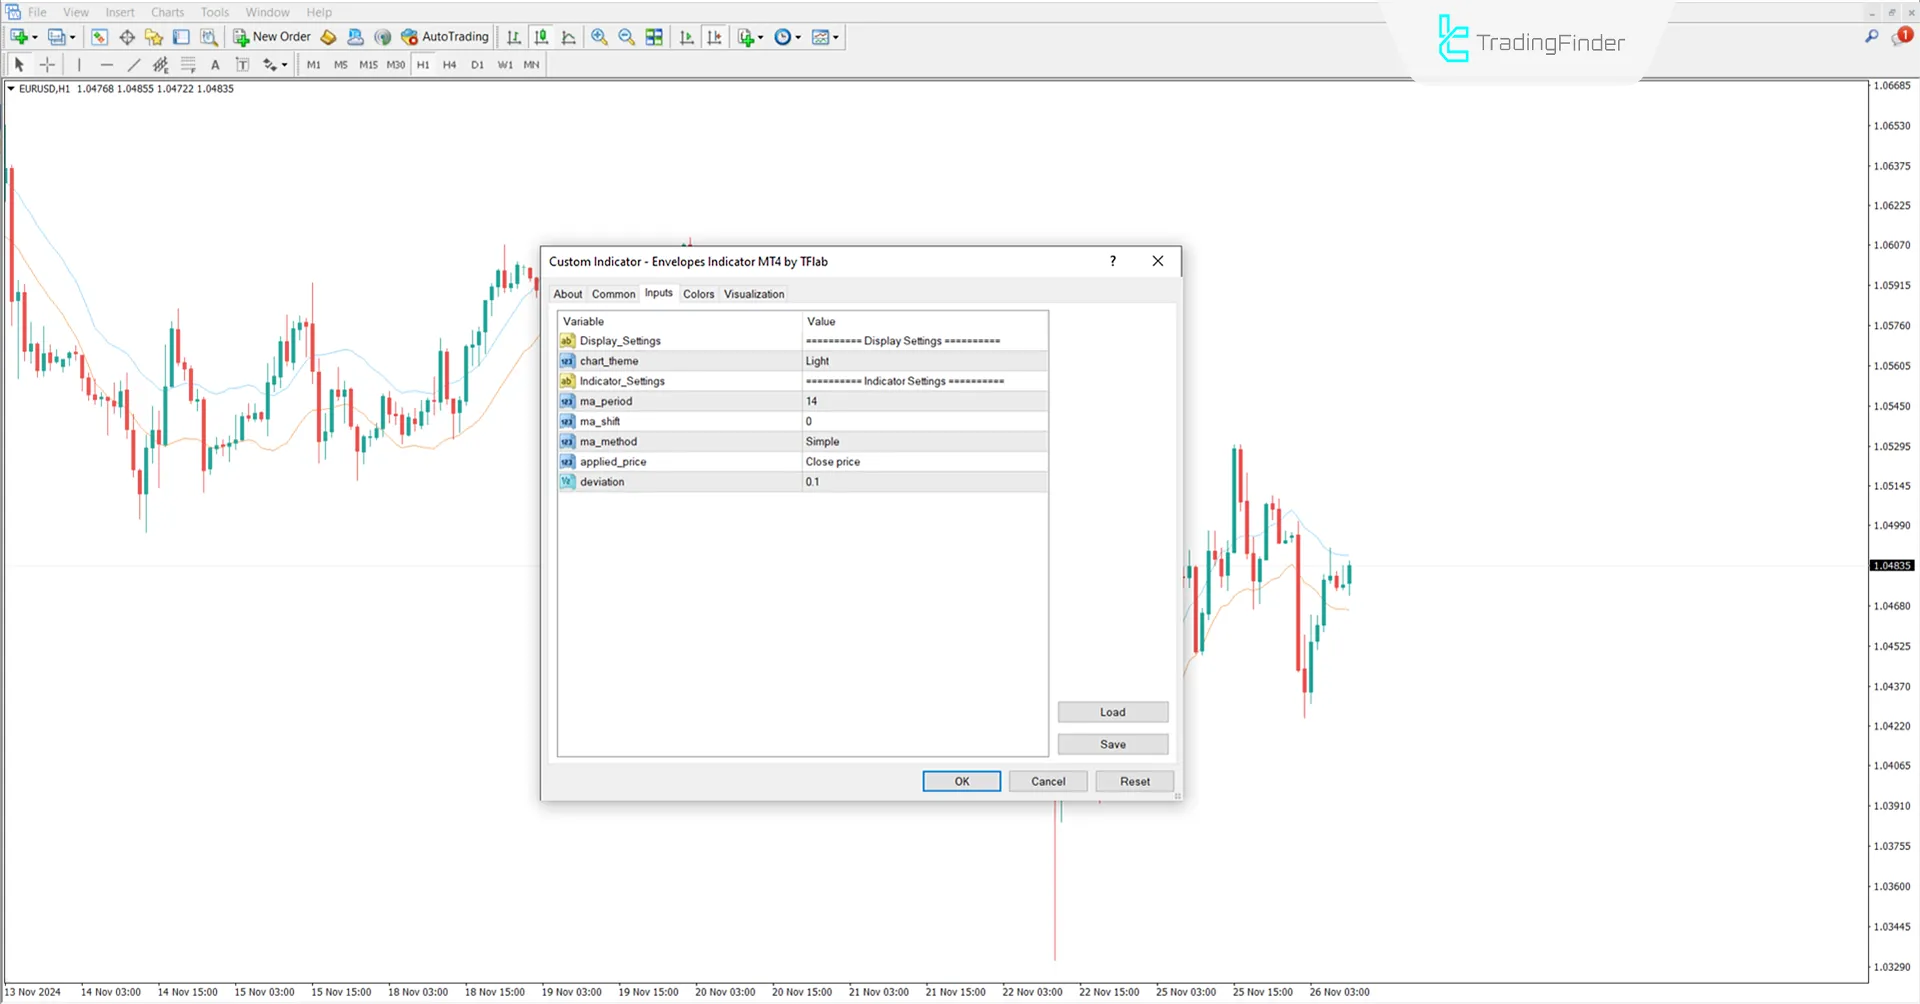
The following image provides details on how to configure the settings of the Envelopes indicator in the MetaTrader 4 platform:

- Chart theme: Chart theme;
- MA period: Moving Average (MA) period to 14;
- MA shift: Moving Average (MA) shift to 0;
- MA method: Moving Average (MA) method;
- Applied price: Applied price;
- Deviation: Deviation.
Conclusion
The Envelopes MetaTrader4 Indicator operates as a multi timeframe tool, identifying trend reversal points based on breakouts or reversals within its range.
It provides suitable Entry Signals in both uptrends and downtrends.
Envelopes MT4 PDF
Envelopes MT4 PDF
Click to download Envelopes MT4 PDFWhat is the appropriate timeframe for using this indicator?
This indicator is multi-timeframe and can be applied across all timeframes.
Does this indicator only provide signals when the trend reverses to the blue and red lines?
No, this tool provides signals not only when the price reverses to the blue and red lines but also when these lines are broken.


