![Nen Star Harmonic Pattern Indicator for MT4 Download - [TradingFinder]](https://cdn.tradingfinder.com/image/361085/4-85-en-nen-star-harmonic-pattern-mt4-1.webp)
![Nen Star Harmonic Pattern Indicator for MT4 Download - [TradingFinder] 0](https://cdn.tradingfinder.com/image/361085/4-85-en-nen-star-harmonic-pattern-mt4-1.webp)
![Nen Star Harmonic Pattern Indicator for MT4 Download - [TradingFinder] 1](https://cdn.tradingfinder.com/image/361087/4-85-en-nen-star-harmonic-pattern-mt4-2.webp)
![Nen Star Harmonic Pattern Indicator for MT4 Download - [TradingFinder] 2](https://cdn.tradingfinder.com/image/361086/4-85-en-nen-star-harmonic-pattern-mt4-3.webp)
![Nen Star Harmonic Pattern Indicator for MT4 Download - [TradingFinder] 3](https://cdn.tradingfinder.com/image/361088/4-85-en-nen-star-harmonic-pattern-mt4-4.webp)
On July 1, 2025, in version 2, alert/notification and signal functionality was added to this indicator
The Nen Star Harmonic Pattern Indicator is one of the advanced harmonic patterns in technical analysis, based on Fibonacci ratios. This indicator is used to identify potential price reversal zones.
The pattern consists of five main points labeled X, A, B, C, and D and can appear in both bullish and bearish trends.
In the bullish case, the pattern forms a shape resembling the letter "M," while in the bearish case, it has a structure similar to the letter "W."
Nen Star Harmonic Pattern Indicator Specifications Table
The key features of the Nen Star Harmonic Pattern Indicator are presented in the table below.
Indicator Categories: | Support & Resistance MT4 Indicators Chart & Classic MT4 Indicators Harmonic MT4 Indicators |
Platforms: | MetaTrader 4 Indicators |
Trading Skills: | Intermediate |
Indicator Types: | Reversal MT4 Indicators |
Timeframe: | Multi-Timeframe MT4 Indicators |
Trading Style: | Intraday MT4 Indicators |
Trading Instruments: | Forward Market MT4 Indicators Stock Market MT4 Indicators Cryptocurrency MT4 Indicators Forex MT4 Indicators |
Indicator Overview
In the structure of the Nen Star Harmonic Pattern, the initial movement begins from point X to A, followed by a retracement to point B. The next step is a movement toward point C, which should cover between 113% to 141.4% of the AB leg.
Next, the price moves to point D, which typically lies between 127.2% and 200% of the AB leg. Point D is identified as the Potential Reversal Zone (PRZ), where traders can find entry or exit signals based on price behavior.
Indicator in Bullish Trend
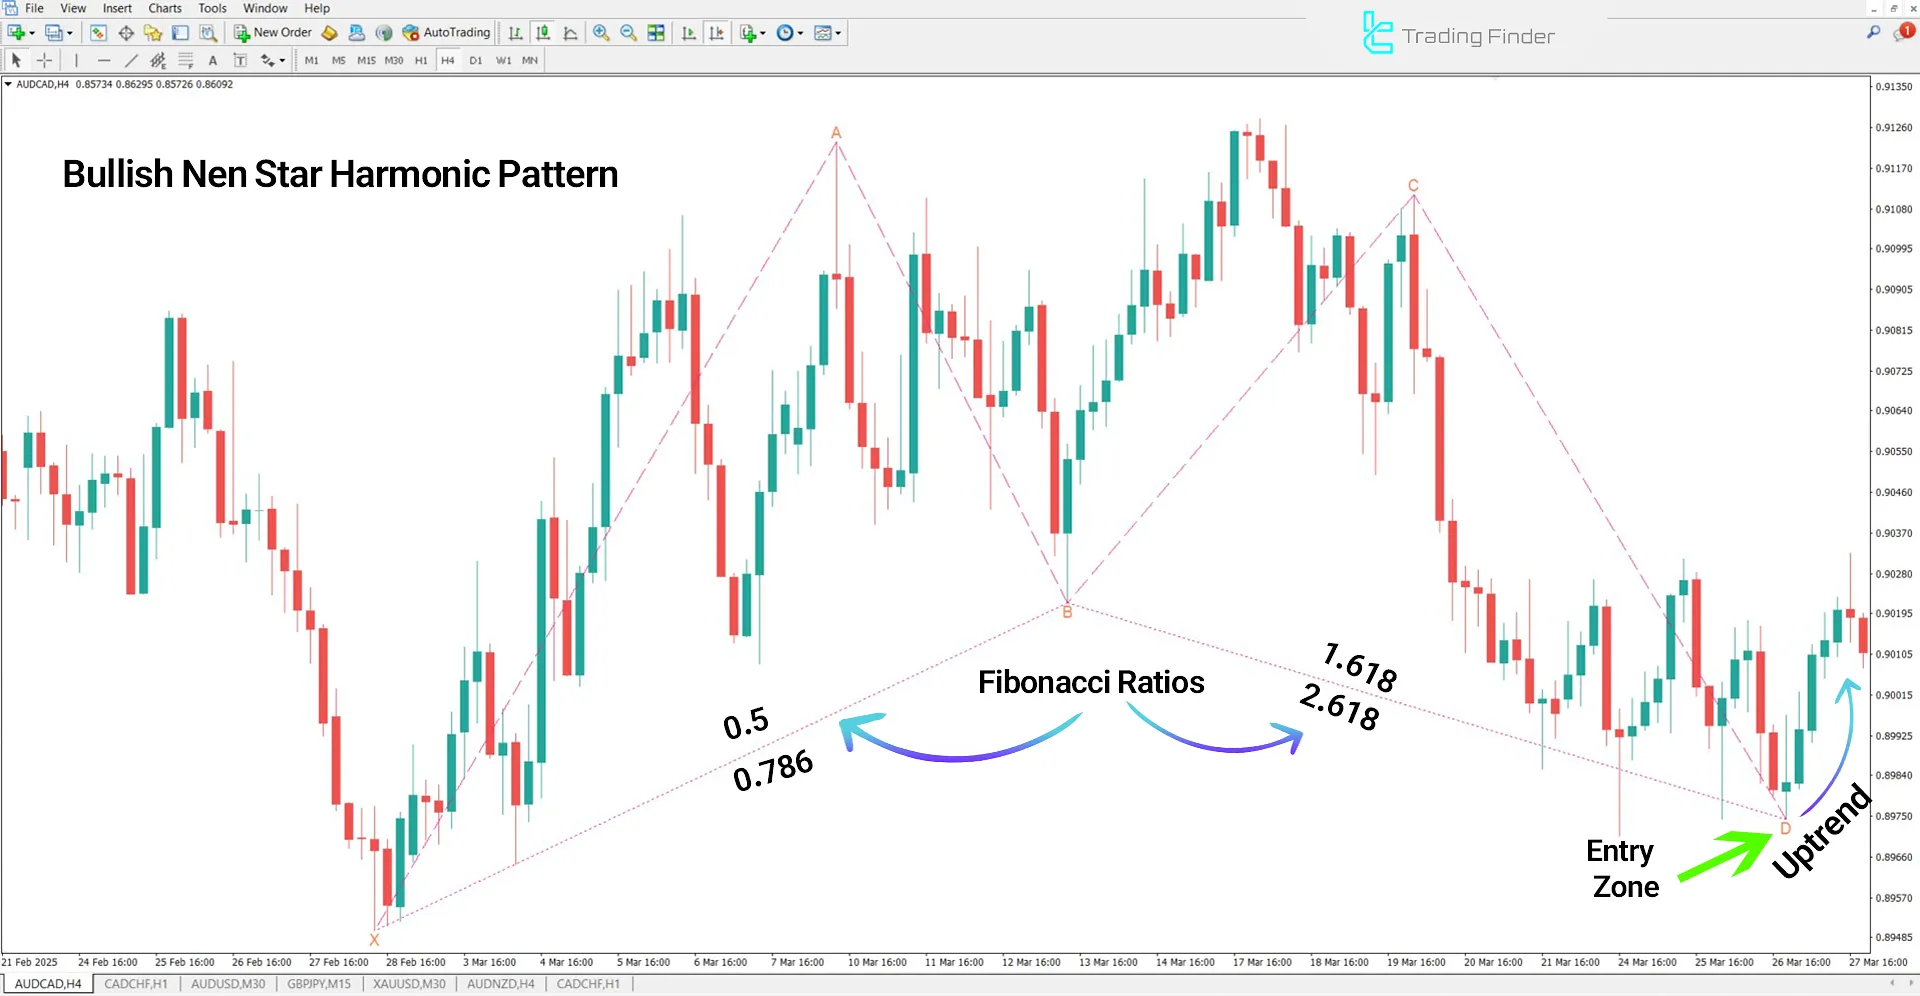
In the bullish Nen Star pattern, the price initially moves from point X to A, followed by a retracement toward point B. Then, the price enters an expansion phase, with wave C extending between 113% to 141.4% of the AB leg.
The price continues its movement to point D, typically within the range of 127.2% to 200% of the AB leg.
On the 4-hour chart of the AUD/CAD pair, the price reaches the PRZ zone at point D, and signs of a potential trend reversal and the beginning of a new bullish trend are observed.

Indicator in Bearish Trend
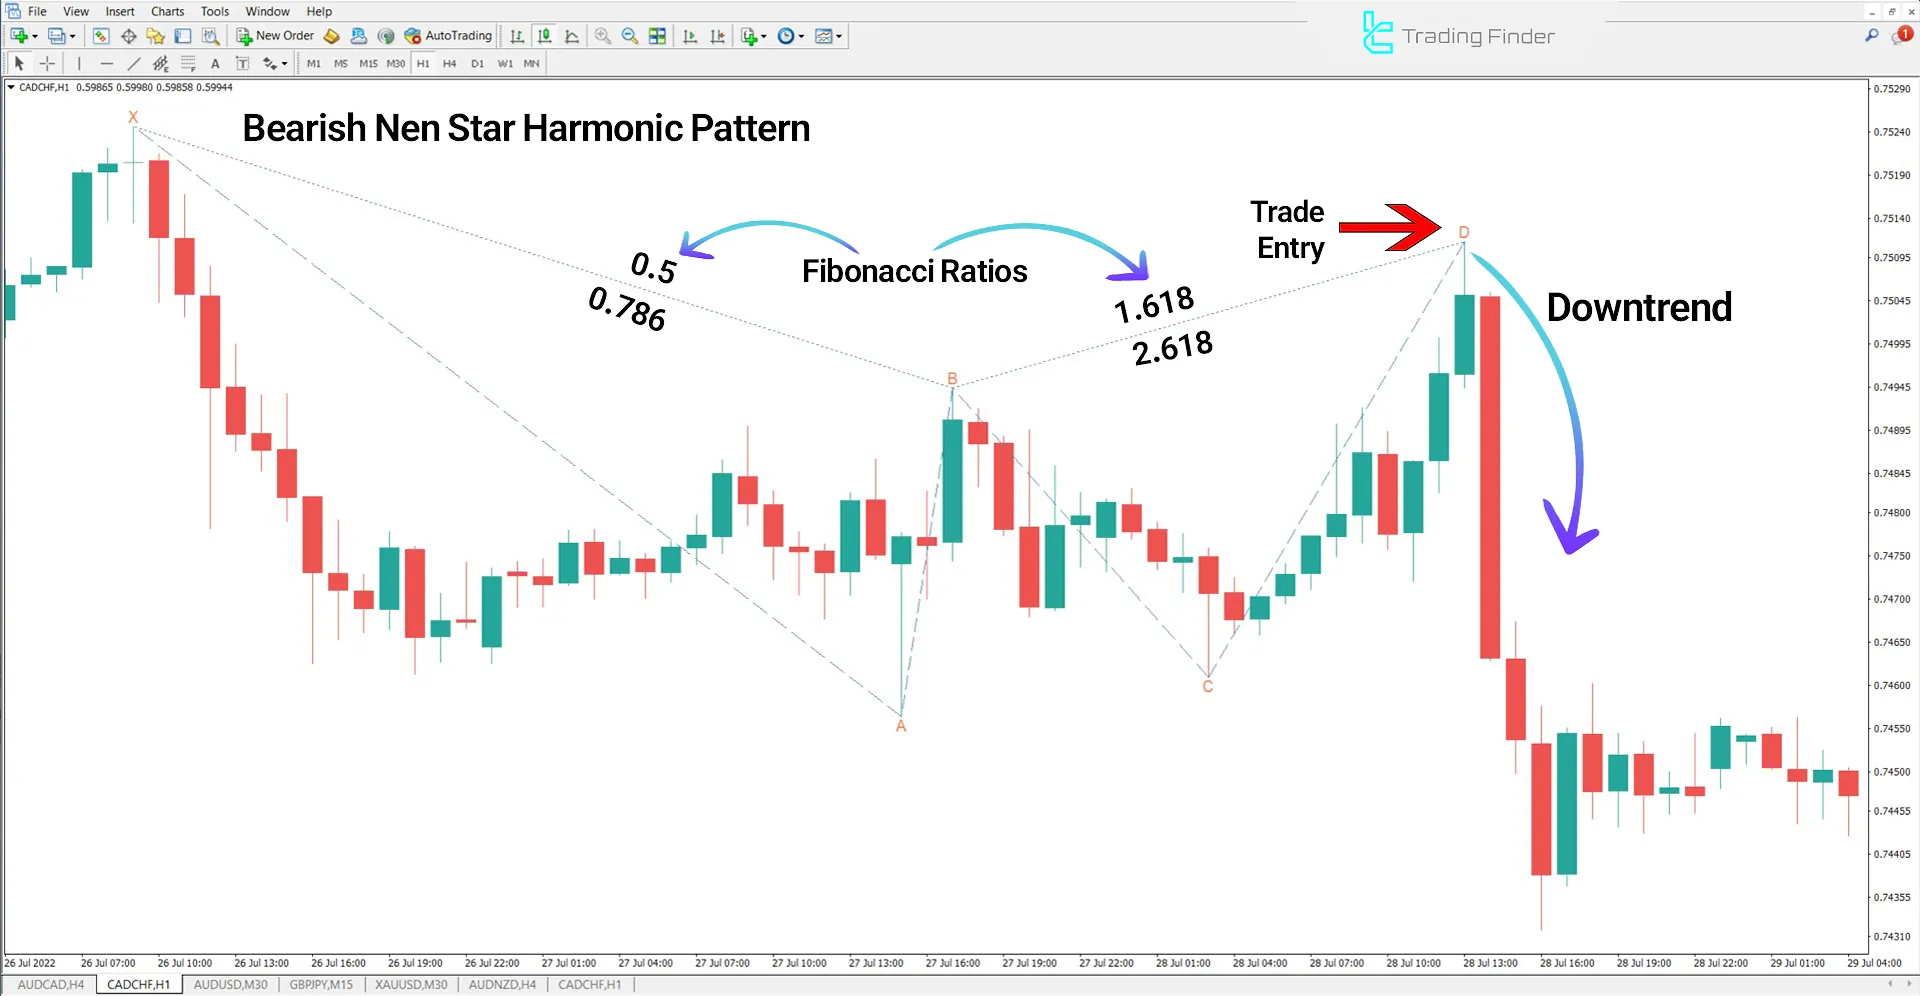
In the 1-hour chart of the CAD/CHF pair, the bearish Nen Star pattern is formed as the price moves from X to A and then retraces to point B, before entering a temporary upward movement to point C.
This wave typically extends between 113% to 141.4% of the AB leg. Afterward, the price drops toward point D, which usually lies between 127.2% and 200% of the AB leg.
In this structure, the chart takes a shape similar to the letter "W," with point D recognized as the Potential Reversal Zone (PRZ).

Indicator Settings
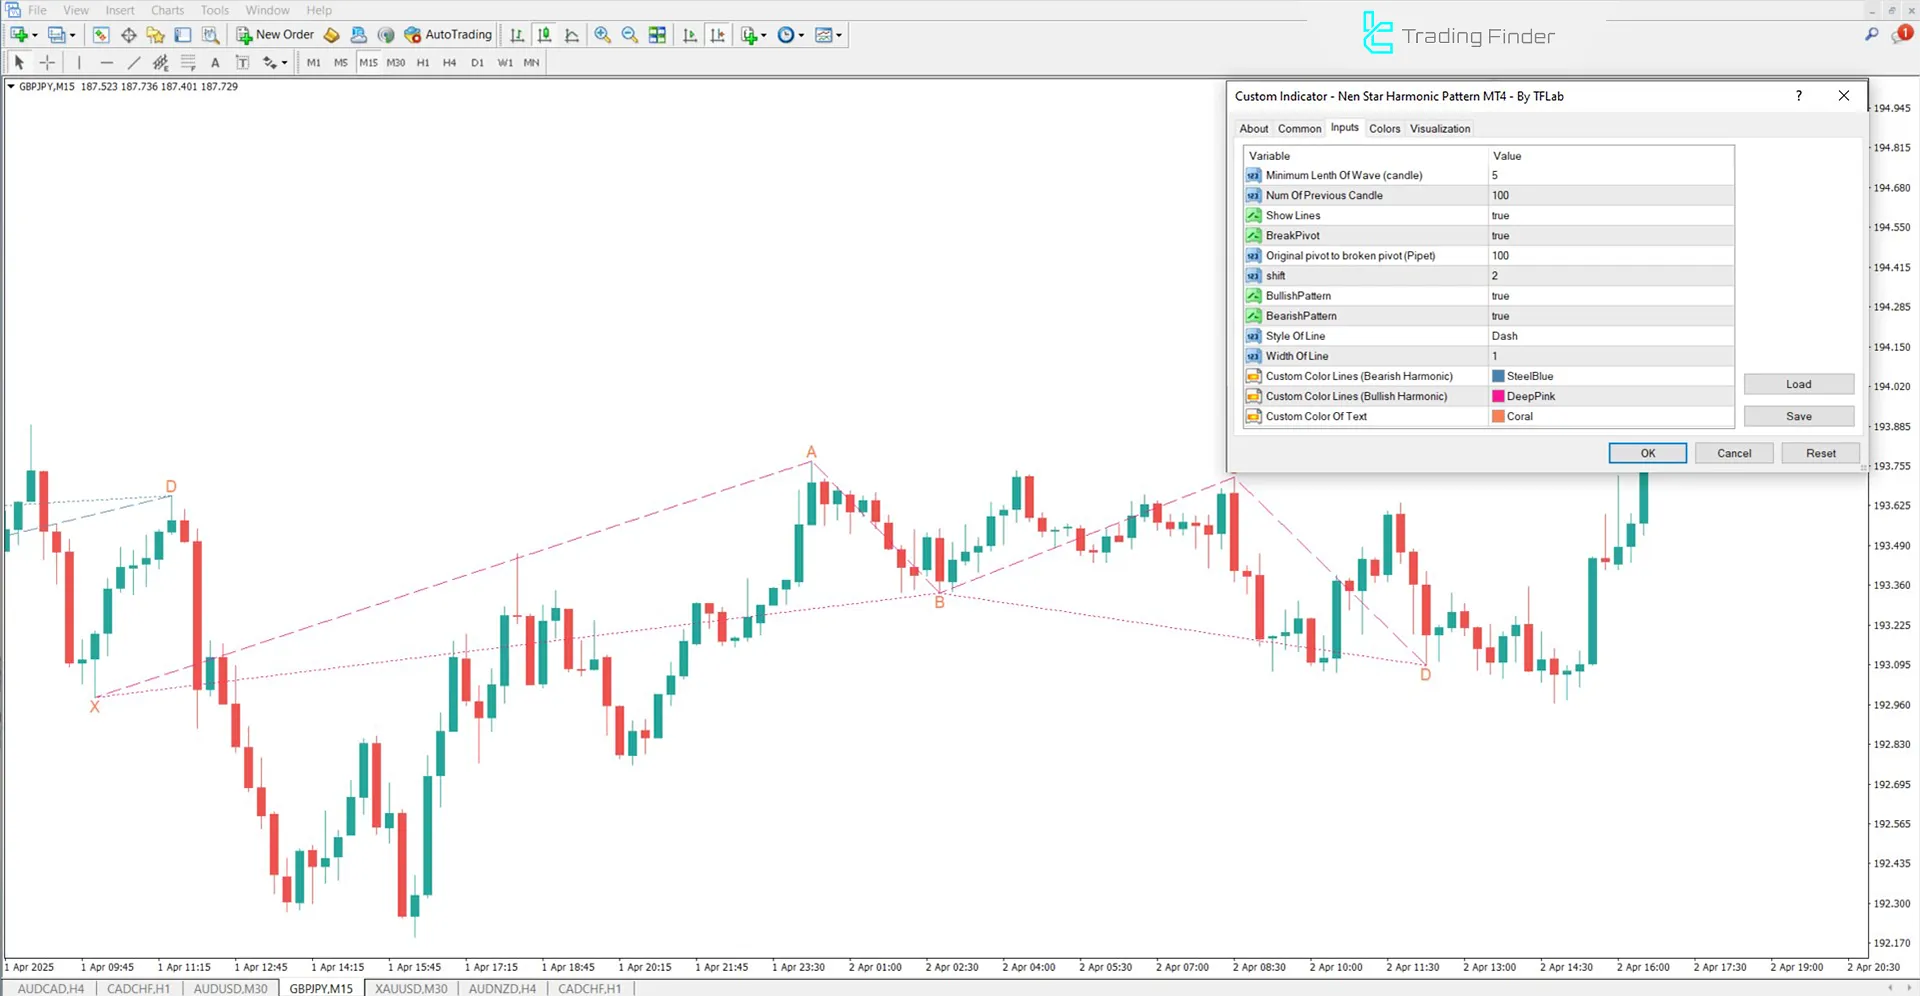
The settings section of the Nen Star Harmonic Pattern Indicator is displayed below:

- Minimum Length Of Wave (candle): Minimum number of candles to detect a wave
- Num Of Previous Candle: Number of previous candles used in calculations
- Show Lines: Toggle pattern lines on/off
- BreakPivot: Enable pivot break detection
- Original pivot to broken pivot (Pipet): Distance between the original and broken pivot (in pipets)
- Shift: Shift amount for visual positioning on the chart
- BullishPattern: Enable detection of bullish patterns
- BearishPattern: Enable detection of bearish patterns
- Style Of Line: Choose the line style
- Width Of Line: Set the line thickness
- Custom Color Lines (Bearish Harmonic): Color for bearish pattern lines
- Custom Color Lines (Bullish Harmonic): Color for bullish pattern lines
- Custom Color Of Text: Set the text color
Conclusion
The Nen Star Harmonic Pattern Indicator can be a highly efficient tool for predicting potential price reversal points with high accuracy.
Using this pattern alongside multiple time frame analysis, confirming support and resistance levels, and incorporating complementary styles like price action or candlestick reading can significantly enhance the validity of analyses.
Nen Star Harmonic Pattern MT4 PDF
Nen Star Harmonic Pattern MT4 PDF
Click to download Nen Star Harmonic Pattern MT4 PDFWhat is the Nen Star Harmonic Pattern Indicator used for in technical analysis?
This indicator identifies the Nen Star Harmonic Pattern using Fibonacci ratios, marking potential price reversal zones in financial markets (Forex, stocks, and crypto).
What differentiates the Nen Star Pattern from other harmonic patterns?
The main distinction lies in the specific wave structure and the use of AB extension ratios to determine points C and D.


