


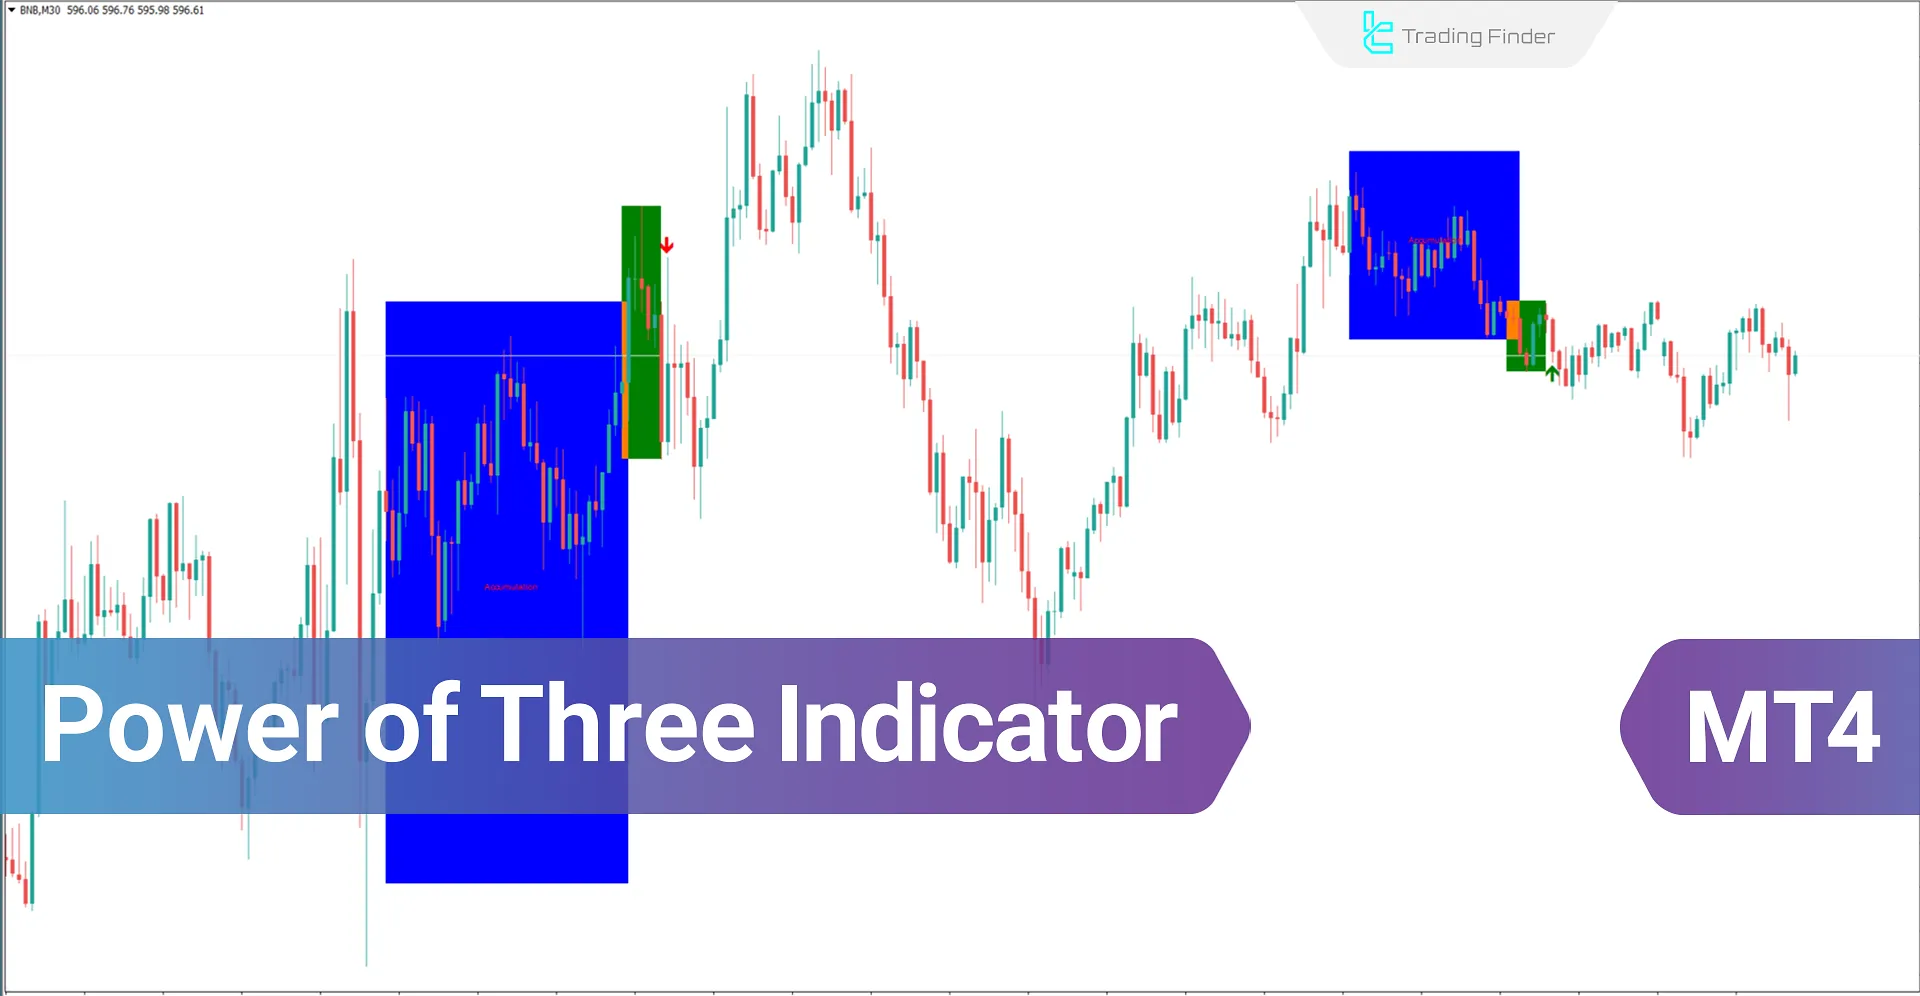
The Power of Three Indicators is based on three important concepts from Smart Money Accumulation, Manipulation, and Distribution. Each one, in turn, determines price stability, liquidity in trading, and phase identification (direction) of the price.
With the help of this MT4 Smart Money indicator, traders can identify suitable trading opportunities in the direction of the main trend of Smart Money.
Blue areas represent the accumulation zone, and green areas represent the manipulation zone.
Finally, a green arrow indicates a buying opportunity (Long), and a red arrow signals a selling opportunity (Short).
Indicator Specifications Table
Indicator Categories: | ICT MT4 Indicators Smart Money MT4 Indicators Liquidity MT4 Indicators |
Platforms: | MetaTrader 4 Indicators |
Trading Skills: | Intermediate |
Indicator Types: | Reversal MT4 Indicators |
Timeframe: | Multi-Timeframe MT4 Indicators |
Trading Style: | Day Trading MT4 Indicators Scalper MT4 Indicators |
Trading Instruments: | Share Stocks MT4 Indicators Forward Market MT4 Indicators Commodity Market MT4 Indicators Stock Market MT4 Indicators Cryptocurrency MT4 Indicators Forex MT4 Indicators |
Indicator at a Glance
The Power of Three can identify regions in the price chart with high profit potential. These regions are aligned with the main price trend.
This indicator can be used in all financial markets, including cryptocurrency and forex. It is commonly used in trading strategies based on Price Action, such as Smart Money and ICT.
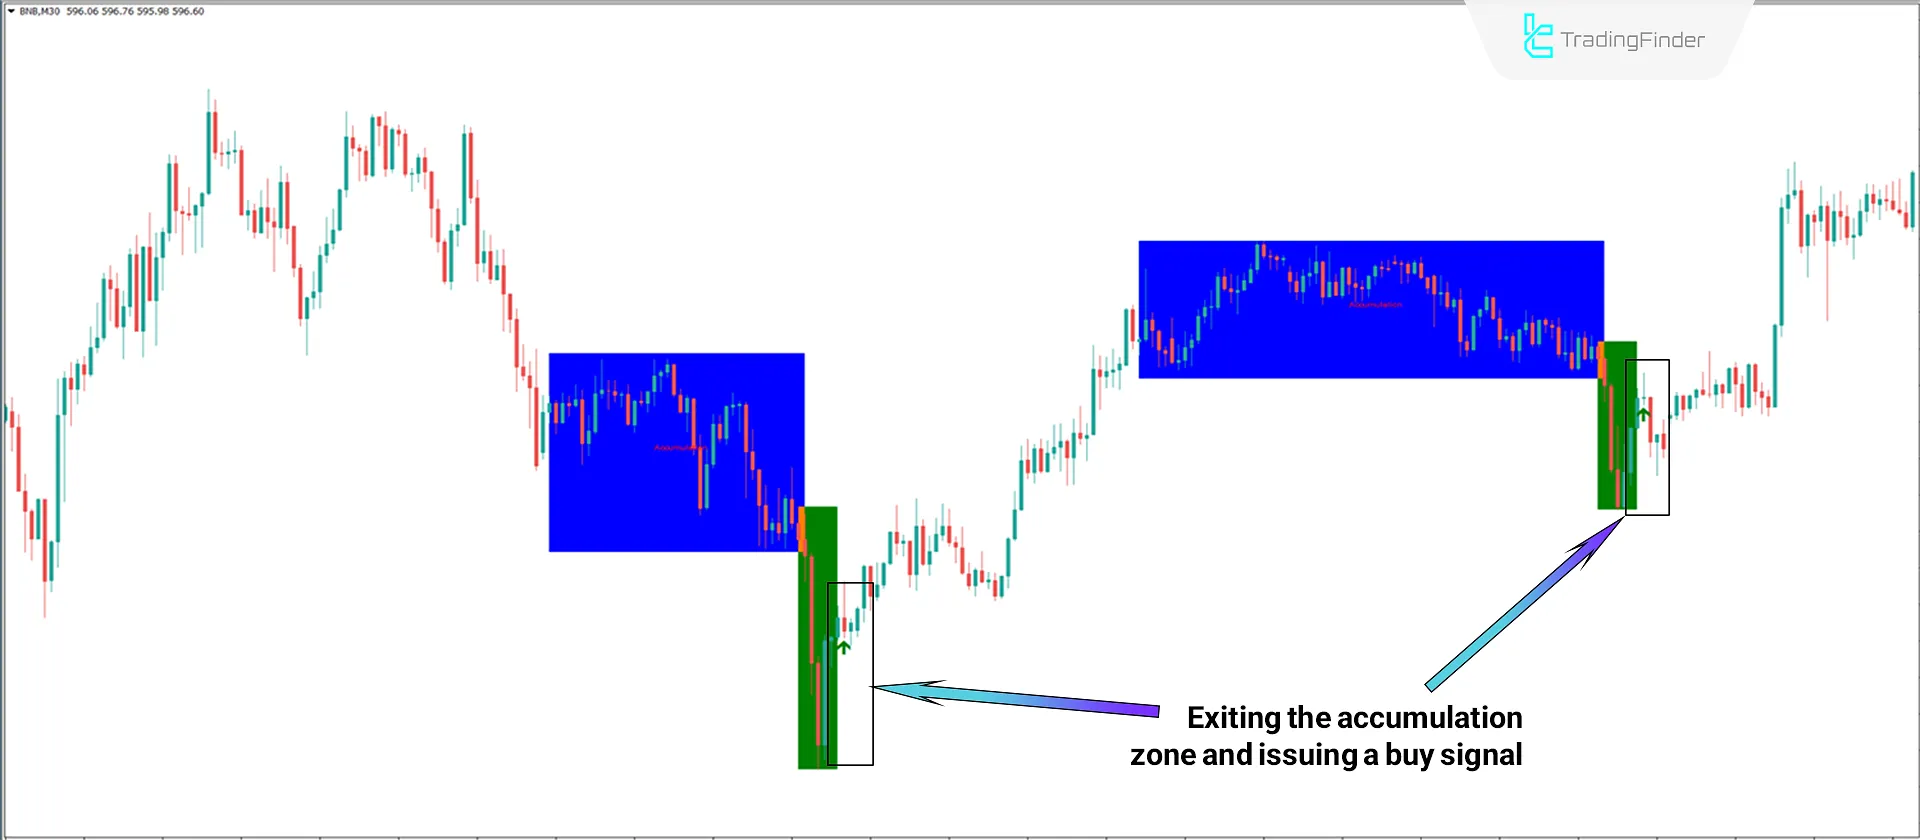
Power of Three in an Uptrend
According to the 30-minute price chart of Binance Coin (BNB), if the difference between the top and bottom of the blue box is less than the Average True Range (ATR), a distribution range is identified.
Once the price exits this range, it enters the manipulation phase, and immediately after, a buy signal (Long) is issued.
The ATR measures the average market volatility over the trader's desired period.
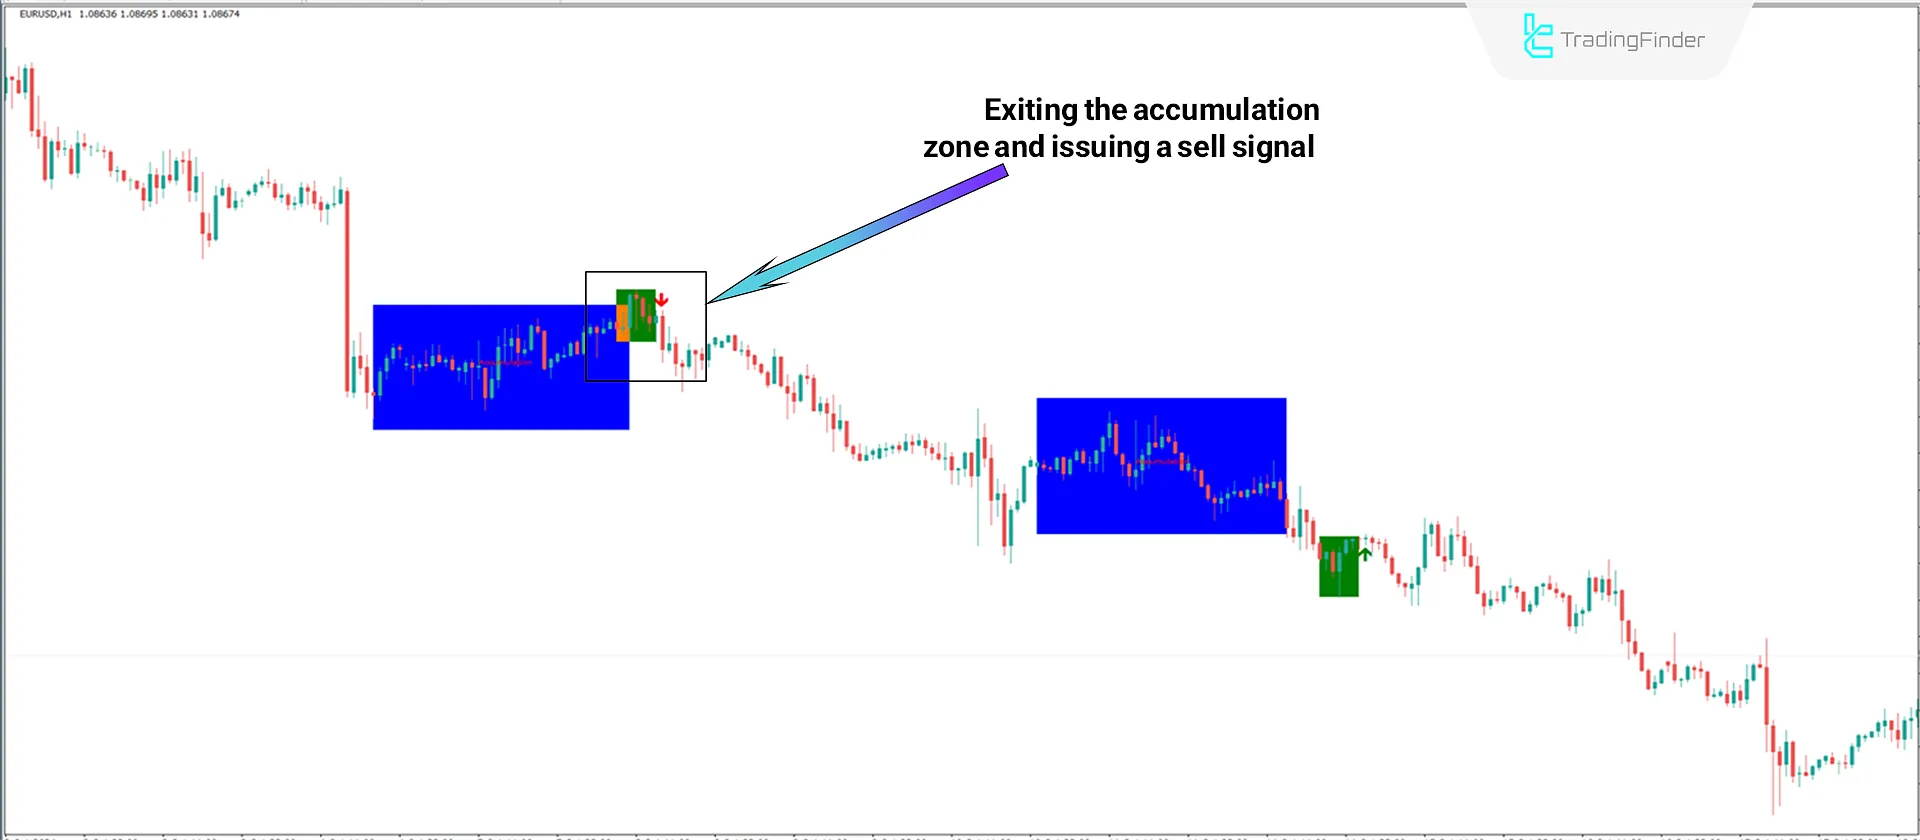
Power of Three in a Downtrend
The red arrow on the EUR/USD price chart in the 1-hour timeframe signals a sell (Short) trade.
This signal is in the direction of the main price trend and is issued after the price exits the green manipulation range.
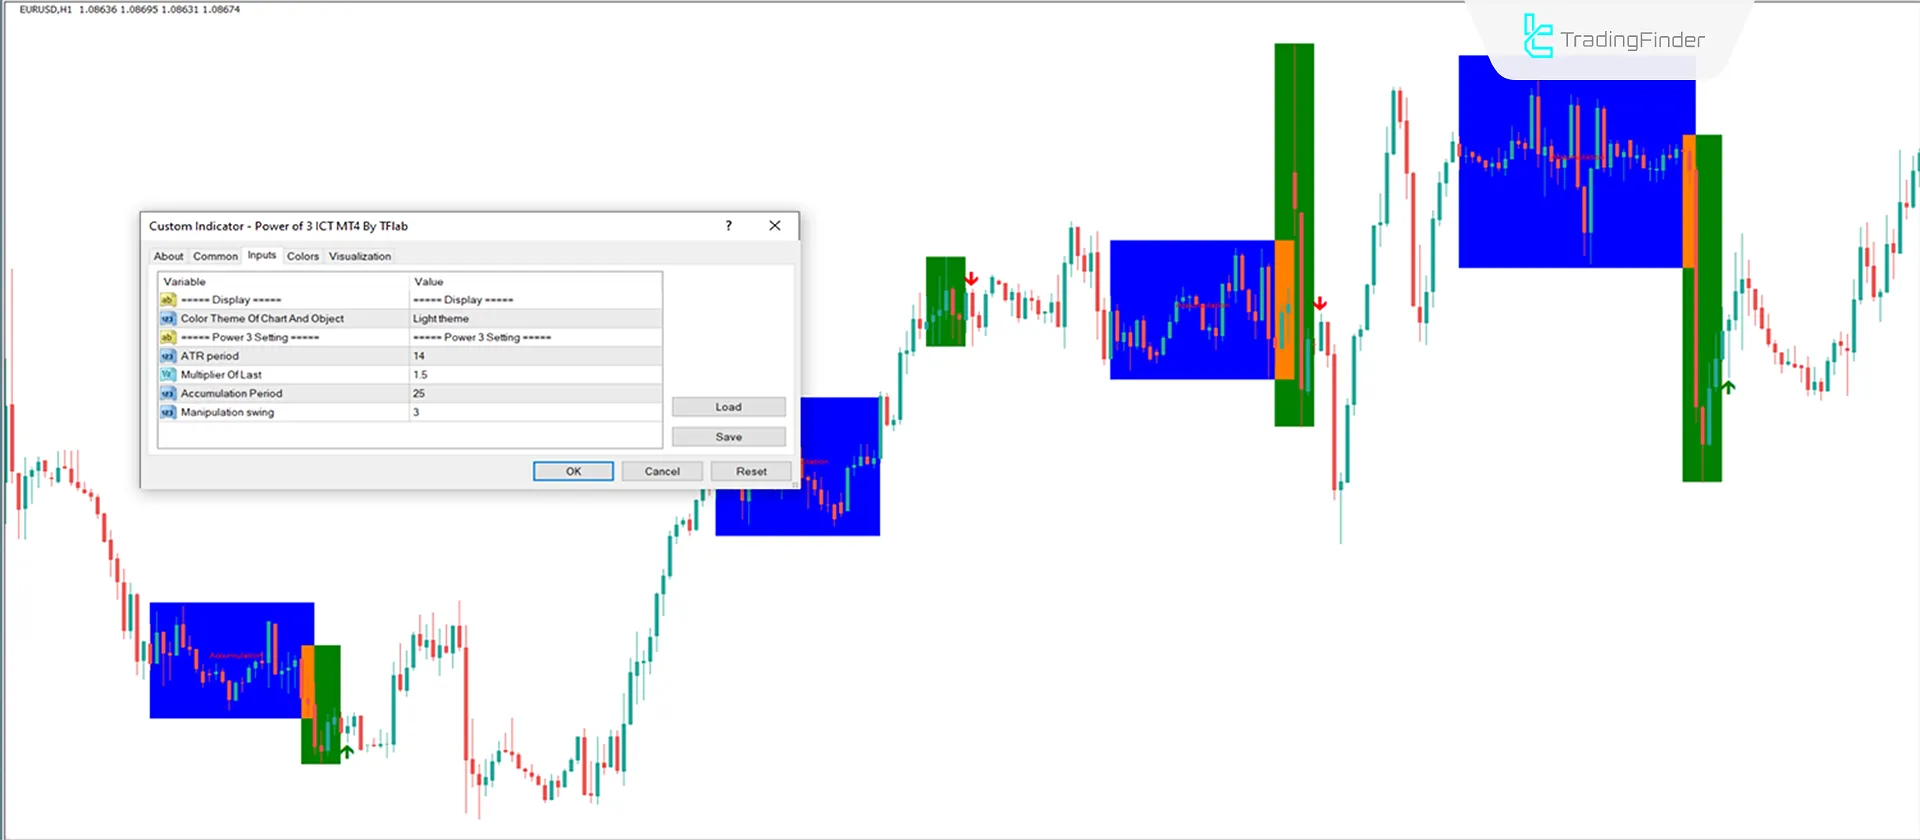
Indicator Settings
- Theme: Indicator theme settings;
- ATR Period: 14-period average true range;
- A multiplier of Last: 1.5 times the last ATR period;
- Accumulation Period: 25-period accumulation phase;
- Manipulation Swing: 3-point manipulation range.
Conclusion
The Power of Three Indicators for MetaTrader 4 is suitable for trading strategies such as Smart Money or ICT. This tool can be used in all financial markets, including stocks, forex, and cryptocurrency.
This signal and prediction indicator for MetaTrader 4, based on the Power of Three strategy, divides the price chart into three phases, accumulation, manipulation, and distribution. Finally, it shows buy and sell signals (Long & Short) with a green or red arrow.
Power Three Smart Money MT4 PDF
Power Three Smart Money MT4 PDF
Click to download Power Three Smart Money MT4 PDFWhat is the Average True Range (ATR)?
This indicator measures the price volatility over a 14-candle period.
When does the Power of Three Indicators issue buy and sell signals?
After the price exits the accumulation zone, the manipulation phase is identified, and the indicator issues buy and sell signals using arrows.
It would have been a good idea to add alert to this indicator. Kindly do us such a favor

Thank you for your feedback! Alerts will soon be added to many of our indicators. To check whether this specific indicator already includes that feature, please contact our support team.


