![Vinini LRMA Color Indicator MT4 Download – Free – [TradingFinder]](https://cdn.tradingfinder.com/image/582265/13-227-en-vinini-lrma-color-mt4-01.webp)
![Vinini LRMA Color Indicator MT4 Download – Free – [TradingFinder] 0](https://cdn.tradingfinder.com/image/582265/13-227-en-vinini-lrma-color-mt4-01.webp)
![Vinini LRMA Color Indicator MT4 Download – Free – [TradingFinder] 1](https://cdn.tradingfinder.com/image/582270/13-227-en-vinini-lrma-color-mt4-02.webp)
![Vinini LRMA Color Indicator MT4 Download – Free – [TradingFinder] 2](https://cdn.tradingfinder.com/image/582268/13-227-en-vinini-lrma-color-mt4-03.webp)
![Vinini LRMA Color Indicator MT4 Download – Free – [TradingFinder] 3](https://cdn.tradingfinder.com/image/582264/13-227-en-vinini-lrma-color-mt4-04.webp)
The Vinini LRMA Color Indicator is a type of moving average that displays bullish, bearish, and ranging price movements. This trading tool uses the combination of Simple Moving Average (SMA) and Linear Regression features to identify trading signals. One of its key features is the color change of the indicator line under different market conditions.
When the price is in an uptrend, the line appears in one color, while in a downtrend it changes to another color. This shift serves as a signal for entry or exit, alerting the trader to potential trading opportunities.
Specifications Table of Vinini LRMA Color Indicator
The specifications of the Vinini LRMA Color Indicator are as follows.
Indicator Categories: | Price Action MT4 Indicators Trading Assist MT4 Indicators Moving Average MT4 Indicators |
Platforms: | MetaTrader 4 Indicators |
Trading Skills: | Elementary |
Indicator Types: | Reversal MT4 Indicators |
Timeframe: | Multi-Timeframe MT4 Indicators |
Trading Style: | Day Trading MT4 Indicators Scalper MT4 Indicators Swing Trading MT4 Indicators |
Trading Instruments: | Stock Market MT4 Indicators Cryptocurrency MT4 Indicators Forex MT4 Indicators |
Vinini LRMA Color Indicator at a Glance
The Vinini LRMA Color Indicator, by changing the color of the moving average, shows the current market trend.
These color shifts include:
- Green: Indicates an uptrend
- Red: Indicates a downtrend
- Yellow: Shows a neutral or ranging market
Start of an Uptrend
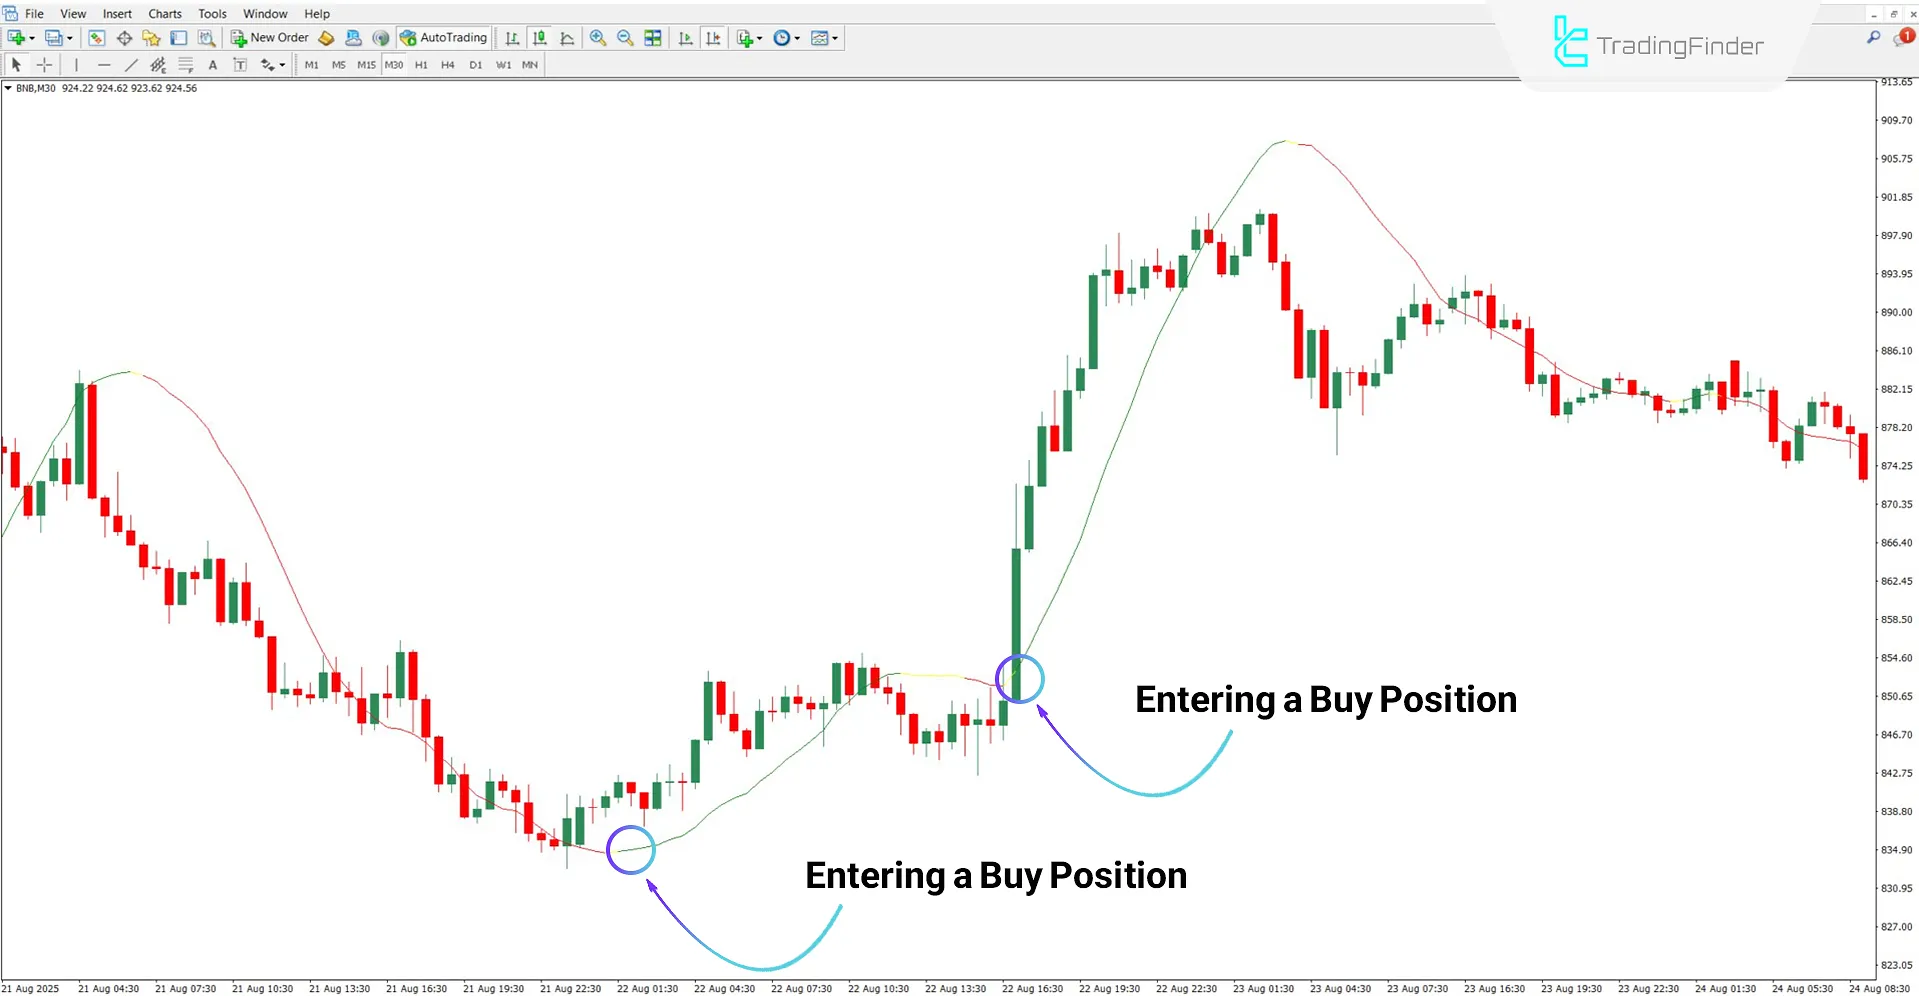
According to the Binance Coin (BNB) cryptocurrency, chart on the 30-minute timeframe, the moving average turning green indicates the start of an uptrend. As shown in the chart, the highlighted points can be considered suitable entry zones for buy trades.

Start of a Downtrend
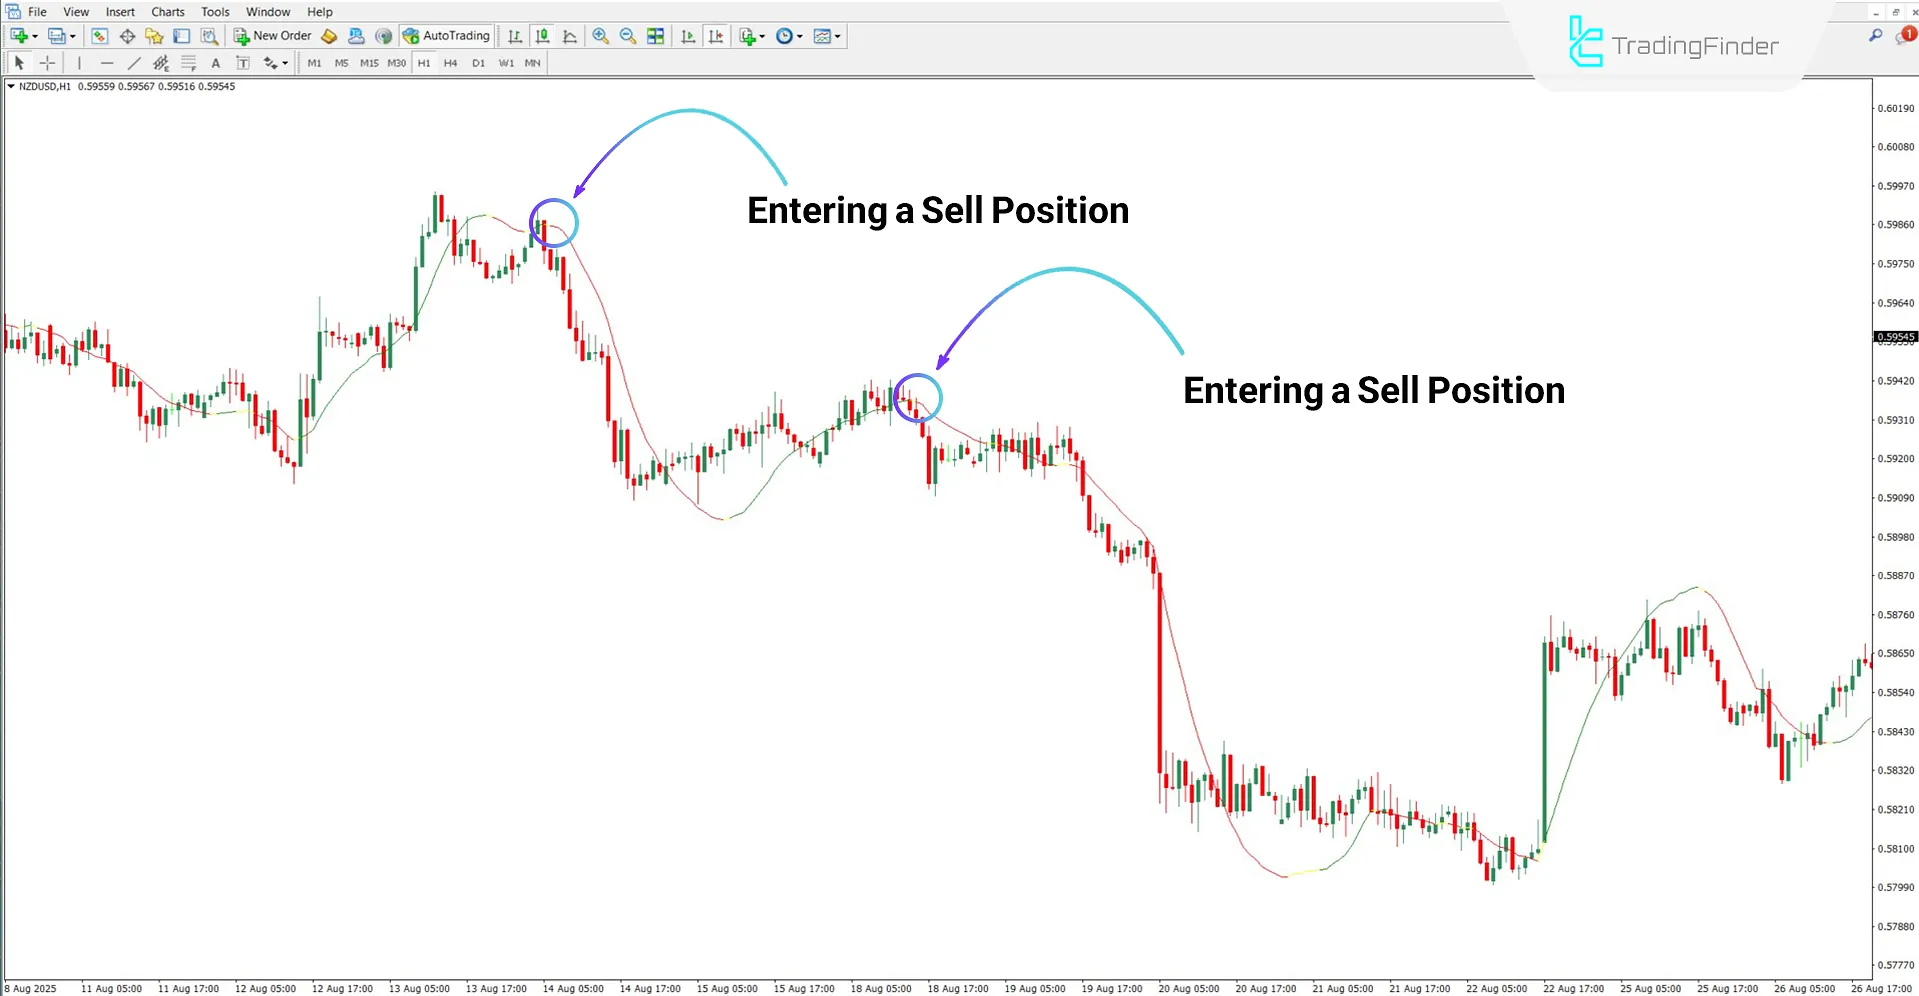
Based on the New Zealand Dollar to US Dollar (NZD/USD) chart, the moving average line turning red signals the beginning of selling pressure and a bearish market move. In such conditions, the marked areas on the chart can provide opportunities to enter sell trades and follow the downtrend.

Settings of Vinini LRMA Color Indicator
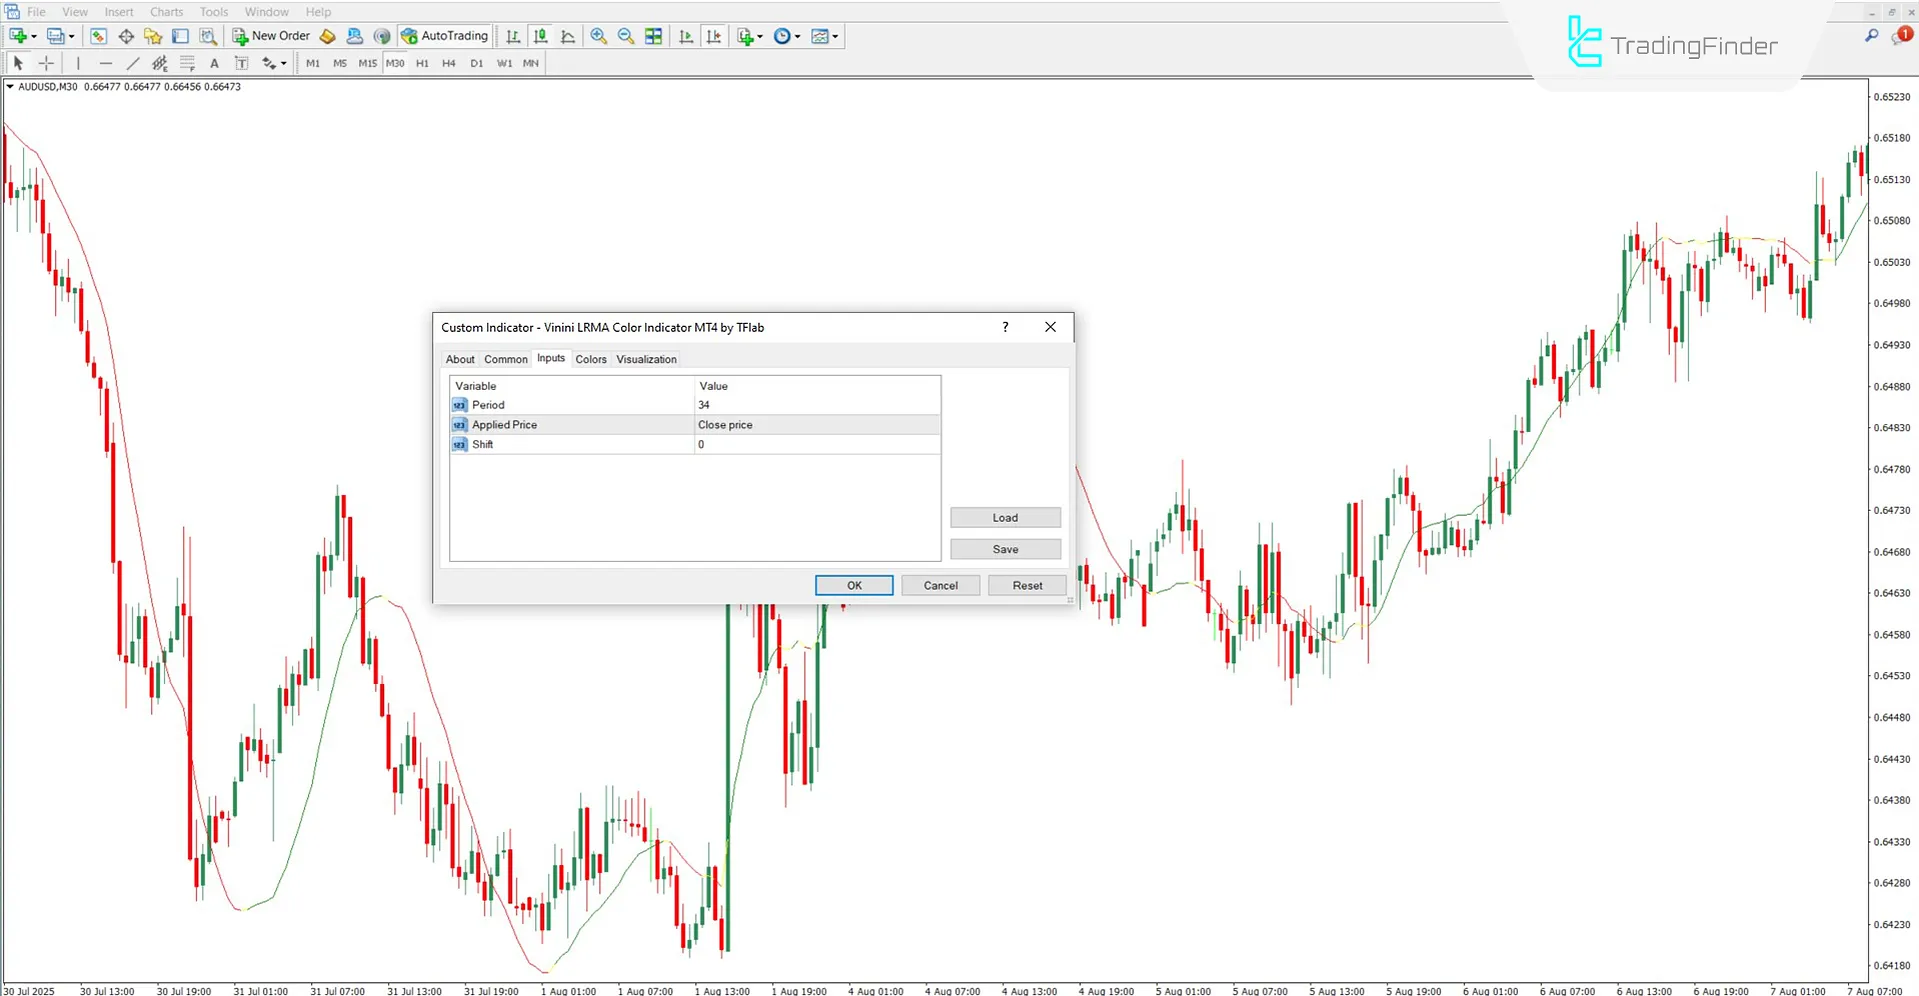
The settings of the Vinini LRMA Color Indicator are as follows:

- Period: Calculation period of the indicator
- Applied Price: Price basis for calculations
- Shift: Shift value of the indicator
Conclusion
The Vinini LRMA Color Indicator is a hybrid tool that combines Simple Moving Average (SMA) with Linear Regression to display the market trend in a simple, color-coded format.
The color change of the indicator line highlights price fluctuations and provides buy and sell signals. Moreover, by leveraging both moving average and regression, this indicator effectively reduces price noise and filters out false market fluctuations.
Vinini LRMA Color Indicator MT4 PDF
Vinini LRMA Color Indicator MT4 PDF
Click to download Vinini LRMA Color Indicator MT4 PDFDoes this indicator generate buy and sell signals?
Yes, the Vinini LRMA Color Indicator provides buy and sell signals by changing the color of the moving average line.
Which trading styles is this indicator suitable for?
The Vinini LRMA Color Indicator is suitable for all trading styles.


